Copyright
©2013 Baishideng Publishing Group Co.
World J Orthop. Oct 18, 2013; 4(4): 259-266
Published online Oct 18, 2013. doi: 10.5312/wjo.v4.i4.259
Published online Oct 18, 2013. doi: 10.5312/wjo.v4.i4.259
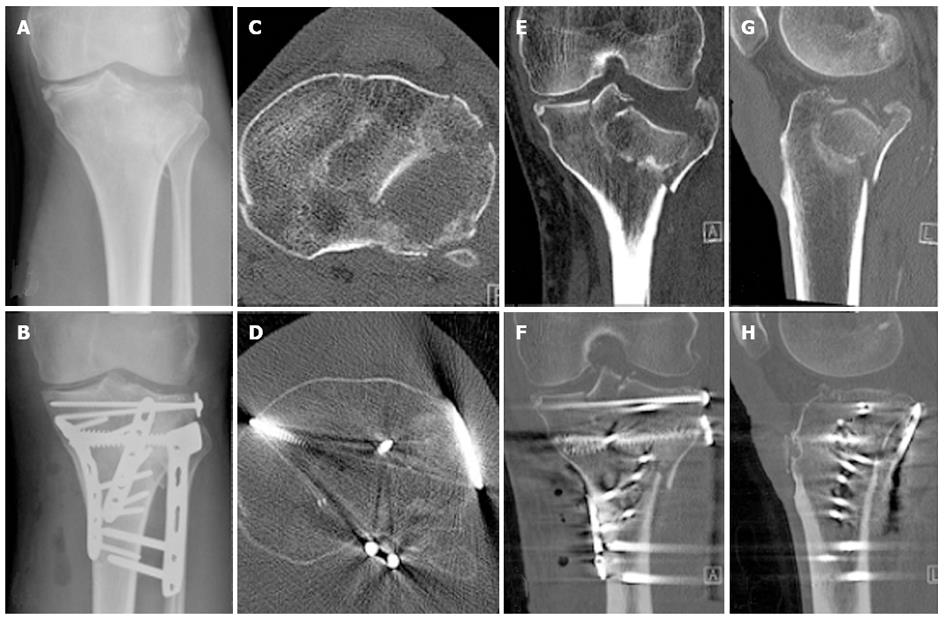
Figure 1 Radiographic imaging of the fracture of Patient 1 illustrating the initial displacement as well as the operative reduction and fixation achieved.
A: Preoperative X-ray; B: Post operative X-ray; C: Preoperative transverse computed tomography (CT); D: Post operative transverse CT; E: Preoperative coronal CT; F: Post operative coronal CT; G: Preoperative sagittal CT; H: Post operative sagittal CT.
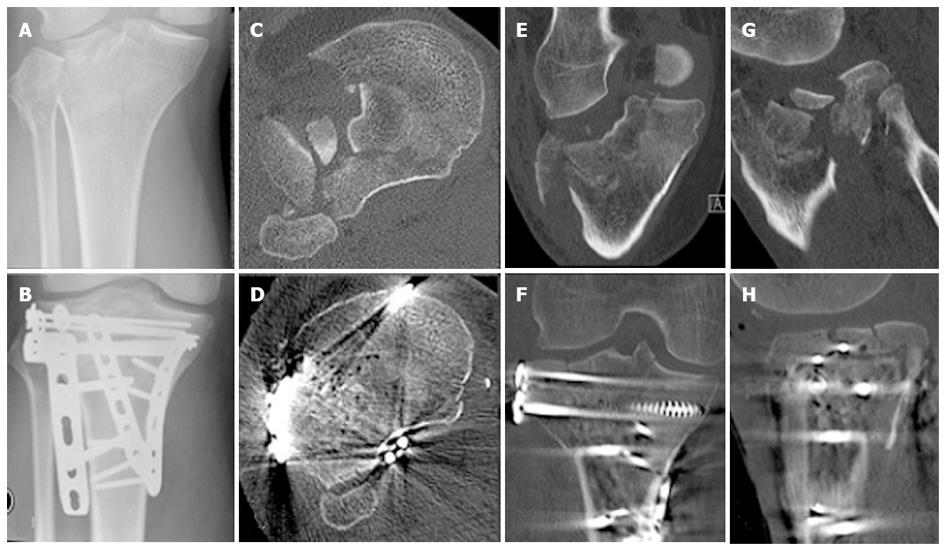
Figure 2 Radiographic imaging of the fracture of Patient 2 illustrating the initial displacement as well as the operative reduction and fixation achieved.
A: Preoperative X-ray; B: Post operative X-ray; C: Preoperative transverse computed tomography (CT); D: Post operative transverse CT; E: Preoperative coronal CT; F: Post operative coronal CT; G: Preoperative sagittal CT; H: Post operative sagittal CT.
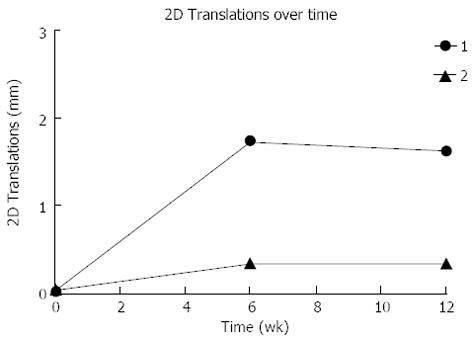
Figure 3 The distal migration of the fracture fragment for each patient over time.
2D: Two dimensional.
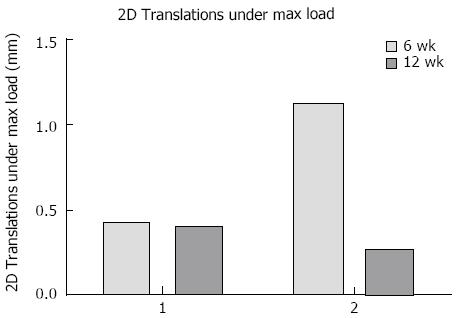
Figure 4 The two dimensional translations under the maximum load applied at each differentially loaded radiostereometric analysis examination for both cases.
2D: Two dimensional.
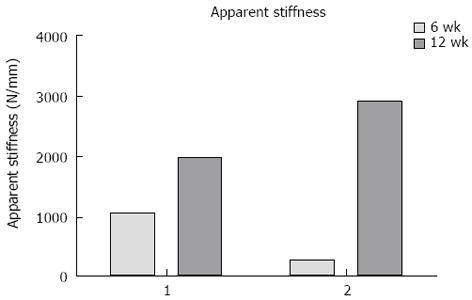
Figure 5 The apparent stiffness of each fracture at 6 and 12 wk calculated from the movement under each applied load.
Figure 6 The mean and standard deviation over time.
A: Vertical ground reaction force (GRF); B: Peak knee joint reaction force; C: Knee range of motion (ROM).
Figure 7 The mean and standard deviation over time.
A: Peak knee flexion moment; B: Peak knee extensions moment; C: Peak knee adduction moment.
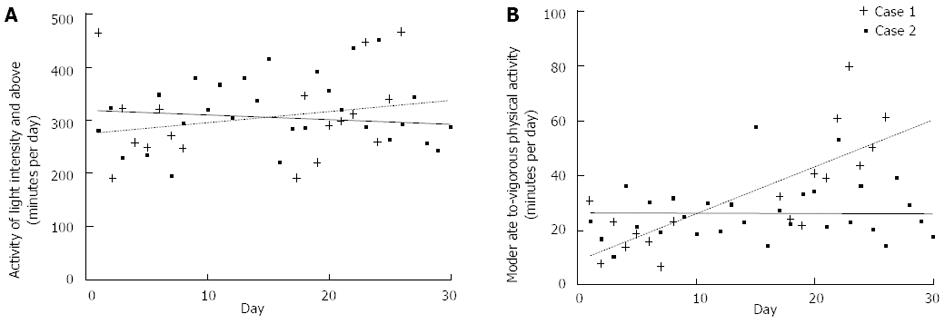
Figure 8 The physical activity of each patient over time.
A: Light intensity; B: Moderate-to-vigorous intensity.
- Citation: Callary SA, Thewlis D, Rowlands AV, Findlay DM, Solomon LB. Collecting a comprehensive evidence base to monitor fracture rehabilitation: A case study. World J Orthop 2013; 4(4): 259-266
- URL: https://www.wjgnet.com/2218-5836/full/v4/i4/259.htm
- DOI: https://dx.doi.org/10.5312/wjo.v4.i4.259


