Copyright
©2012 Baishideng Publishing Group Co.
Figure 1 3D laser scanner.
Figure 2 Anatomical model of the lumbar spine.
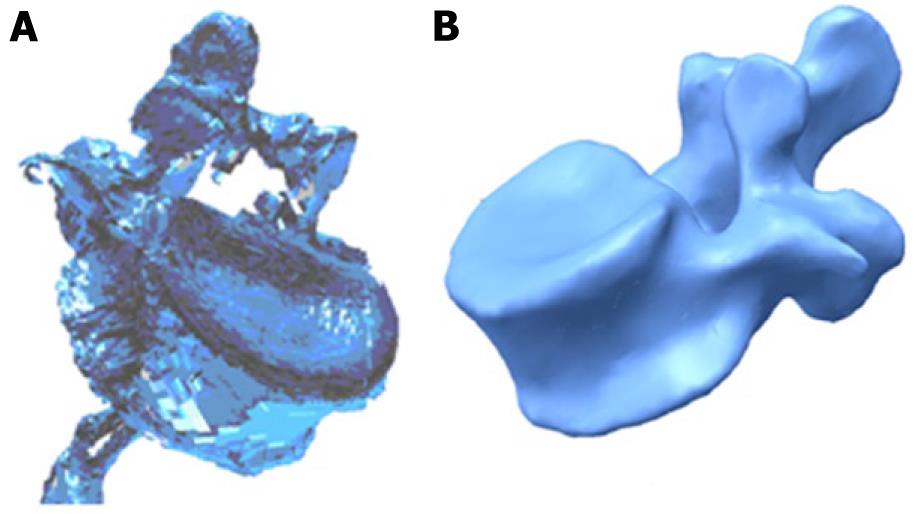
Figure 3 3D scanning of a vertebra.
A: Original without processing; B: Final after processing.
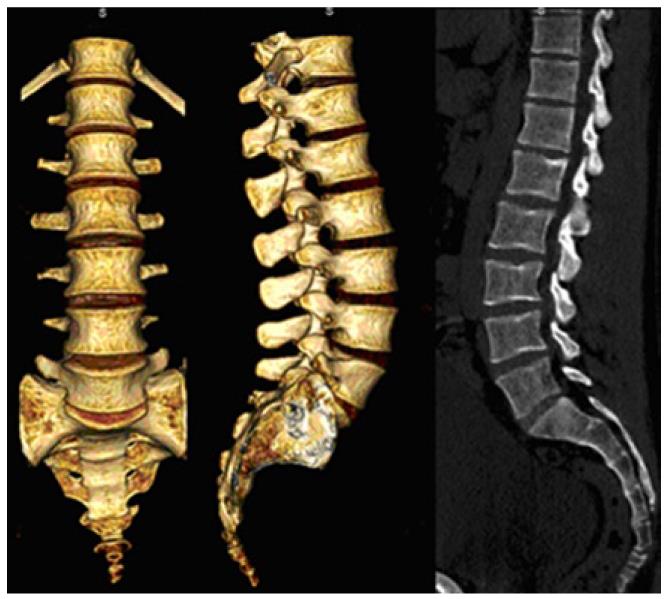
Figure 4 Volume rendering 3D reconstruction and sagittal multiplanar reconstruction of the lumbar spine.
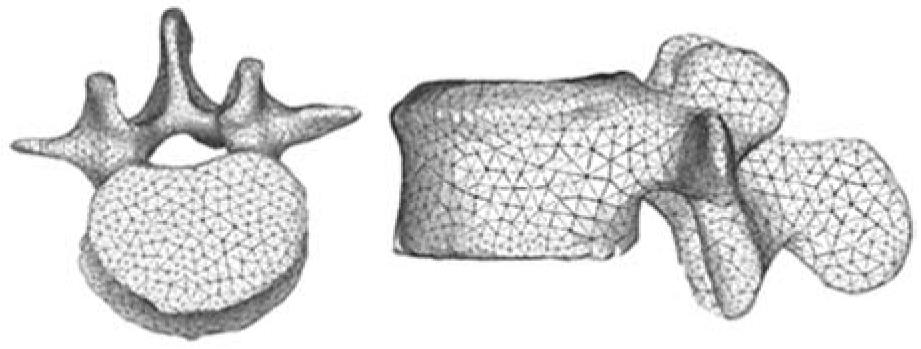
Figure 5 Meshing of a lumbar vertebra.
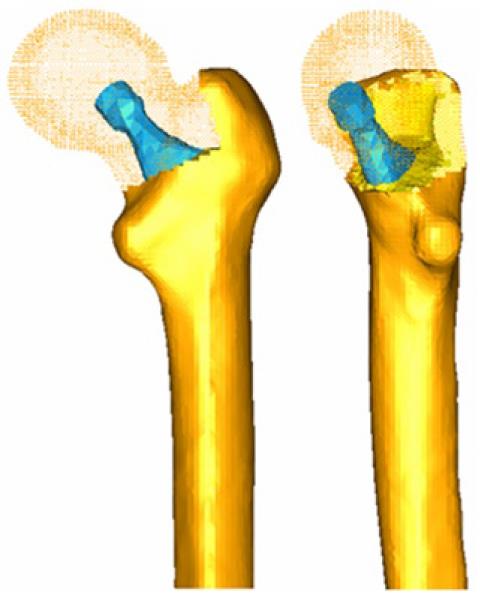
Figure 6 Meshing of proximal femur with stem.
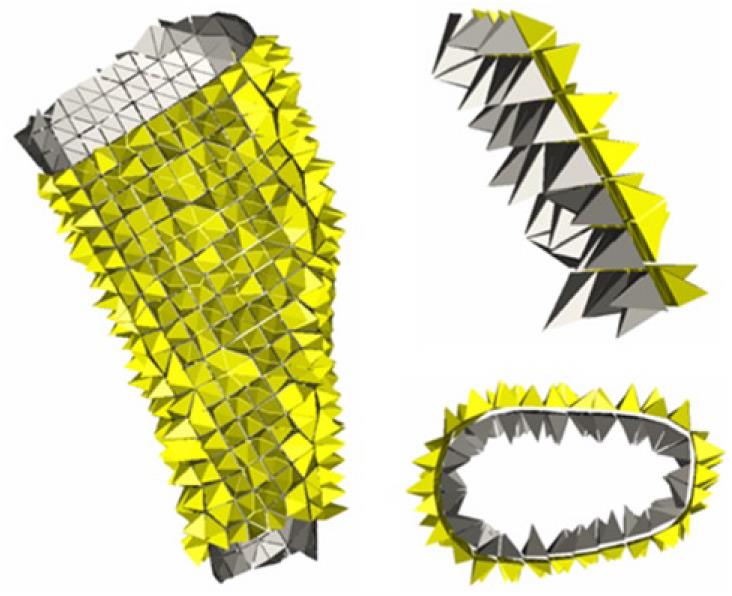
Figure 7 Contact interface femur-stem.
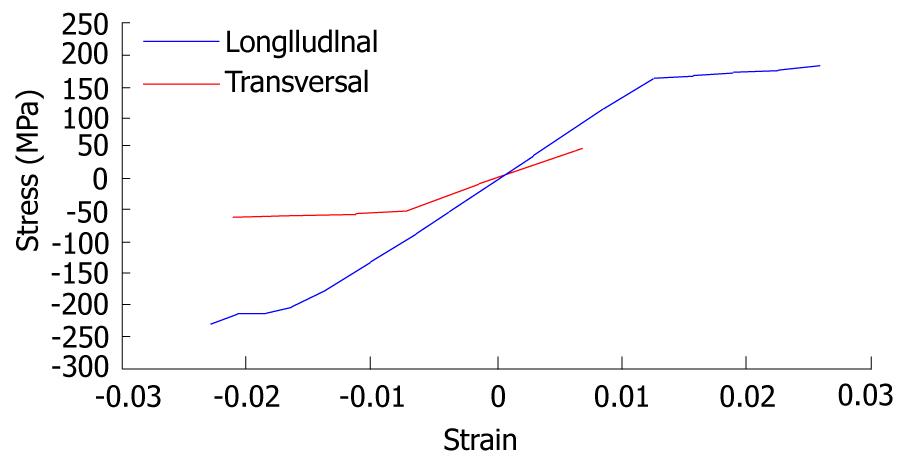
Figure 8 Strain-stress curves for cortical bone.
Figure 9 Strain-stress curves for vertebral ligaments.
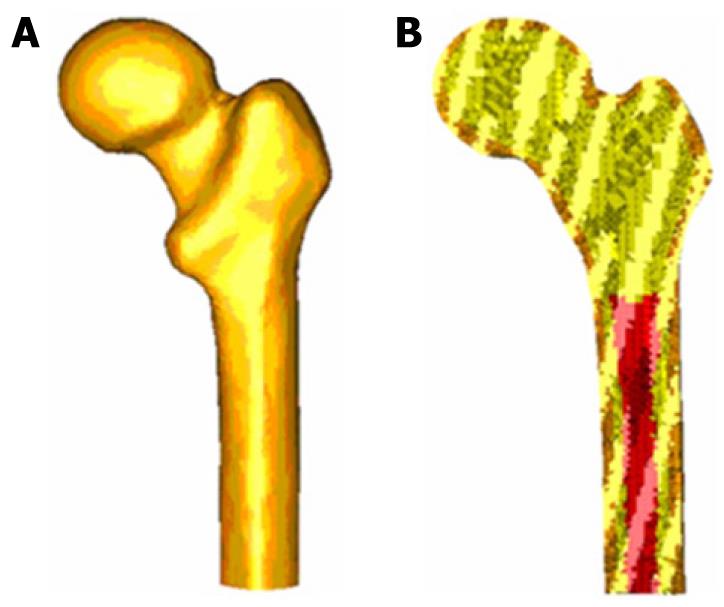
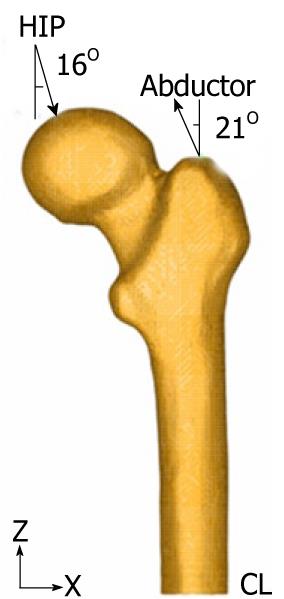
Figure 10 Finite element model of healthy femur (A) and coronal section of healthy femur model (B).
Figure 11 Boundary conditions applied in the healthy femur model.
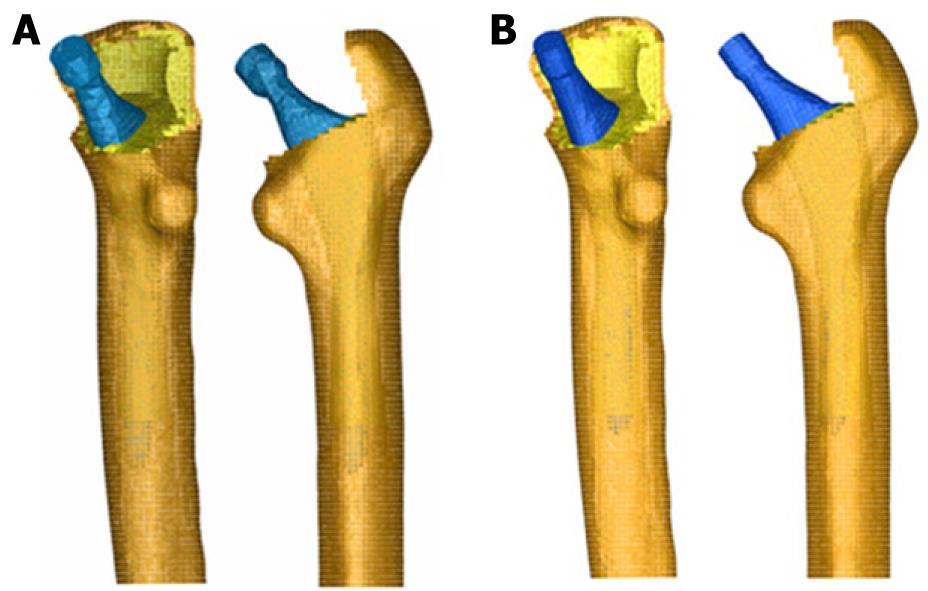
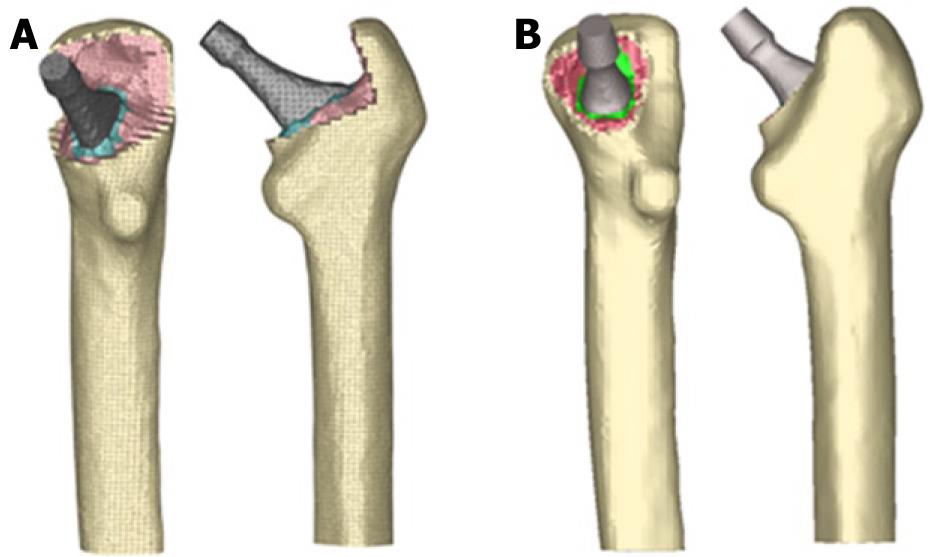
Figure 12 Removal of the femoral head and positioning of the cementless stems: (A) ABG-I and (B) ABG-II.
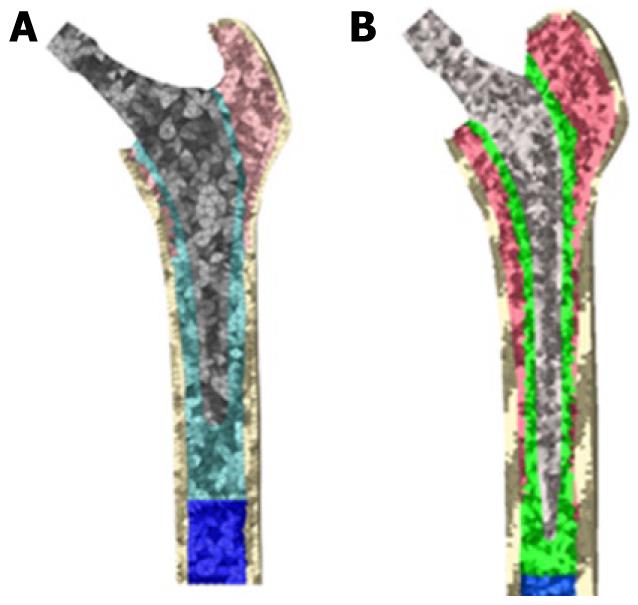
Figure 13 Finite element models of the femur with cementless prosthesis: (A) ABG-Iand (B) ABG-II.
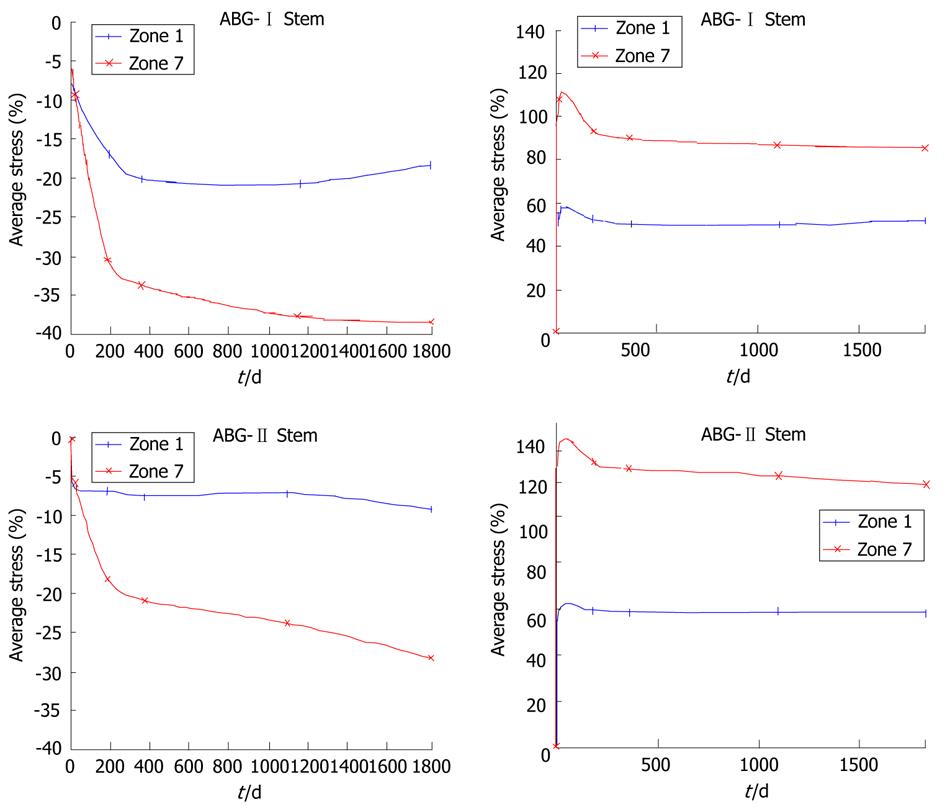
Figure 14 Bone mineral density and average von Mises stress evolution.
Figure 15 Removal of the femoral head and cemented prosthesis positioning: (A) Anatomique Benoist Girard-cemented and (B) Versys.
Figure 16 Longitudinal section of the finite element models with cemented femoral prostheses: (A) Anatomique Benoist Girard-cemented and (B) Versys.
Figure 17 Finite element model with cemented femoral prostheses.
A: Anatomique Benoist Girard-cemented; B: Versys.
Figure 18 Bone mineral density and average von Mises stress evolution.
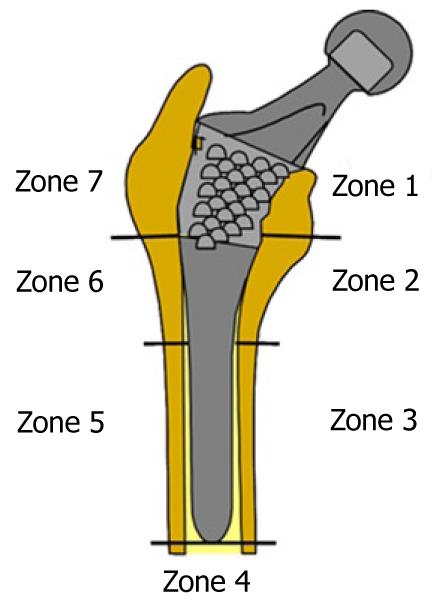
Figure 19 Gruen zones.
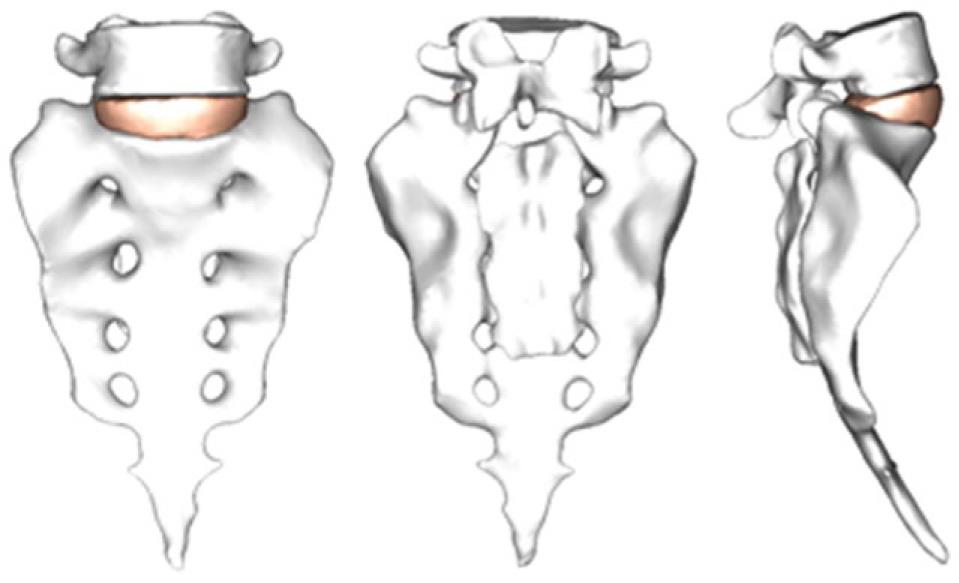
Figure 20 Geometrical model corresponding to the S1-L5 functional unit.
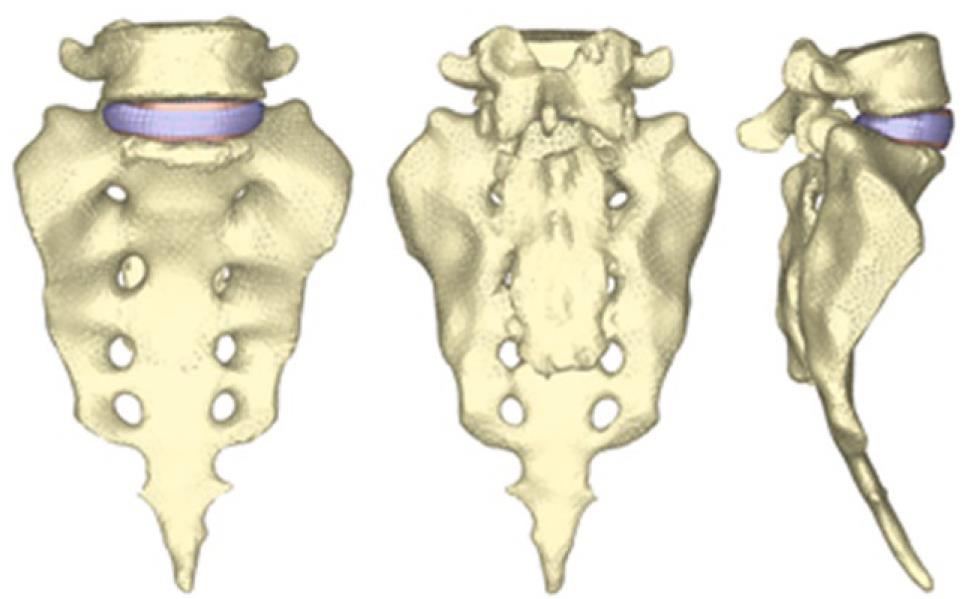
Figure 21 Finite element model corresponding to the S1-L5 functional unit.
Figure 22 Flexion-extension movement of the S1-L5 functional unit.
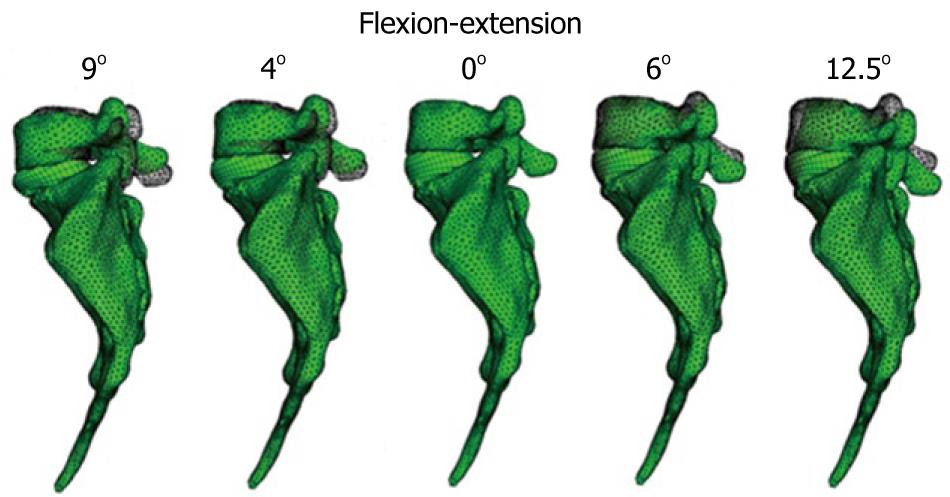
Figure 23 Deformed shapes of the S1-L5 functional unit for the flexion-extension movement.
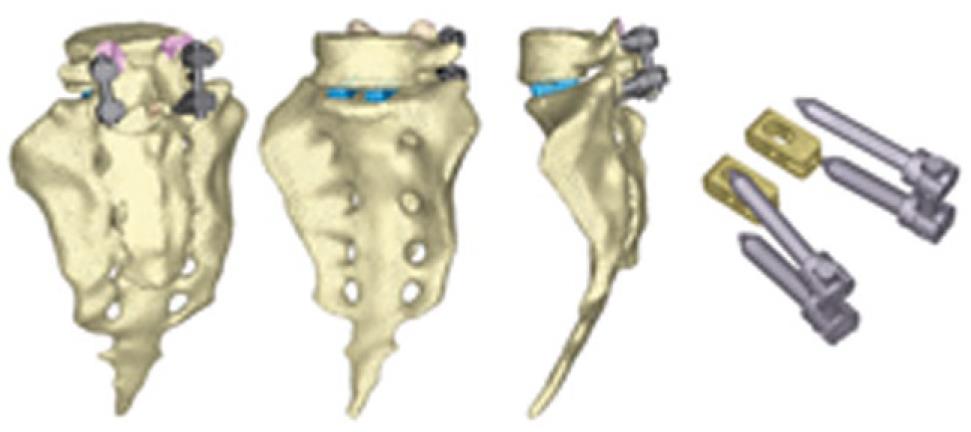
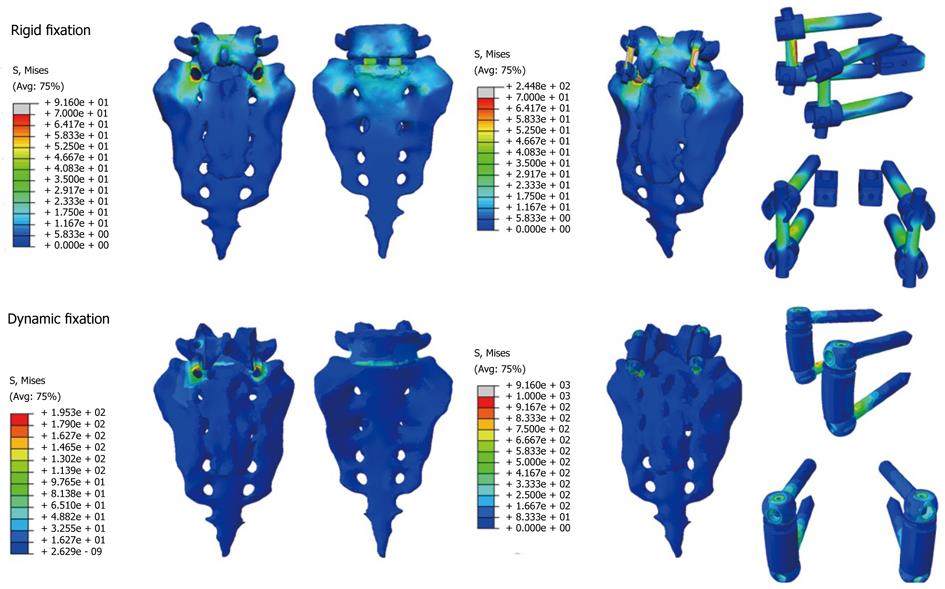
Figure 24 Finite element model corresponding to the S1-L5 functional unit with rigid fixation.
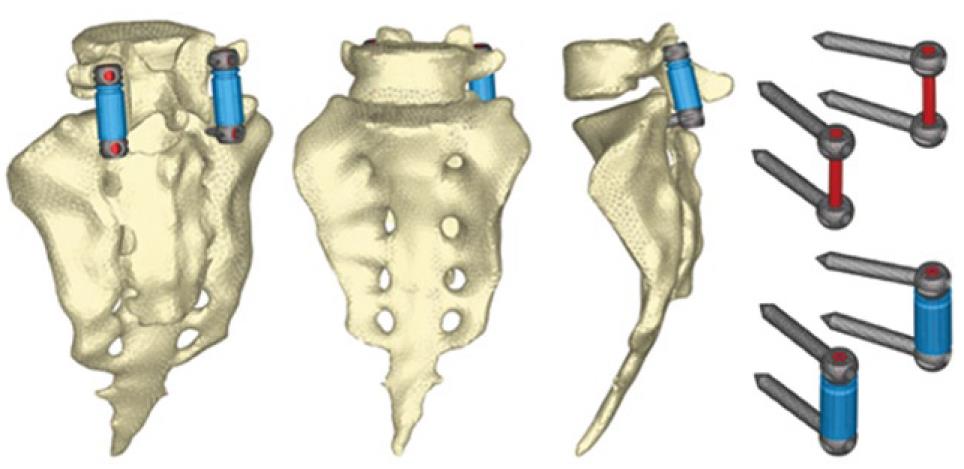
Figure 25 Finite element model corresponding to the S1-L5 functional unit with dynamic fixation.
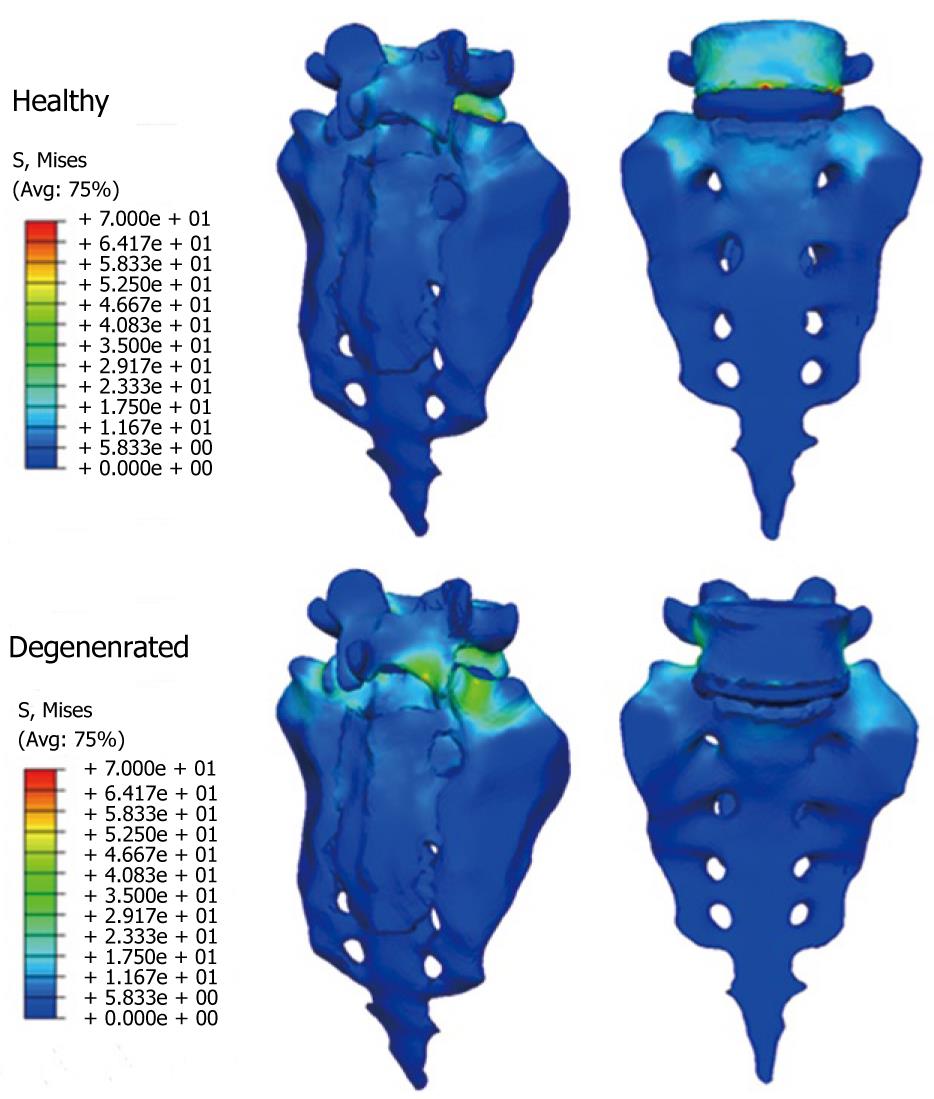
Figure 26 Von Mises stresses for the healthy and degenerated models.
Figure 27 Von Mises stresses for the implanted models.
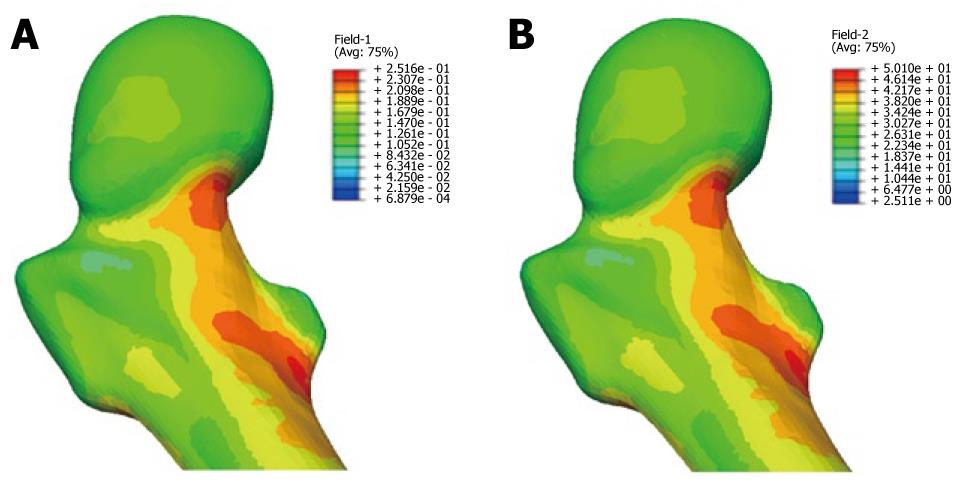
Figure 28 Damage map at the femoral head (A) and fracture probability map at the femoral head (B).
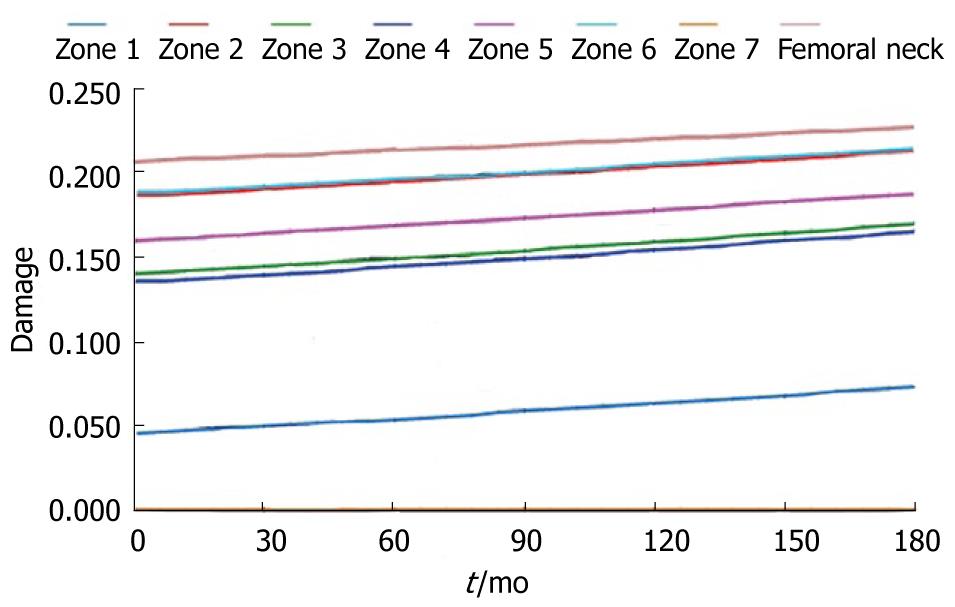
Figure 29 Damage evolution.
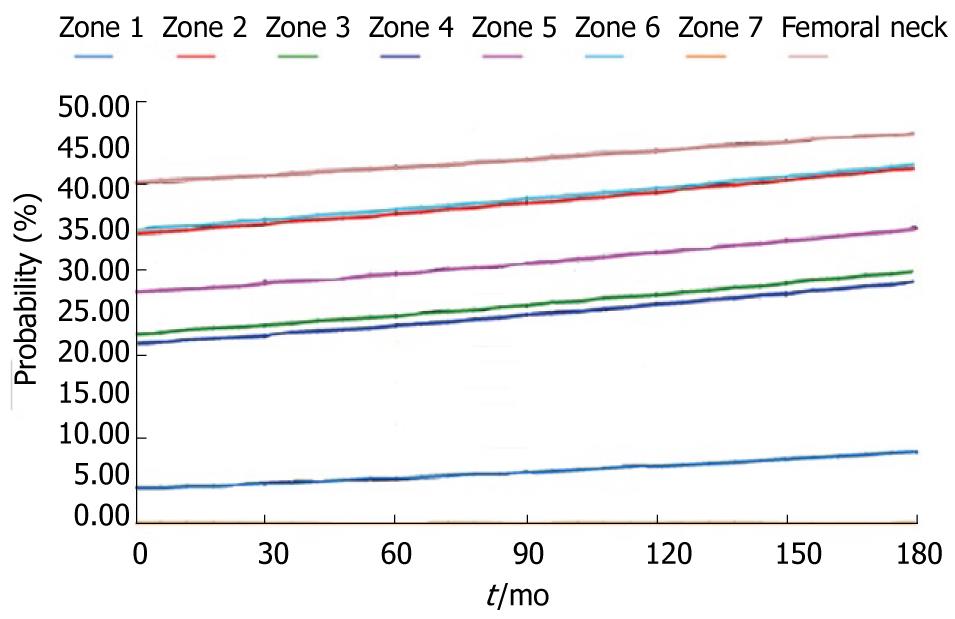
Figure 30 Evolution of the probability of fracture.
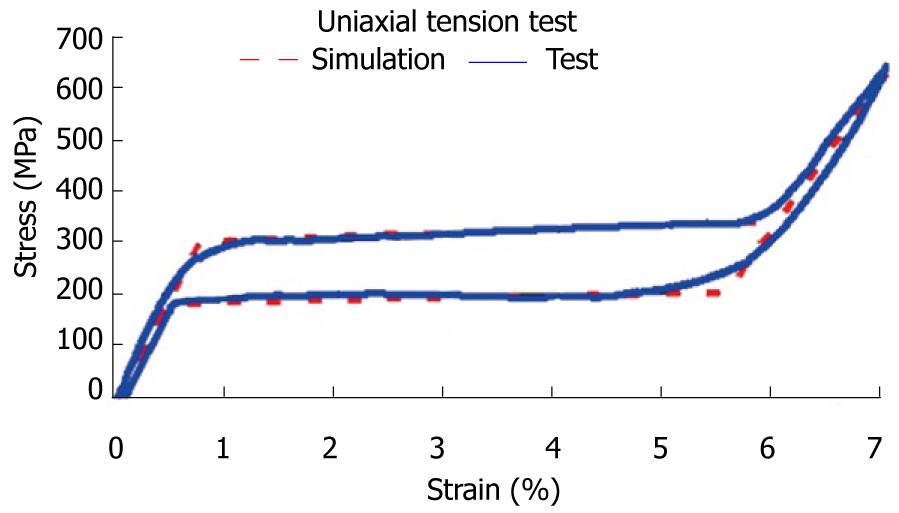
Figure 31 Stress-strain curve for loading and unloading process corresponding to the NiTi alloy at 22 °C.
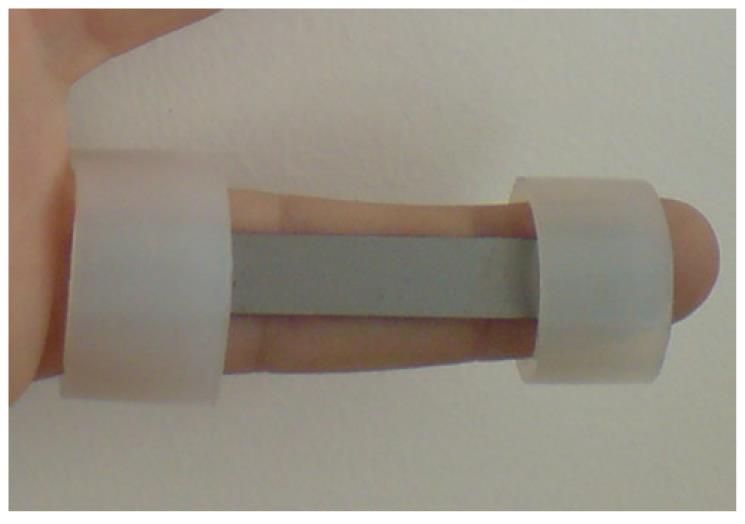
Figure 32 Prototype of the designed NiTi splint.
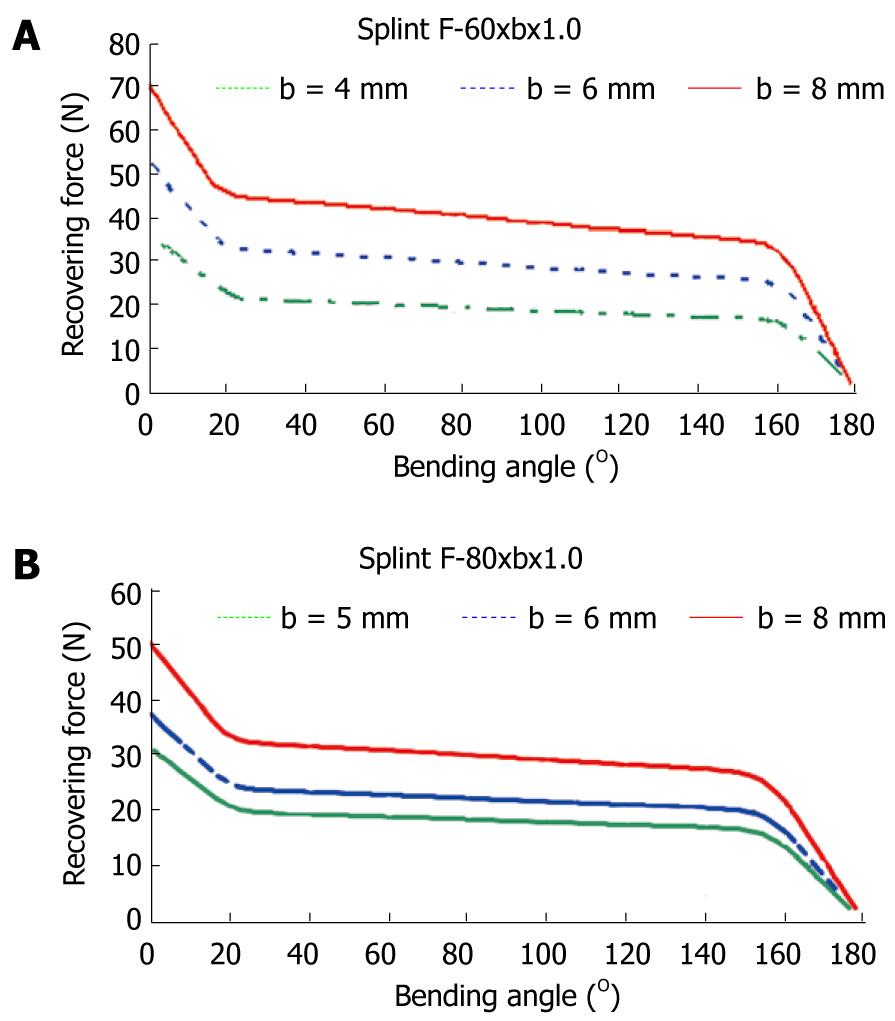
Figure 33 Recovering force-angle curves.
A: Length 60.0 mm, width variable, thickness 1.0 mm; B: Length 80.0 mm, width variable, thickness 1.0 mm.
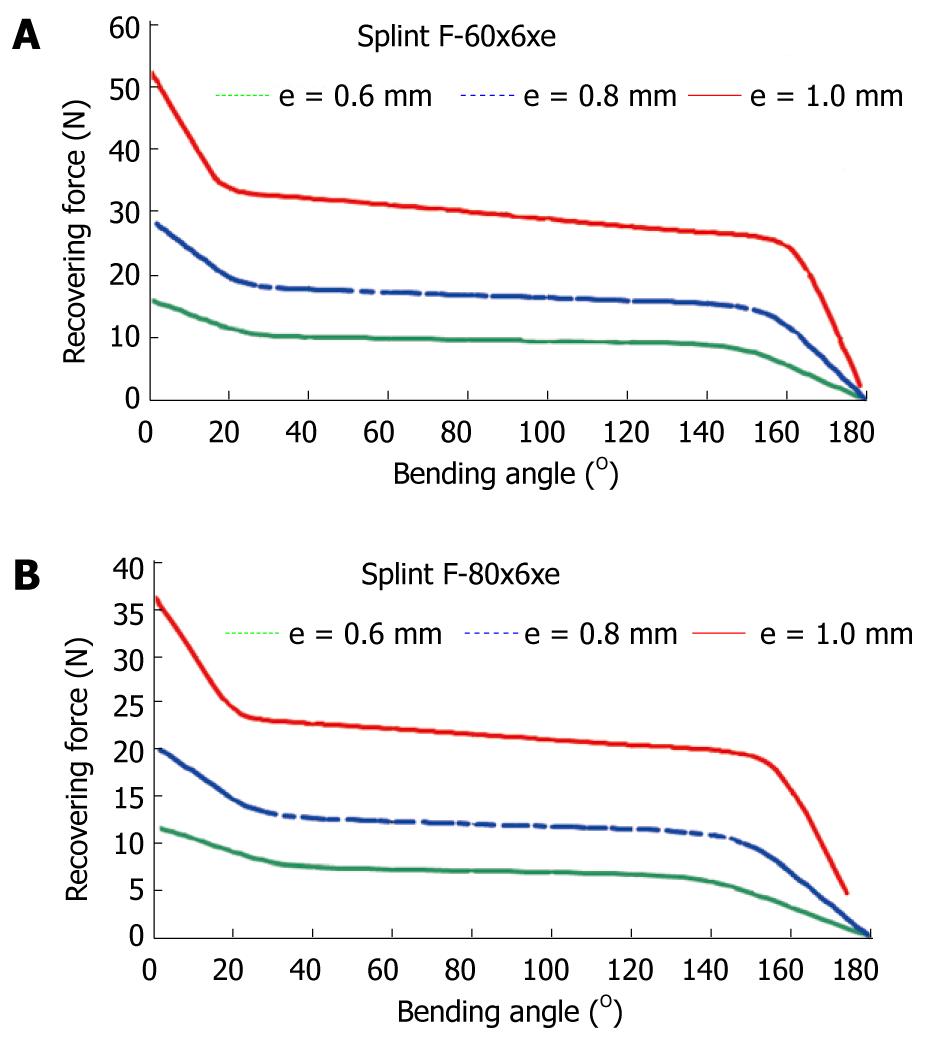
Figure 34 Recovering force-angle curves.
A: Length 60.0 mm, width 6.0 mm, thickness variable; B: Length 80.0 mm, width 6.0 mm, thickness variable.
Figure 35 Force transmission mechanism for Bort type splints (A) and Force transmission mechanism for the designed splint (B).
- Citation: Herrera A, Ibarz E, Cegoñino J, Lobo-Escolar A, Puértolas S, López E, Mateo J, Gracia L. Applications of finite element simulation in orthopedic and trauma surgery. World J Orthop 2012; 3(4): 25-41
- URL: https://www.wjgnet.com/2218-5836/full/v3/i4/25.htm
- DOI: https://dx.doi.org/10.5312/wjo.v3.i4.25


