Copyright
©The Author(s) 2025.
World J Orthop. Aug 18, 2025; 16(8): 110332
Published online Aug 18, 2025. doi: 10.5312/wjo.v16.i8.110332
Published online Aug 18, 2025. doi: 10.5312/wjo.v16.i8.110332
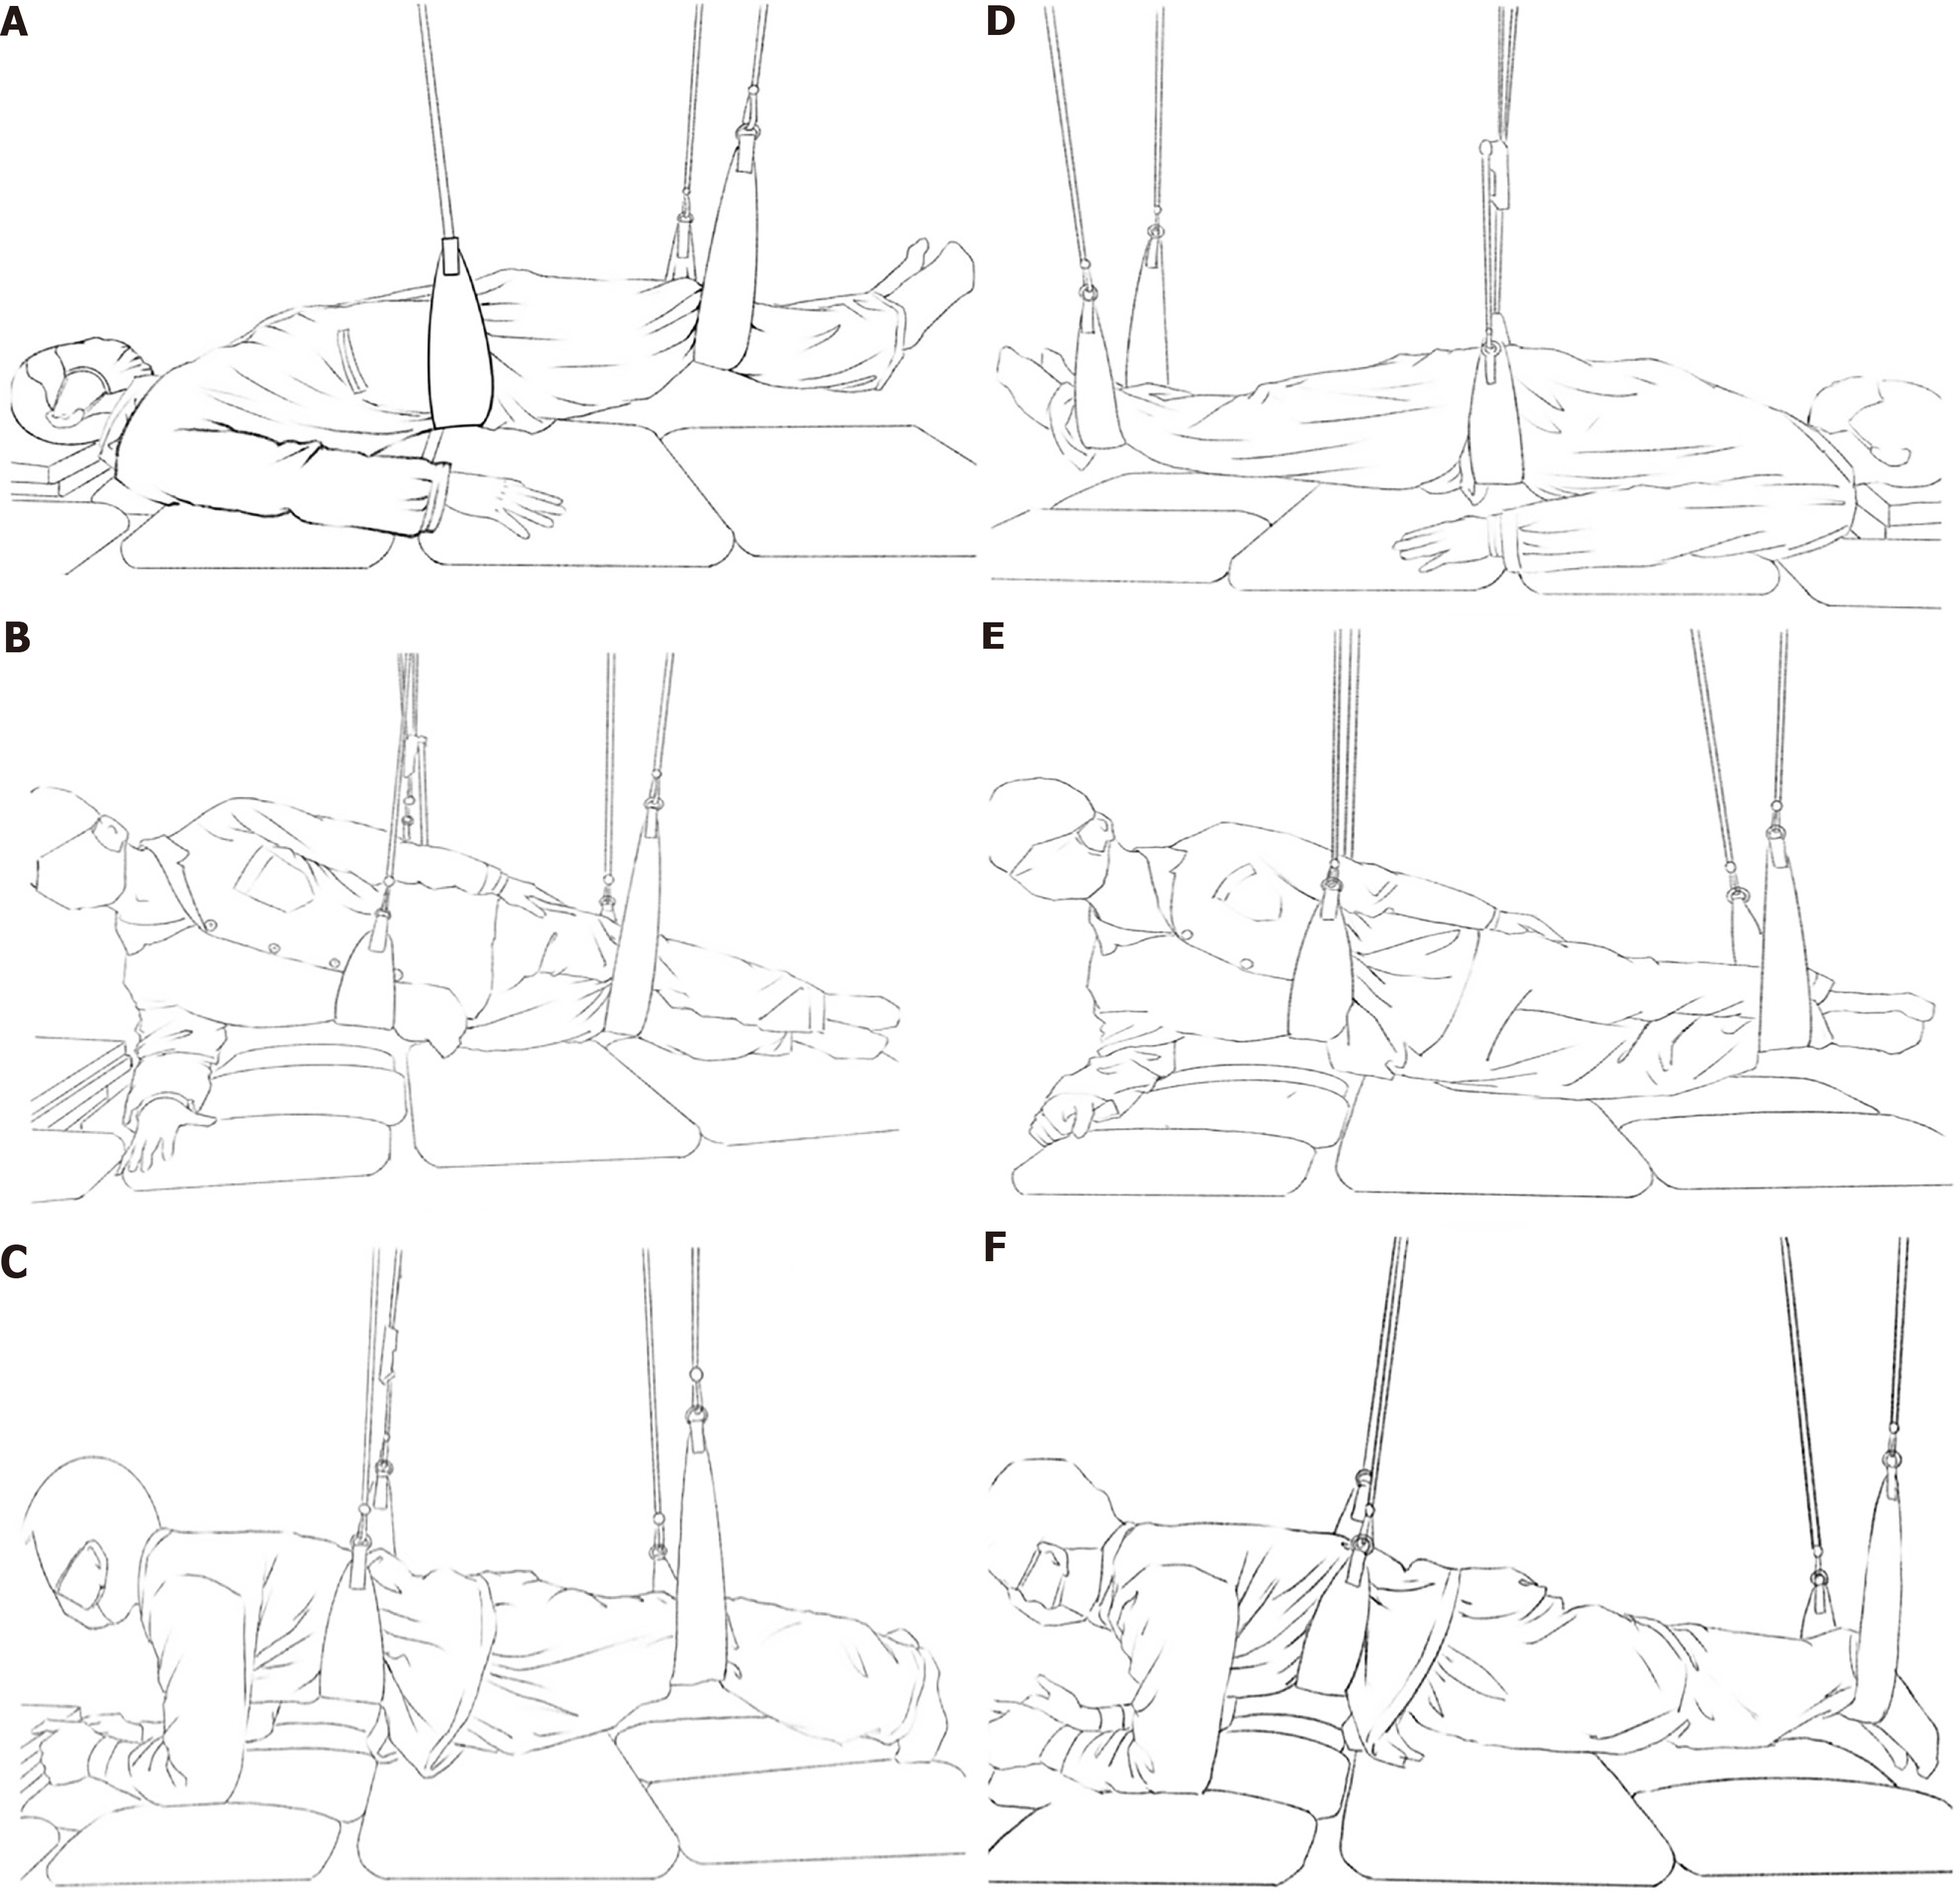
Figure 1 Schematic diagram of postural correction training.
A: Supine position with knee joint suspension; B: Lateral decubitus position with knee joint suspension; C: Prone position with knee joint suspension; D: Supine position with ankle joint suspension; E: Lateral decubitus position with ankle joint suspension; F: Prone position with ankle joint suspension.
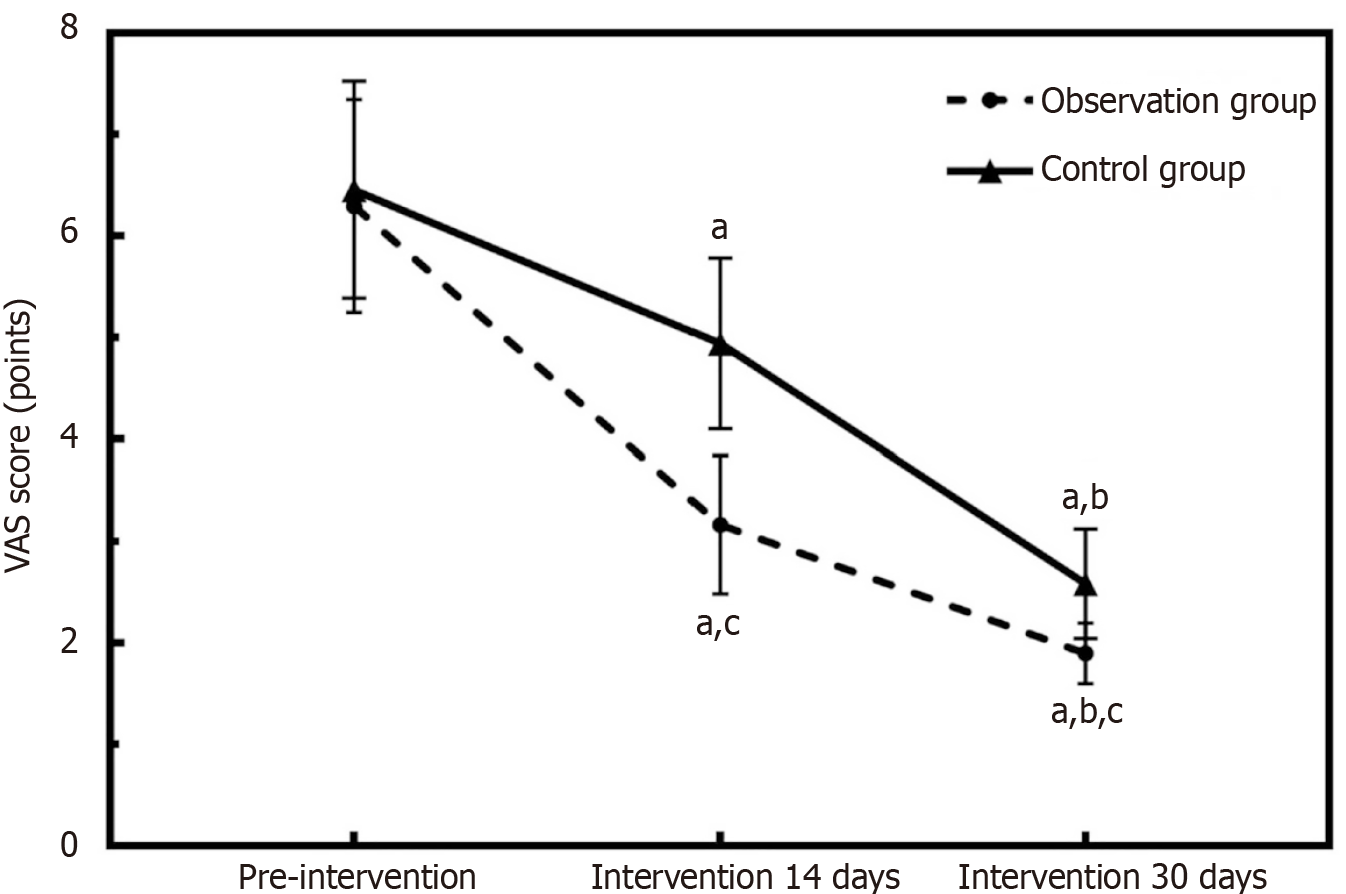
Figure 2 Graph of trend in changes of visual analog scale scores in the two groups.
aP < 0.05, within-group vs pre-intervention; bP < 0.05, within-group vs 14 days of intervention; cP < 0.05, between-group comparison at the same time point. VAS: Visual analog scale.
- Citation: Chen QQ, Liu Y, Yang JH, Yang B. Postural correction training improves chronic pain, nerve function, and inflammation in knee osteoarthritis: A retrospective cohort study. World J Orthop 2025; 16(8): 110332
- URL: https://www.wjgnet.com/2218-5836/full/v16/i8/110332.htm
- DOI: https://dx.doi.org/10.5312/wjo.v16.i8.110332


