Copyright
©The Author(s) 2022.
World J Orthop. Nov 18, 2022; 13(11): 1029-1037
Published online Nov 18, 2022. doi: 10.5312/wjo.v13.i11.1029
Published online Nov 18, 2022. doi: 10.5312/wjo.v13.i11.1029
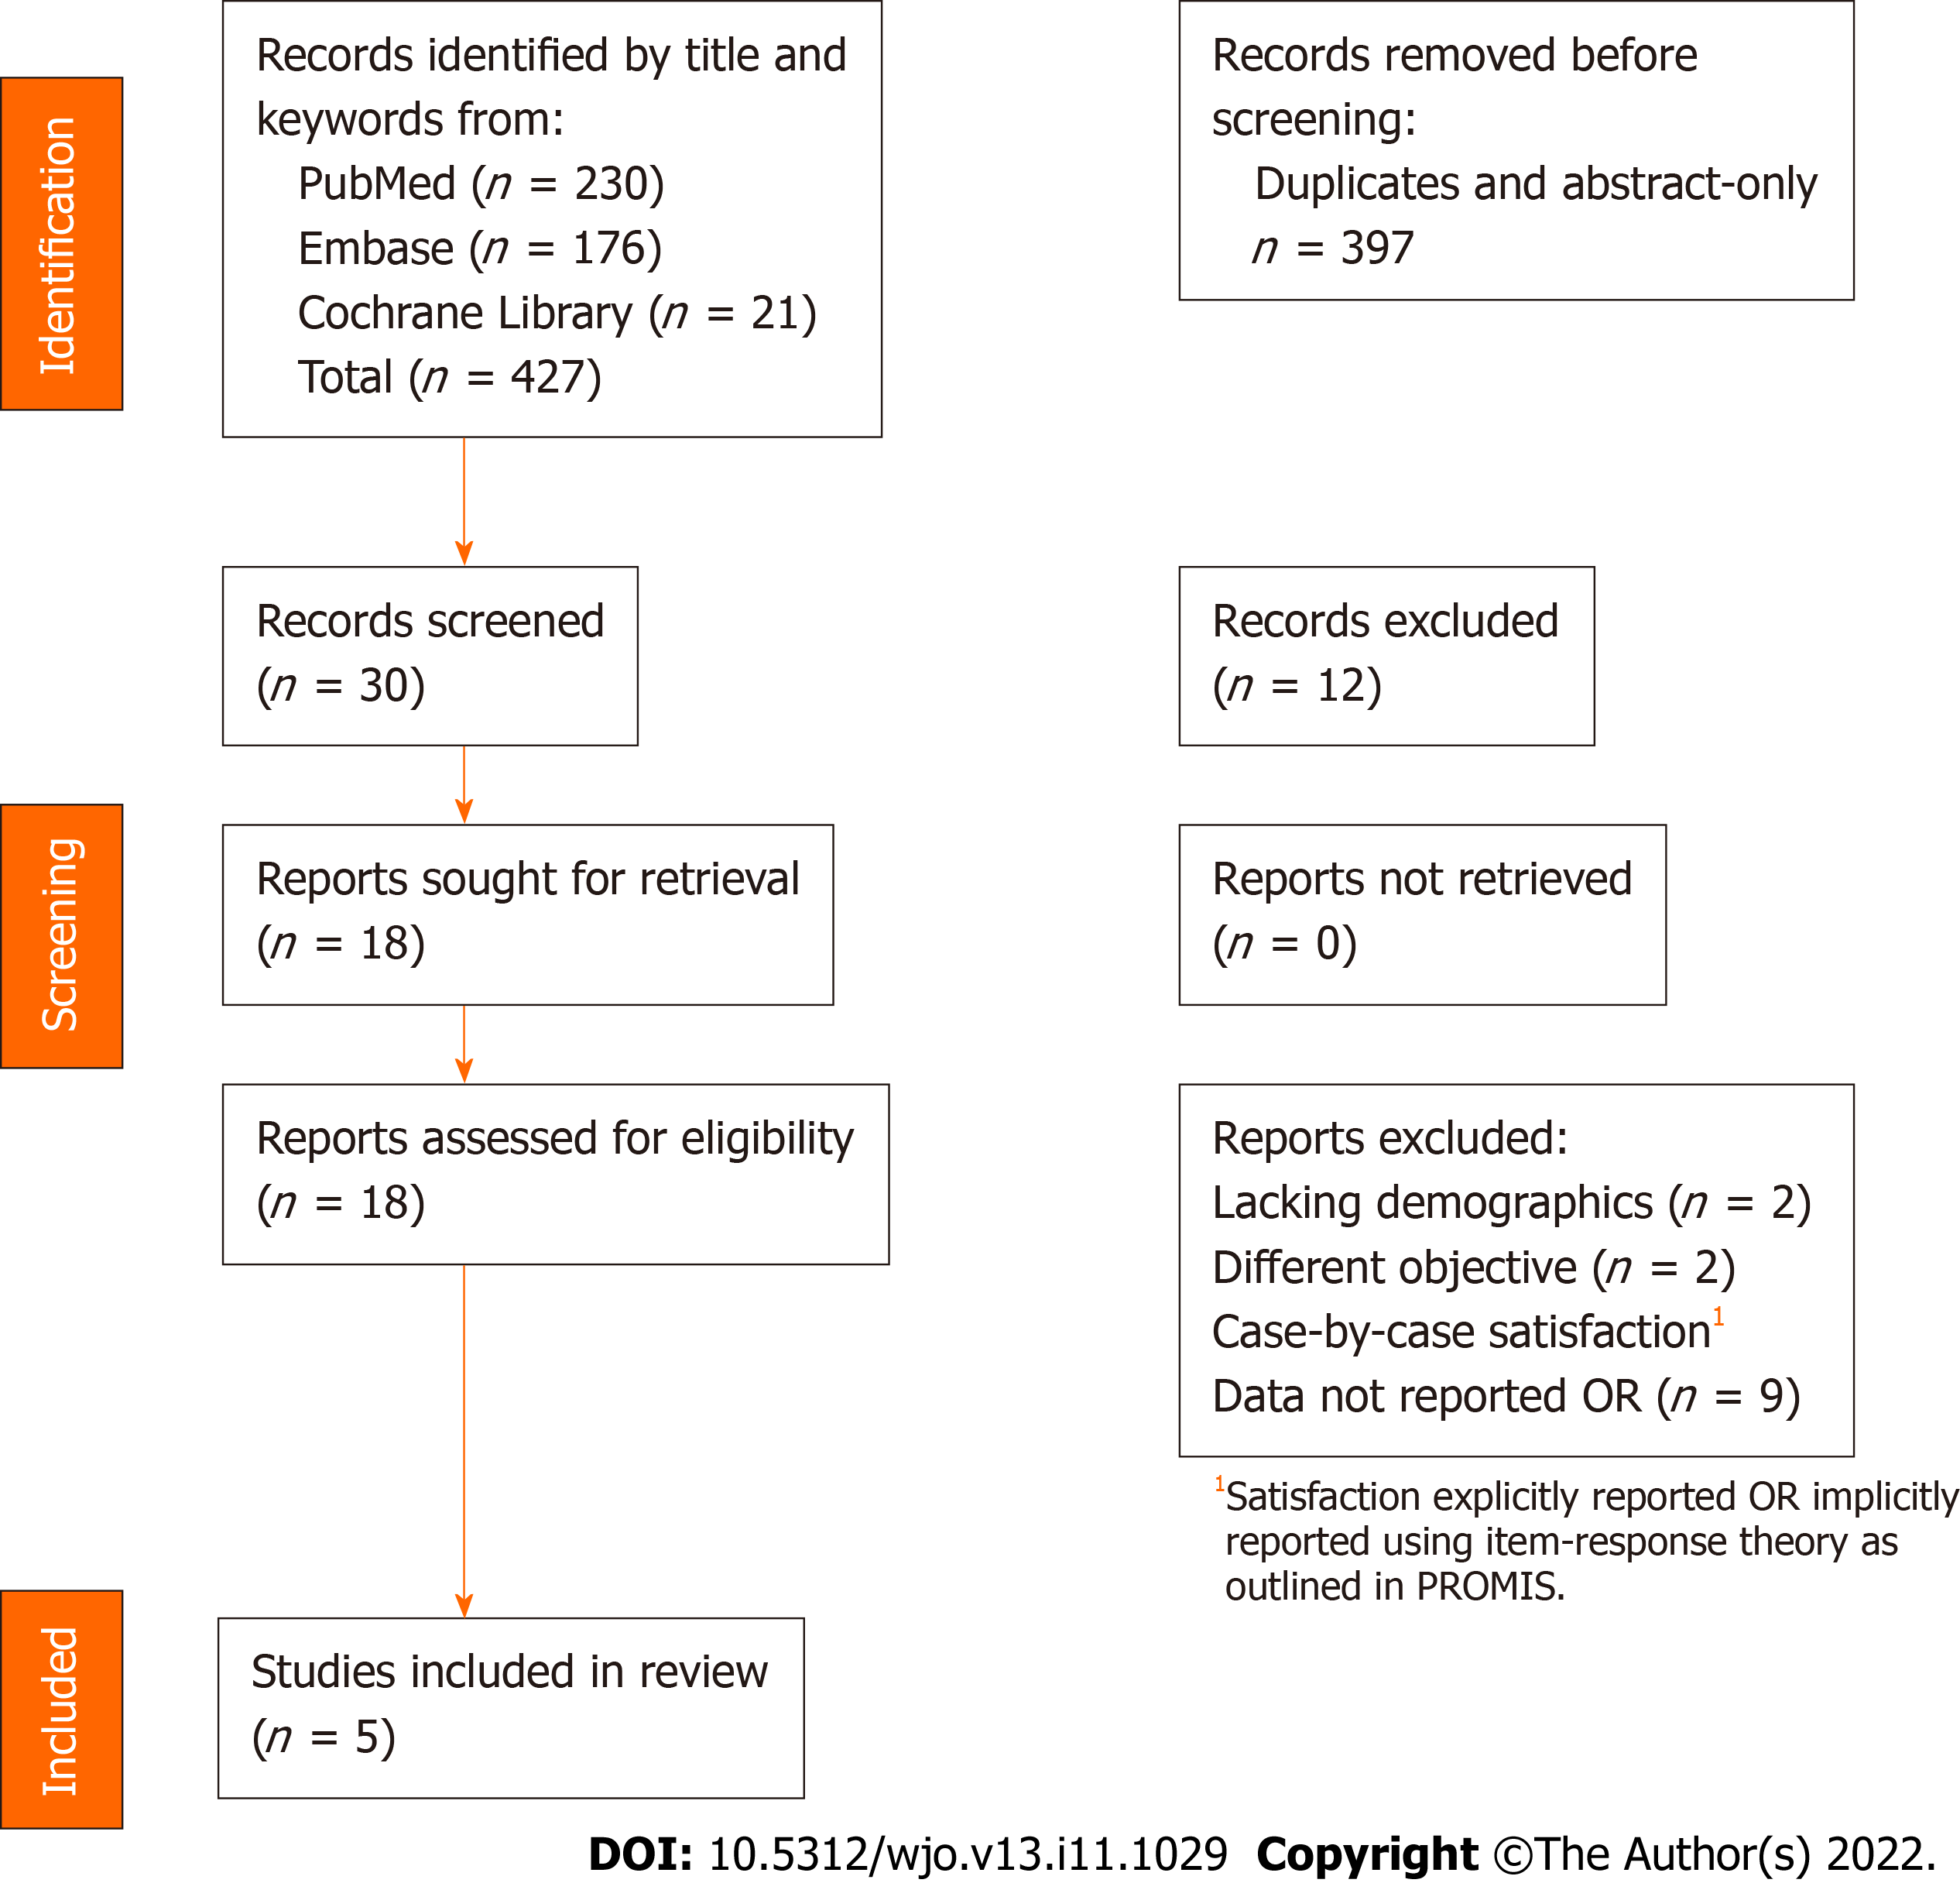
Figure 1 PRISMA flow chart.
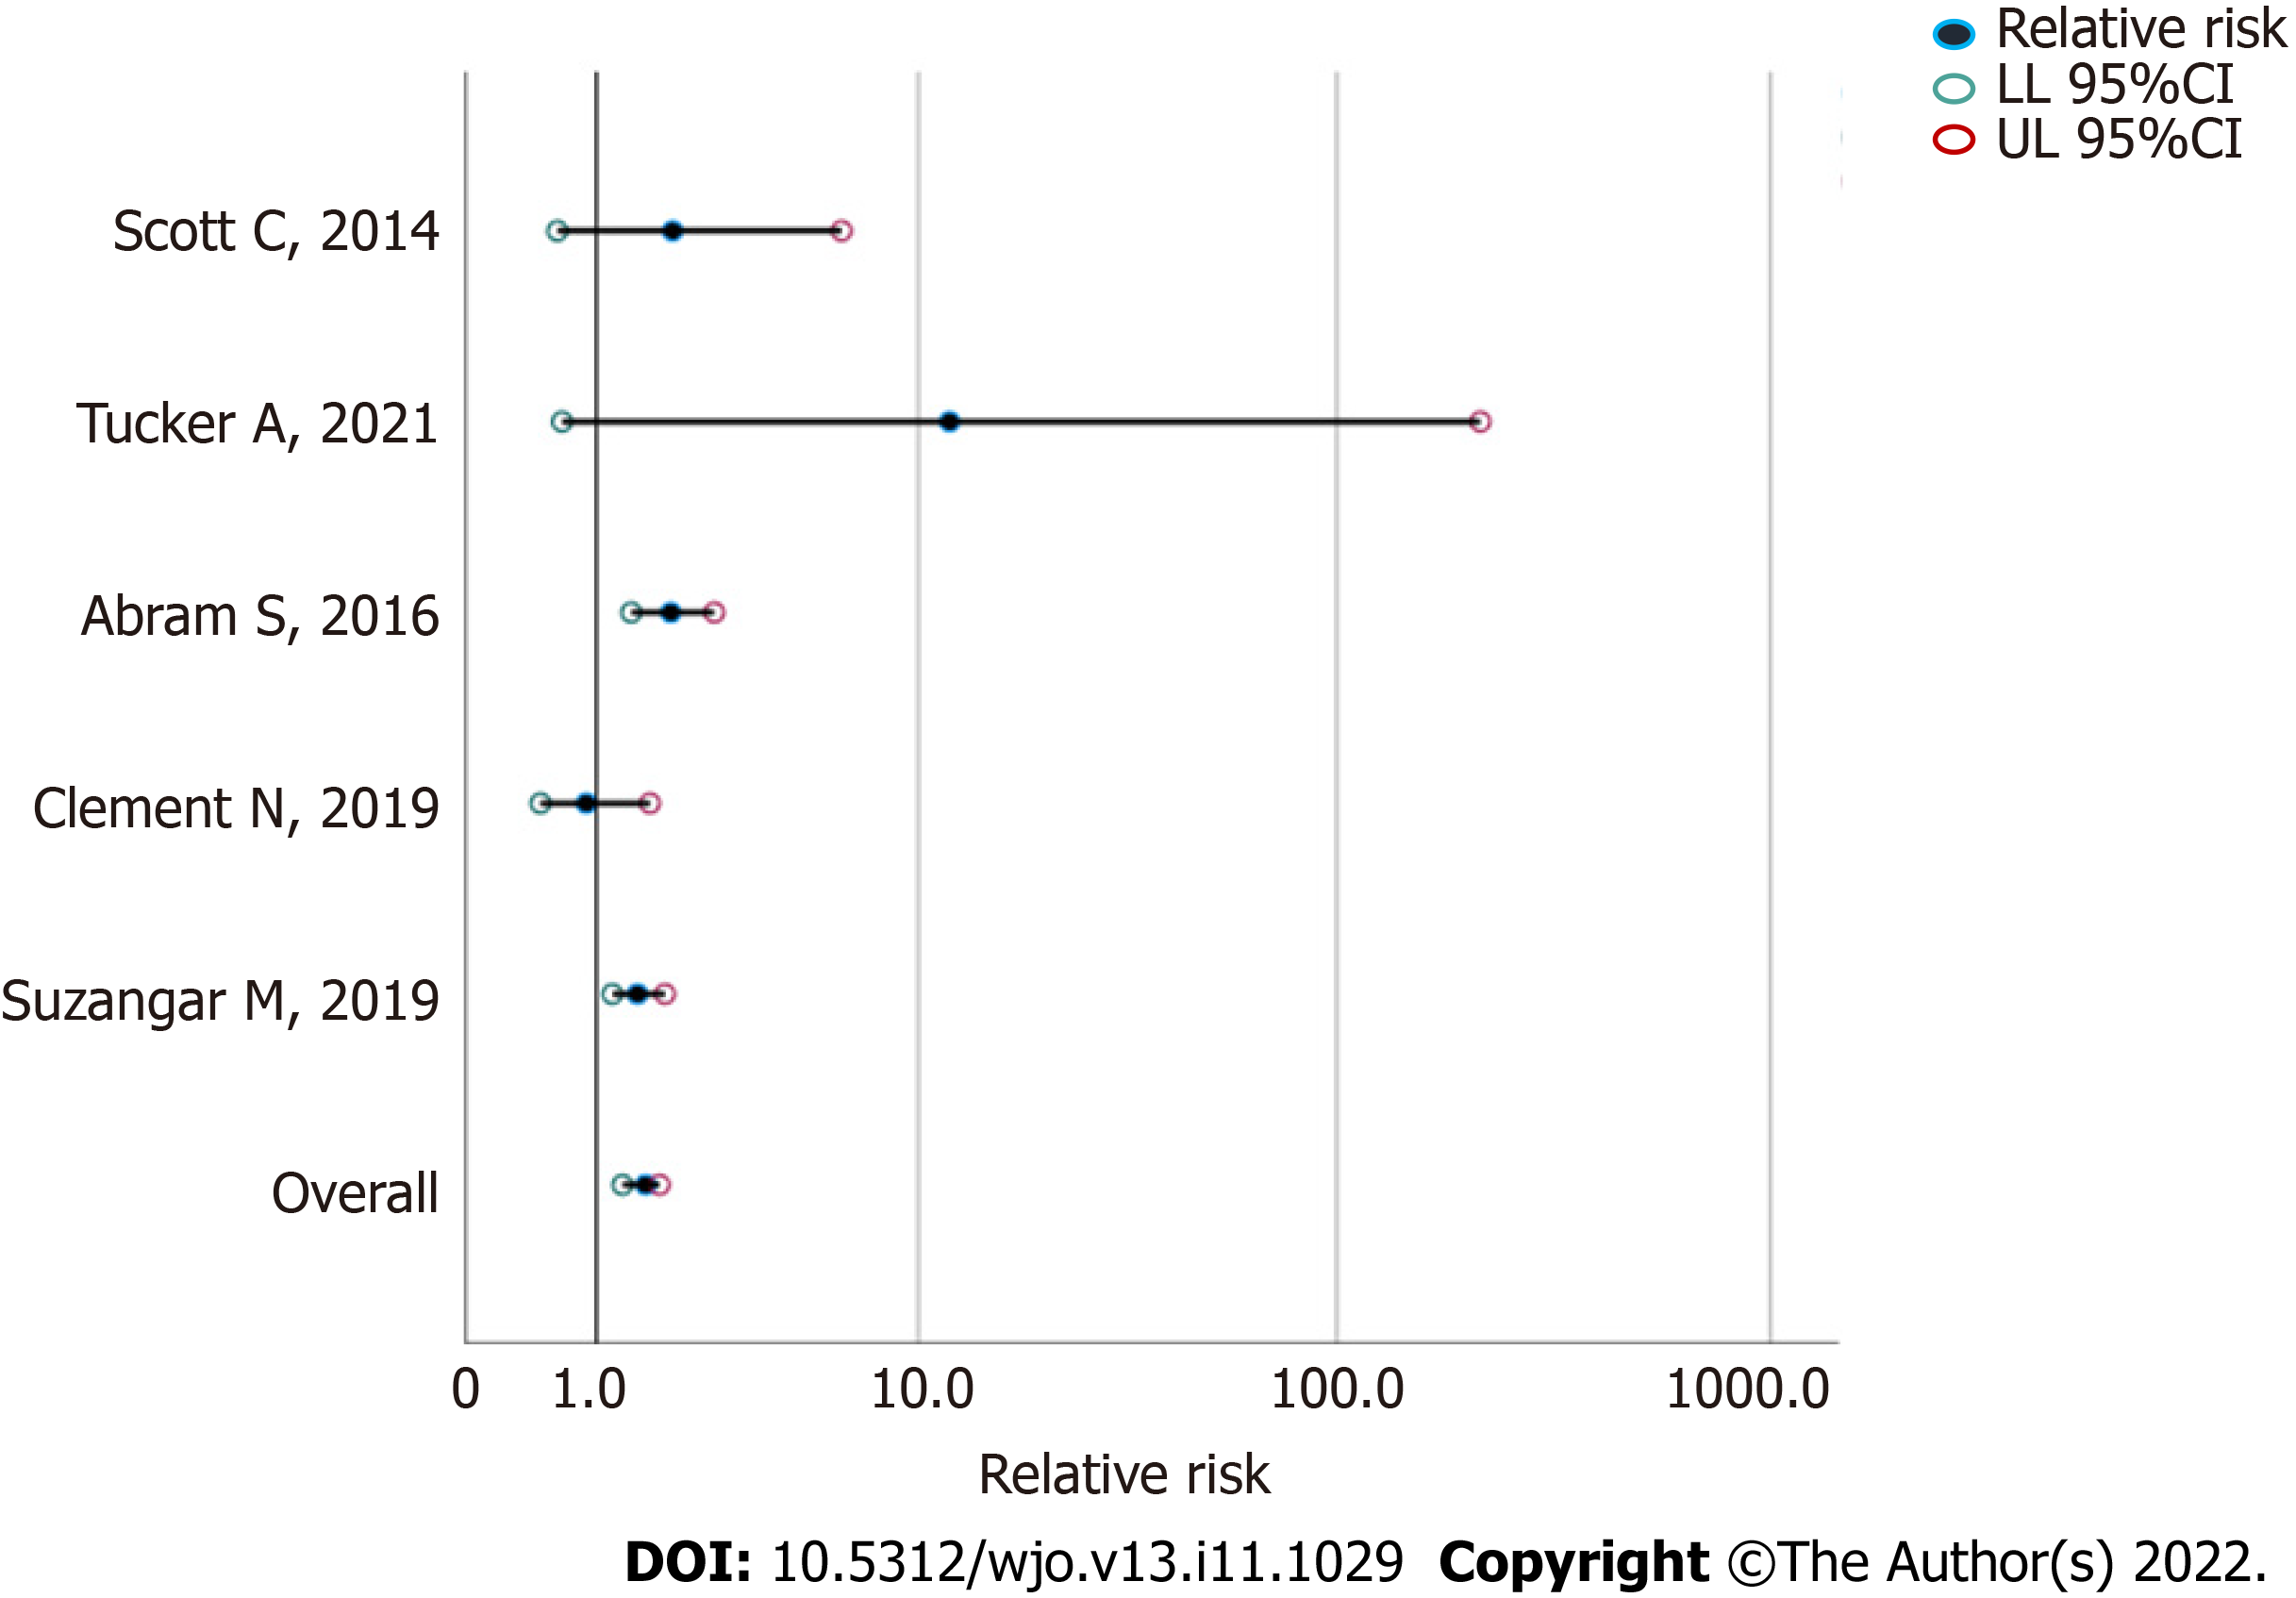
Figure 2 Relative risk of unsatisfactory outcome following total knee arthroplasty 2.
The studies are ordered along the vertical axis according to power from least (top) to greatest (bottom); the relative risk is given in a log10 scale along the horizontal axis. LL: Lower limit; UL: Upper limit.
- Citation: Gruenberger E, Bae AS, Kelly T, Ponce BA, McGrory J. Patient-reported dissatisfaction following second side in staged bilateral total knee arthroplasty: A systematic review. World J Orthop 2022; 13(11): 1029-1037
- URL: https://www.wjgnet.com/2218-5836/full/v13/i11/1029.htm
- DOI: https://dx.doi.org/10.5312/wjo.v13.i11.1029


