Copyright
©The Author(s) 2021.
World J Orthop. Feb 18, 2021; 12(2): 82-93
Published online Feb 18, 2021. doi: 10.5312/wjo.v12.i2.82
Published online Feb 18, 2021. doi: 10.5312/wjo.v12.i2.82
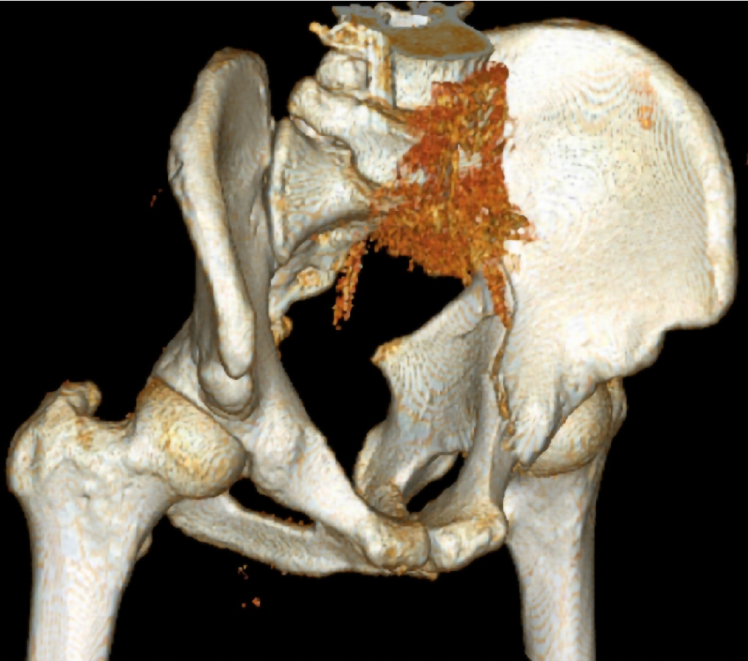
Figure 1 Computed tomography 3-dimensional reconstruction of an acetabular fracture.
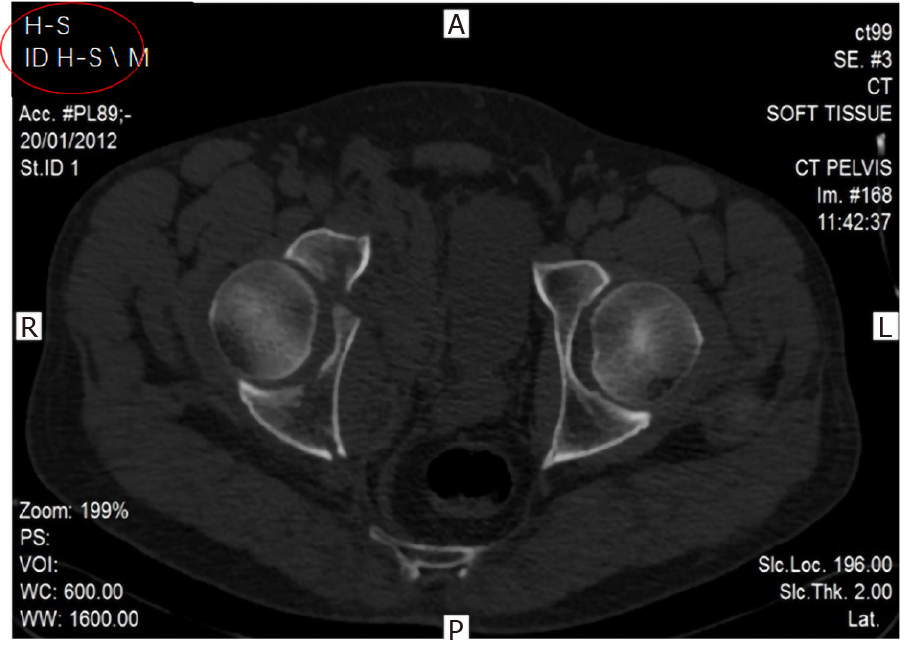
Figure 2 Computed tomography image: an axial cross-section illustrating a right acetabular fracture.
Circled in red is the anonymously assigned coding of the case. All identifying details have been omitted from the test.
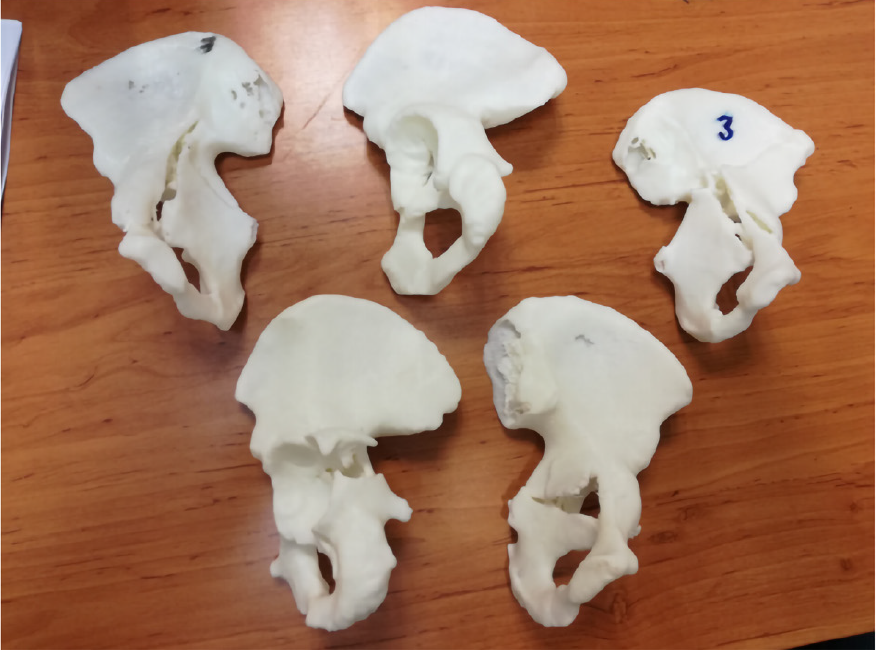
Figure 3 Three-dimensional printed models of acetabular fractures.
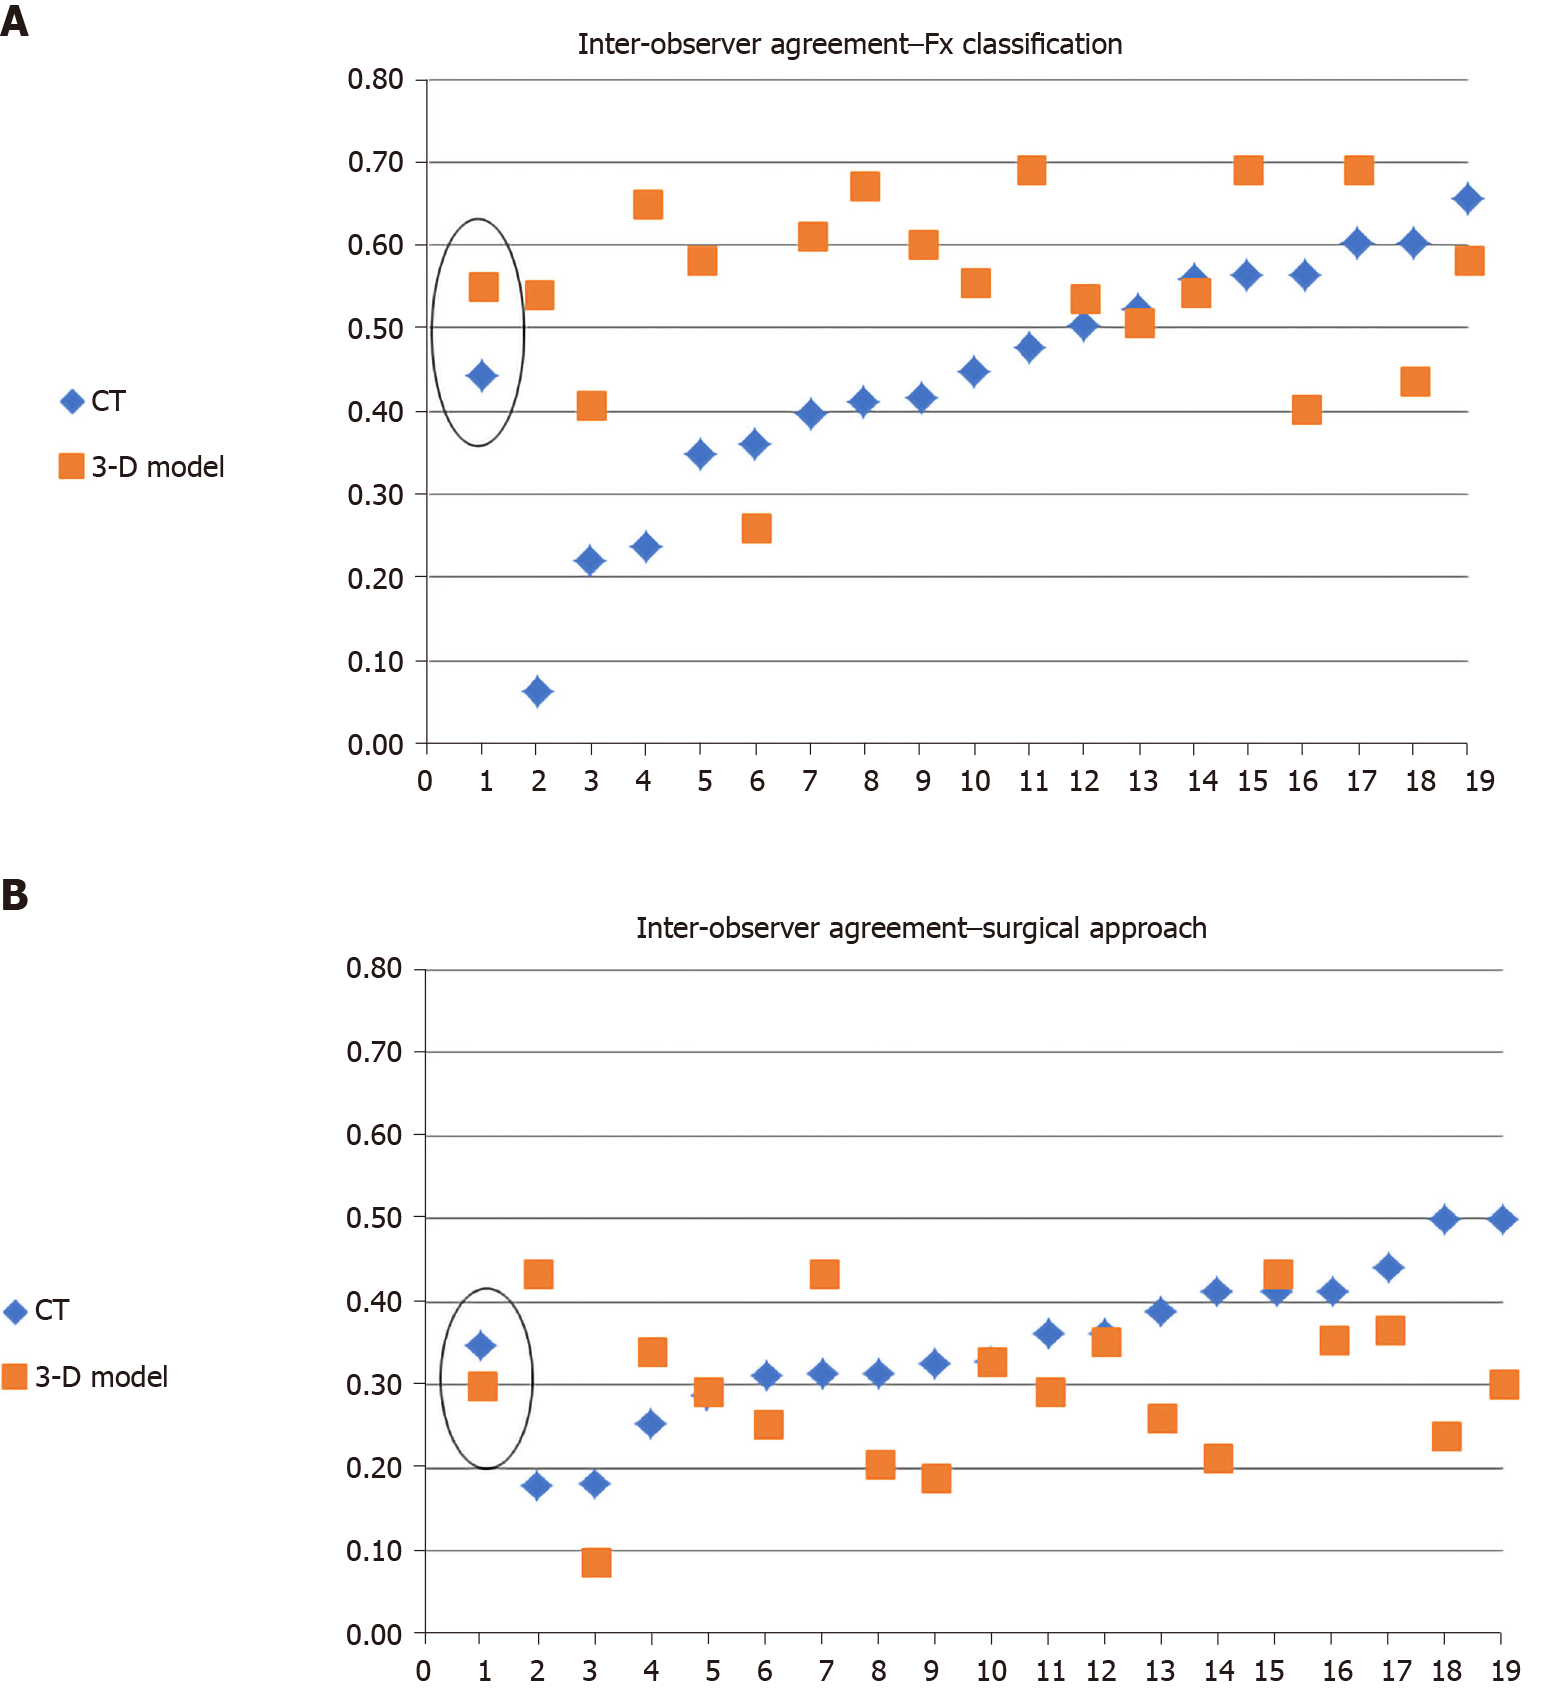
Figure 4 Mean Kappa rate describing agreement between reviewers regarding the fracture classification and preferred surgical approach using computed tomography and 3-dimensional printed models (mean kappa in circle).
A: The fracture classification; B: The preferred surgical approach. CT: Computed tomography; 3-D: Three-dimensional; Fx: Fracture.
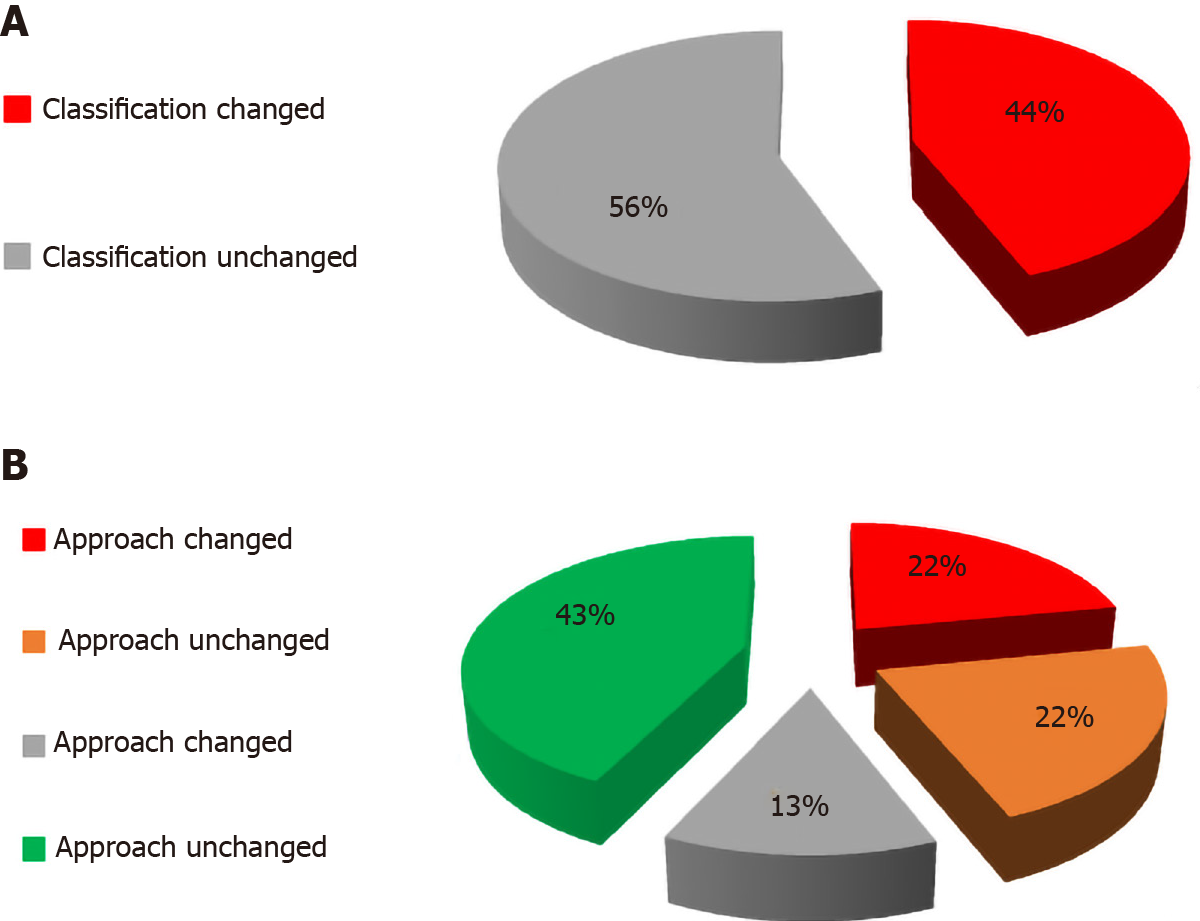
Figure 5 Decision change regarding the surgical approach.
A: The effect of reviewing the 3-dimensional model; B: Division of the subgroups demonstrates a change in surgical approach in double rates when the classification is also changed.
- Citation: Keltz E, Keshet D, Peled E, Zvi Y, Norman D, Keren Y. Interobserver and intraobserver agreement for Letournel acetabular fracture classification system using 3-dimensional printed solid models. World J Orthop 2021; 12(2): 82-93
- URL: https://www.wjgnet.com/2218-5836/full/v12/i2/82.htm
- DOI: https://dx.doi.org/10.5312/wjo.v12.i2.82


