Copyright
©The Author(s) 2021.
World J Orthop. Dec 18, 2021; 12(12): 961-969
Published online Dec 18, 2021. doi: 10.5312/wjo.v12.i12.961
Published online Dec 18, 2021. doi: 10.5312/wjo.v12.i12.961
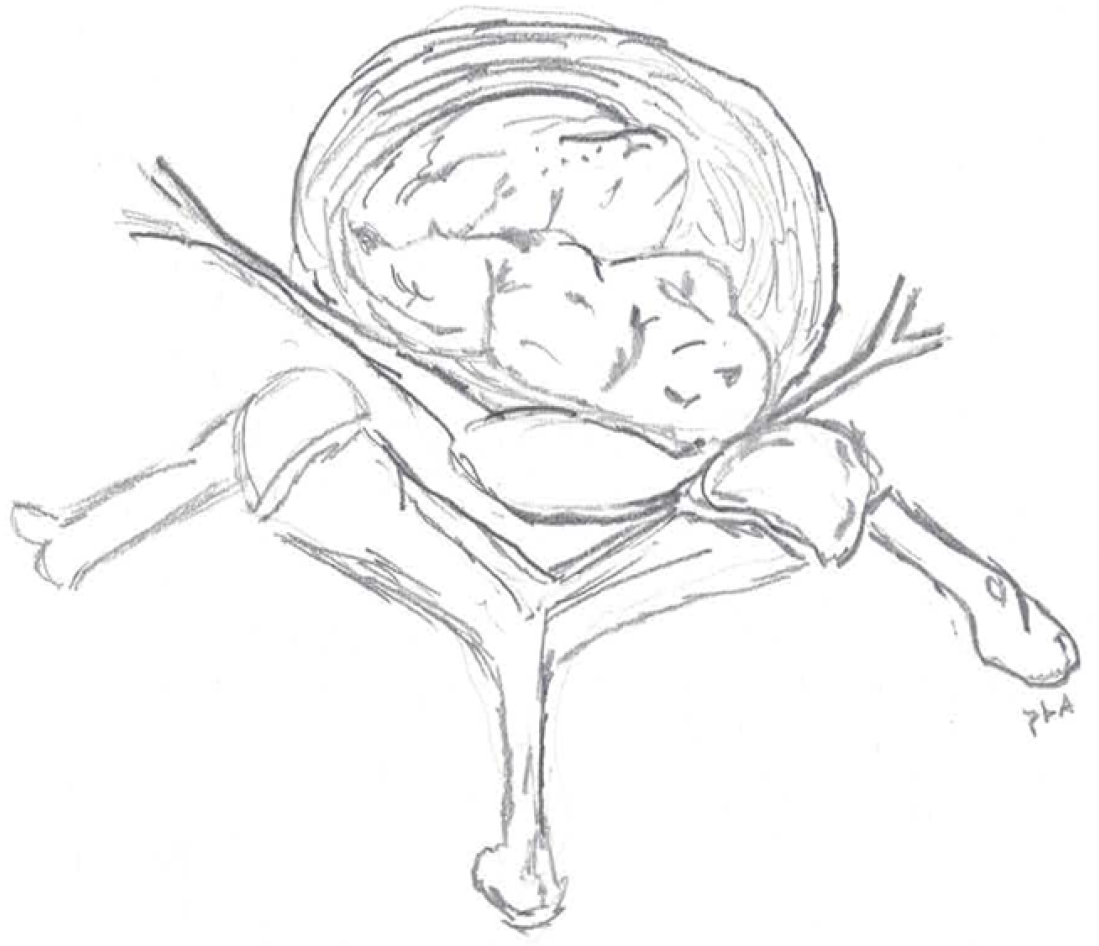
Figure 1 Artist illustration: Intraforaminal herniation compressing the nerve root and ganglion.
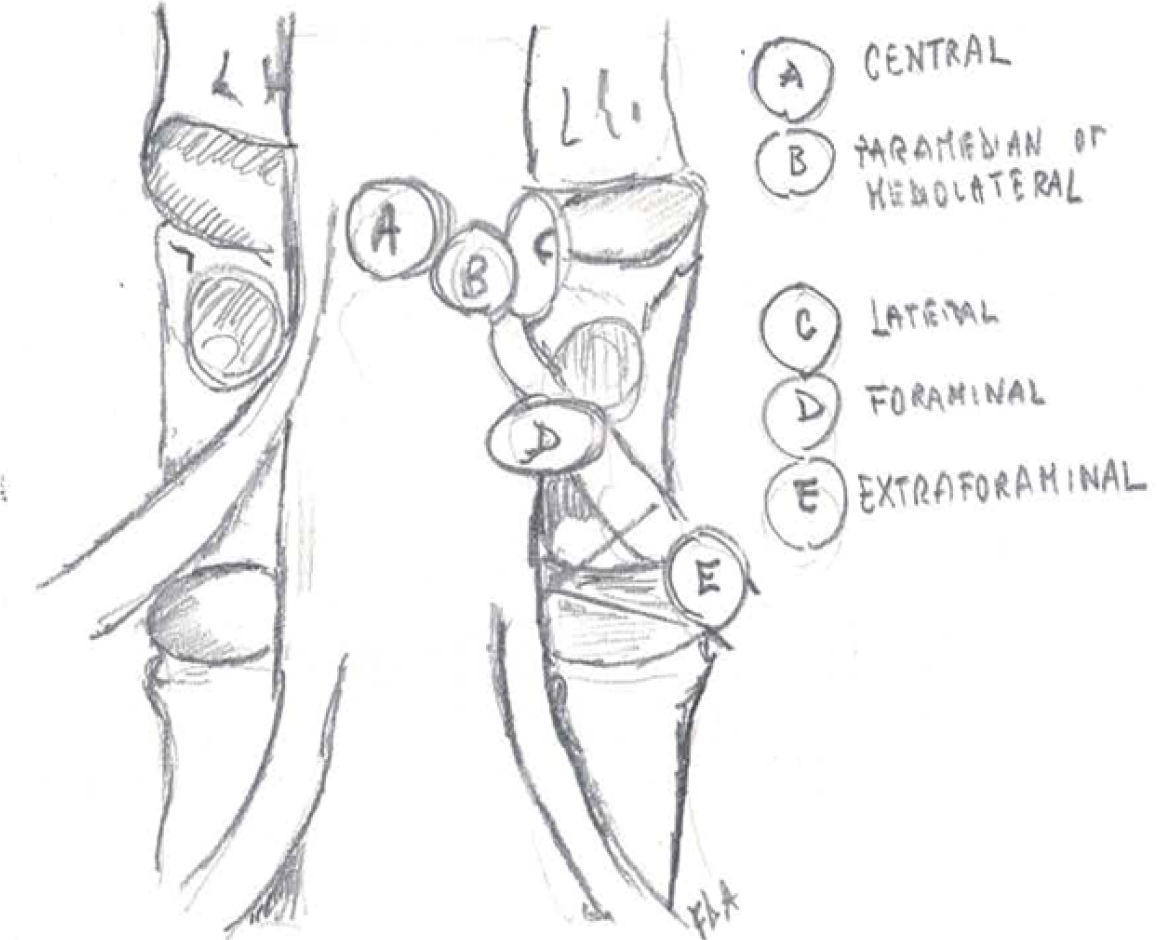
Figure 2 Schematic drawing, coronal view: Relationship between dural sac and nerve roots of disc herniations in different locations.
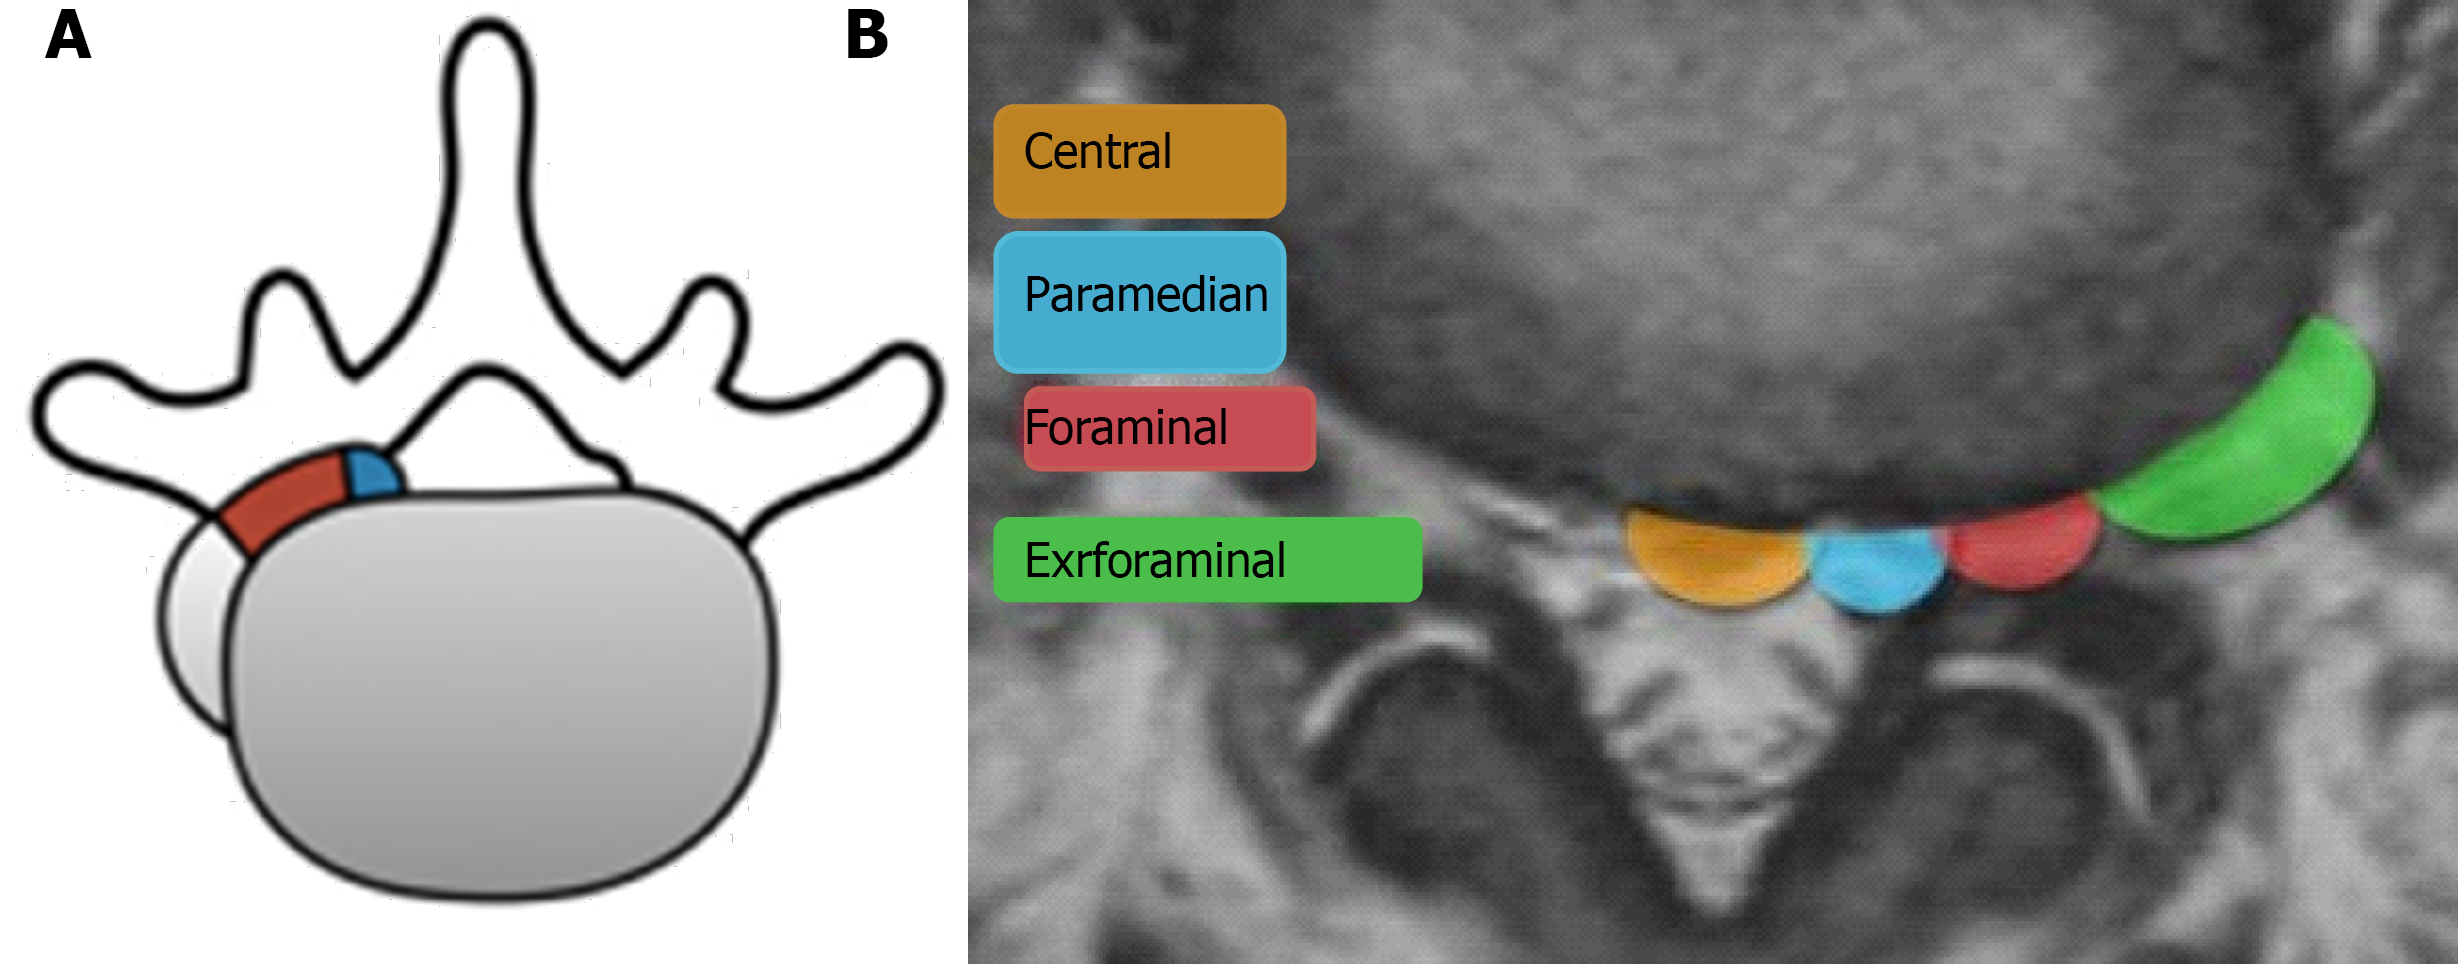
Figure 3 Schematic axial view.
A: Schematic drawing, axial view: Relationship between dural sac and nerve roots of disc herniations in different locations. Blue: preforaminal. Red: intraforaminal. Grey: extraforaminal. The herniation can be combined (e.g. intra/extraformainal, pre/intraforaminal) (adapted from Lofrese); B: Magnetic resonance imaging schematic axial view.
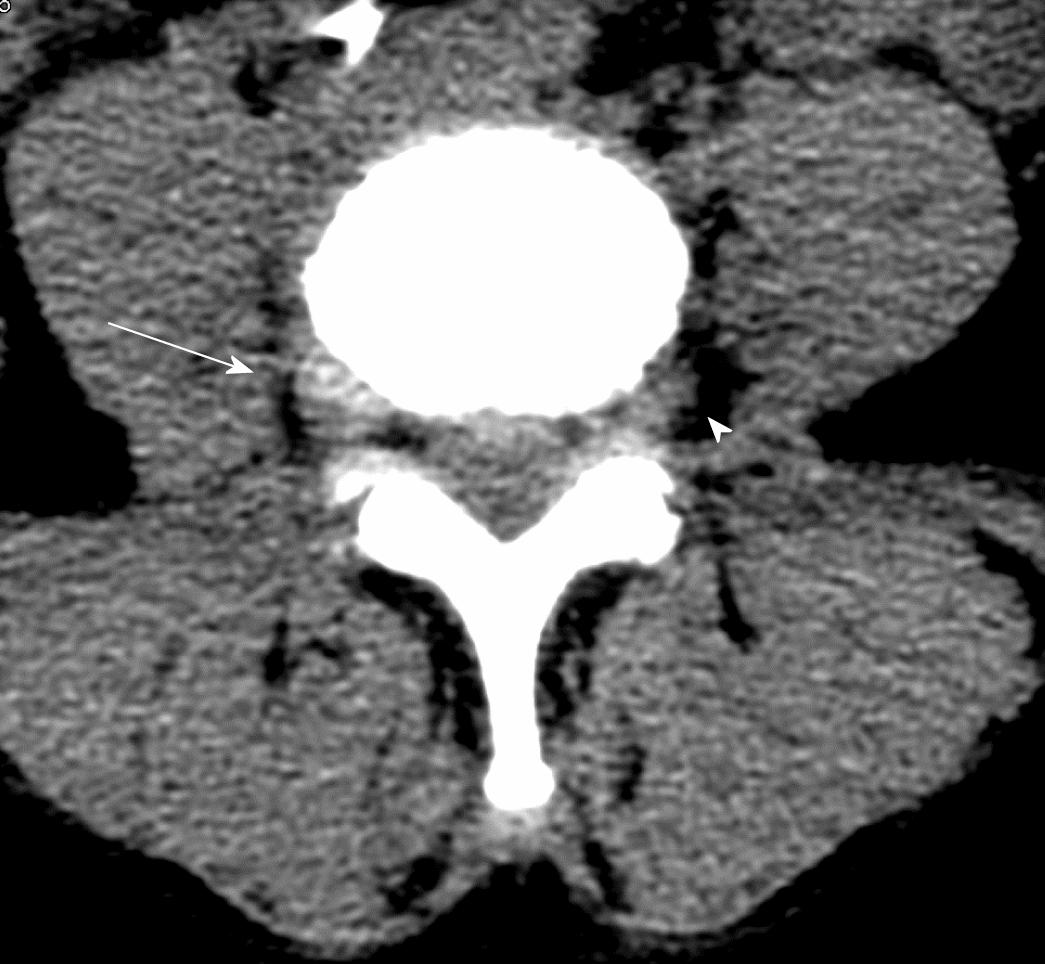
Figure 4 Computed tomography: Right intra-extraforaminal disc herniation, partially calcified (arrow).
The normal course of the contralateral root is shown by arrowhead.
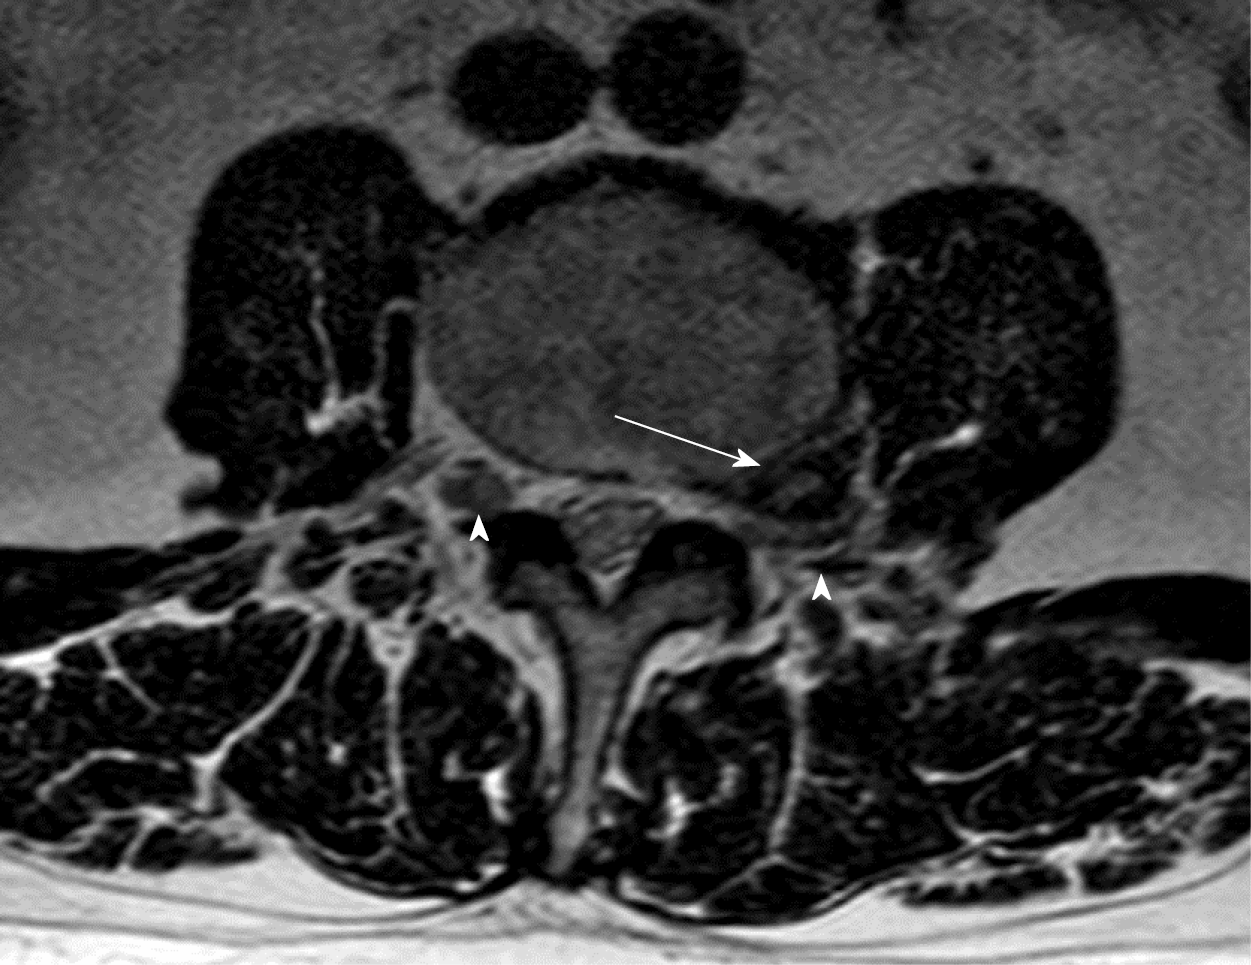
Figure 5 Magnetic resonance (T2 axial sequence): Left extraforaminal disc herniation (arrow).
Nerve roots are clearly depicted (arrowheads), the left one being thinned, kinked and dislocated postero-superiorly by the herniation.
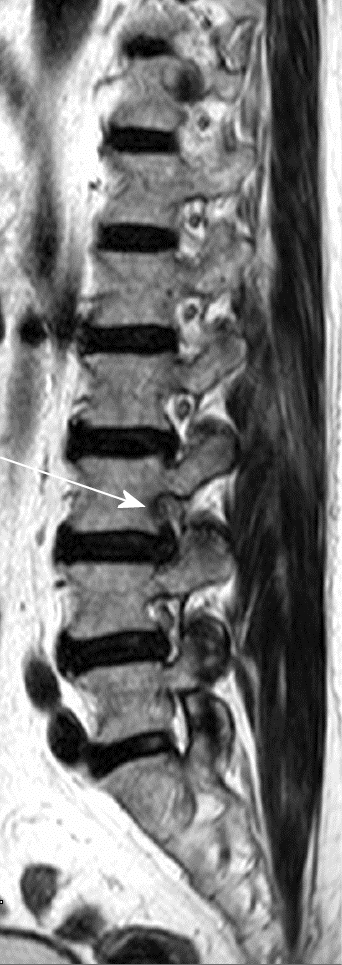
Figure 6 Magnetic resonance (T1 sagittal sequence): L3-L4 intraforaminal herniation compressing the L3 root.
Perineural fat obliteration is evident.
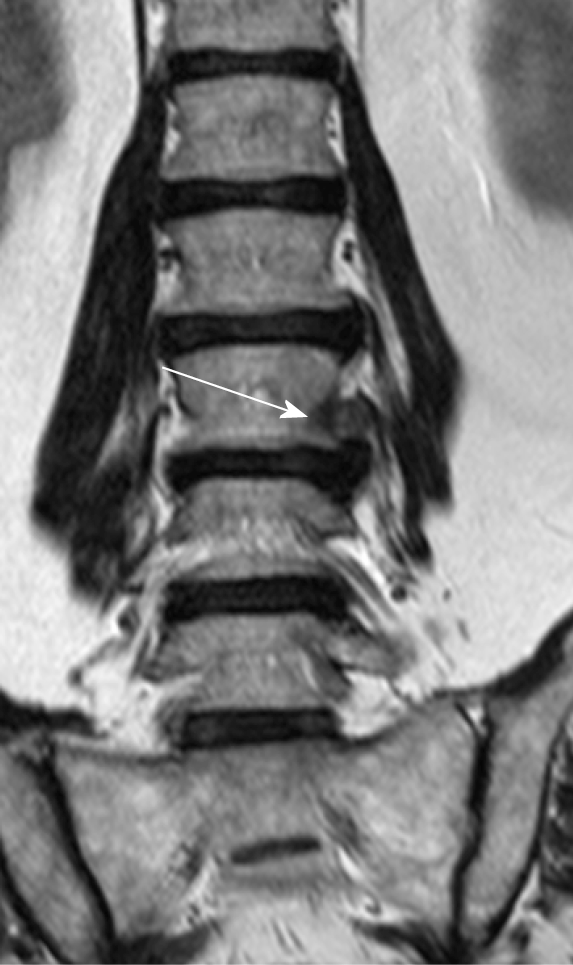
Figure 7 Magnetic resonance (T1 paracoronal sequence): Left L3-L4 extraforaminal herniation.
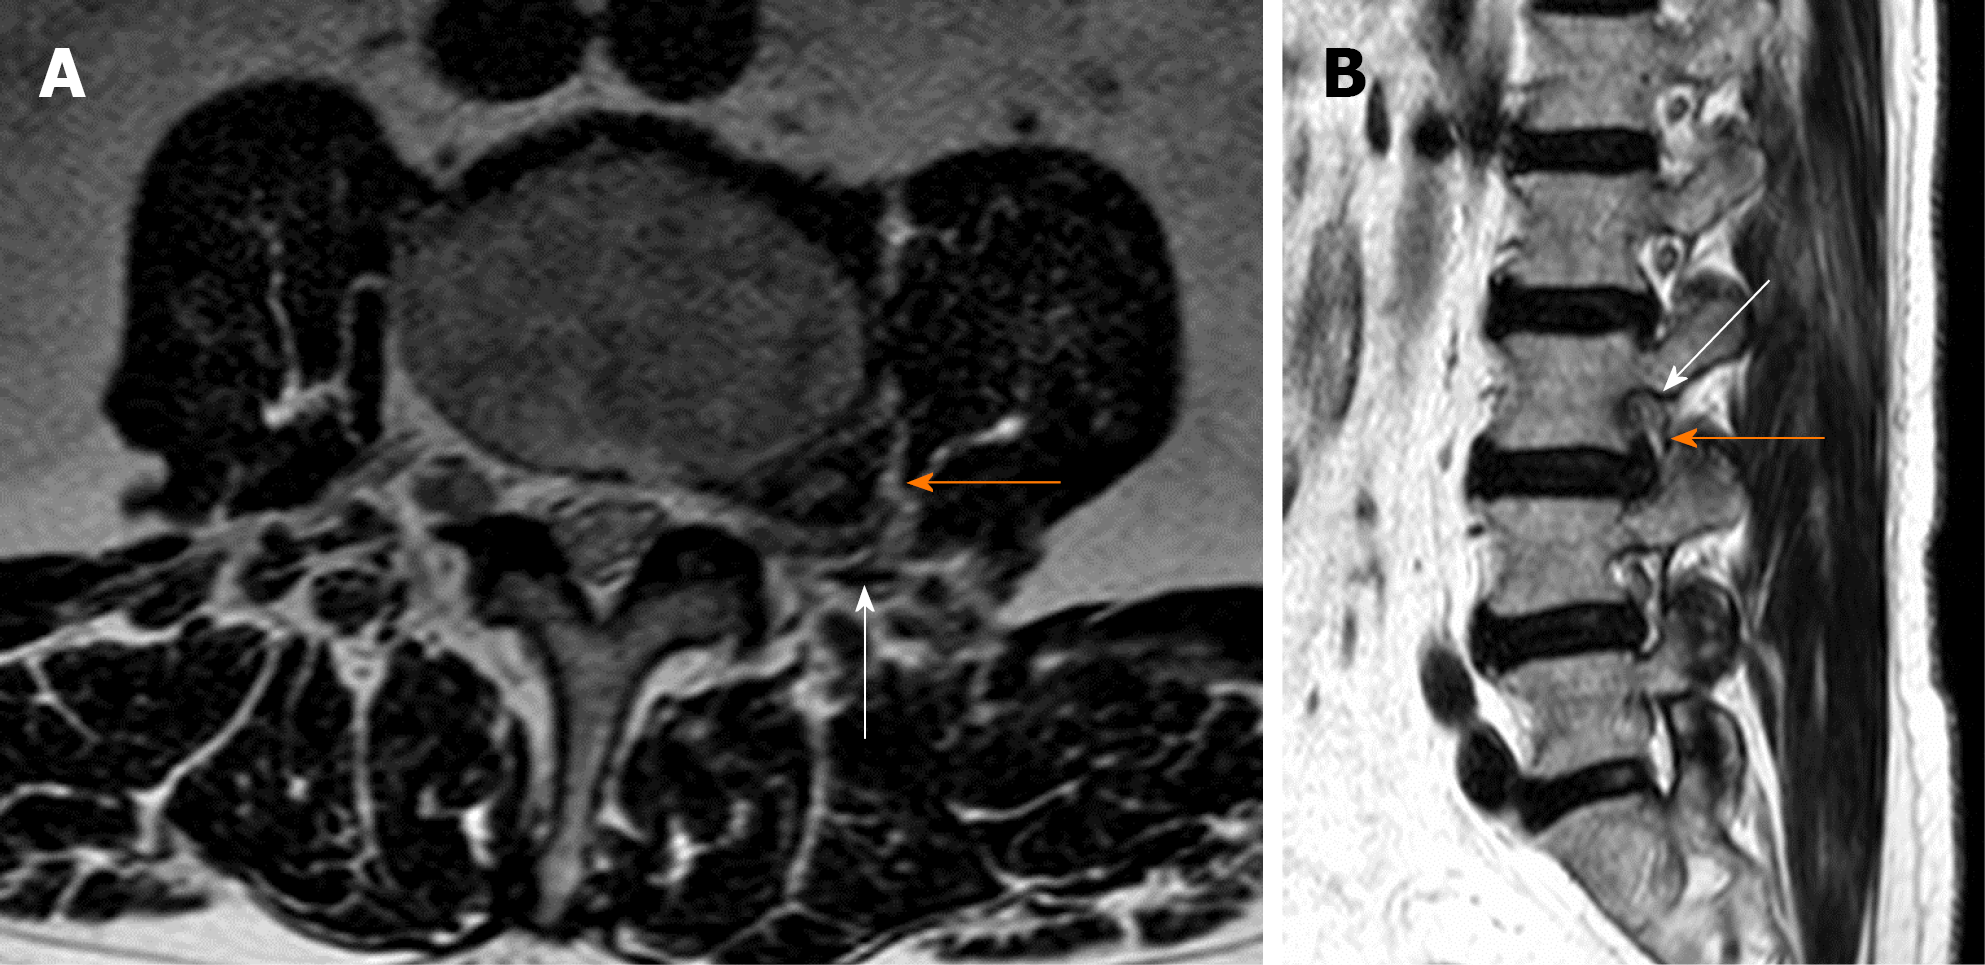
Figure 8 Axial (A) and sagittal (B) T2 magnetic resonance imaging showing a left L3-L4 extraforaminal far lateral lumbar disc herniations (orange arrow).
The L3 root is severely compressed against the posterior border of the neural foramen (white arrow).
- Citation: Berra LV, Di Rita A, Longhitano F, Mailland E, Reganati P, Frati A, Santoro A. Far lateral lumbar disc herniation part 1: Imaging, neurophysiology and clinical features. World J Orthop 2021; 12(12): 961-969
- URL: https://www.wjgnet.com/2218-5836/full/v12/i12/961.htm
- DOI: https://dx.doi.org/10.5312/wjo.v12.i12.961


