Copyright
©The Author(s) 2020.
World J Orthop. Oct 18, 2020; 11(10): 453-464
Published online Oct 18, 2020. doi: 10.5312/wjo.v11.i10.453
Published online Oct 18, 2020. doi: 10.5312/wjo.v11.i10.453
Figure 1 Regional left knee scan for case using GE software (Encore v.
16). A: Initially detected knee (un-brushed) with many un-assigned bone pixels; B: Corrected (brushed) image of the knee scan with four regions of interest. DFM: Distal femur metaphysis; DFE: Distal femur epiphysis; PTE: Proximal tibia epiphysis; PTM: Proximal tibia metaphysis.
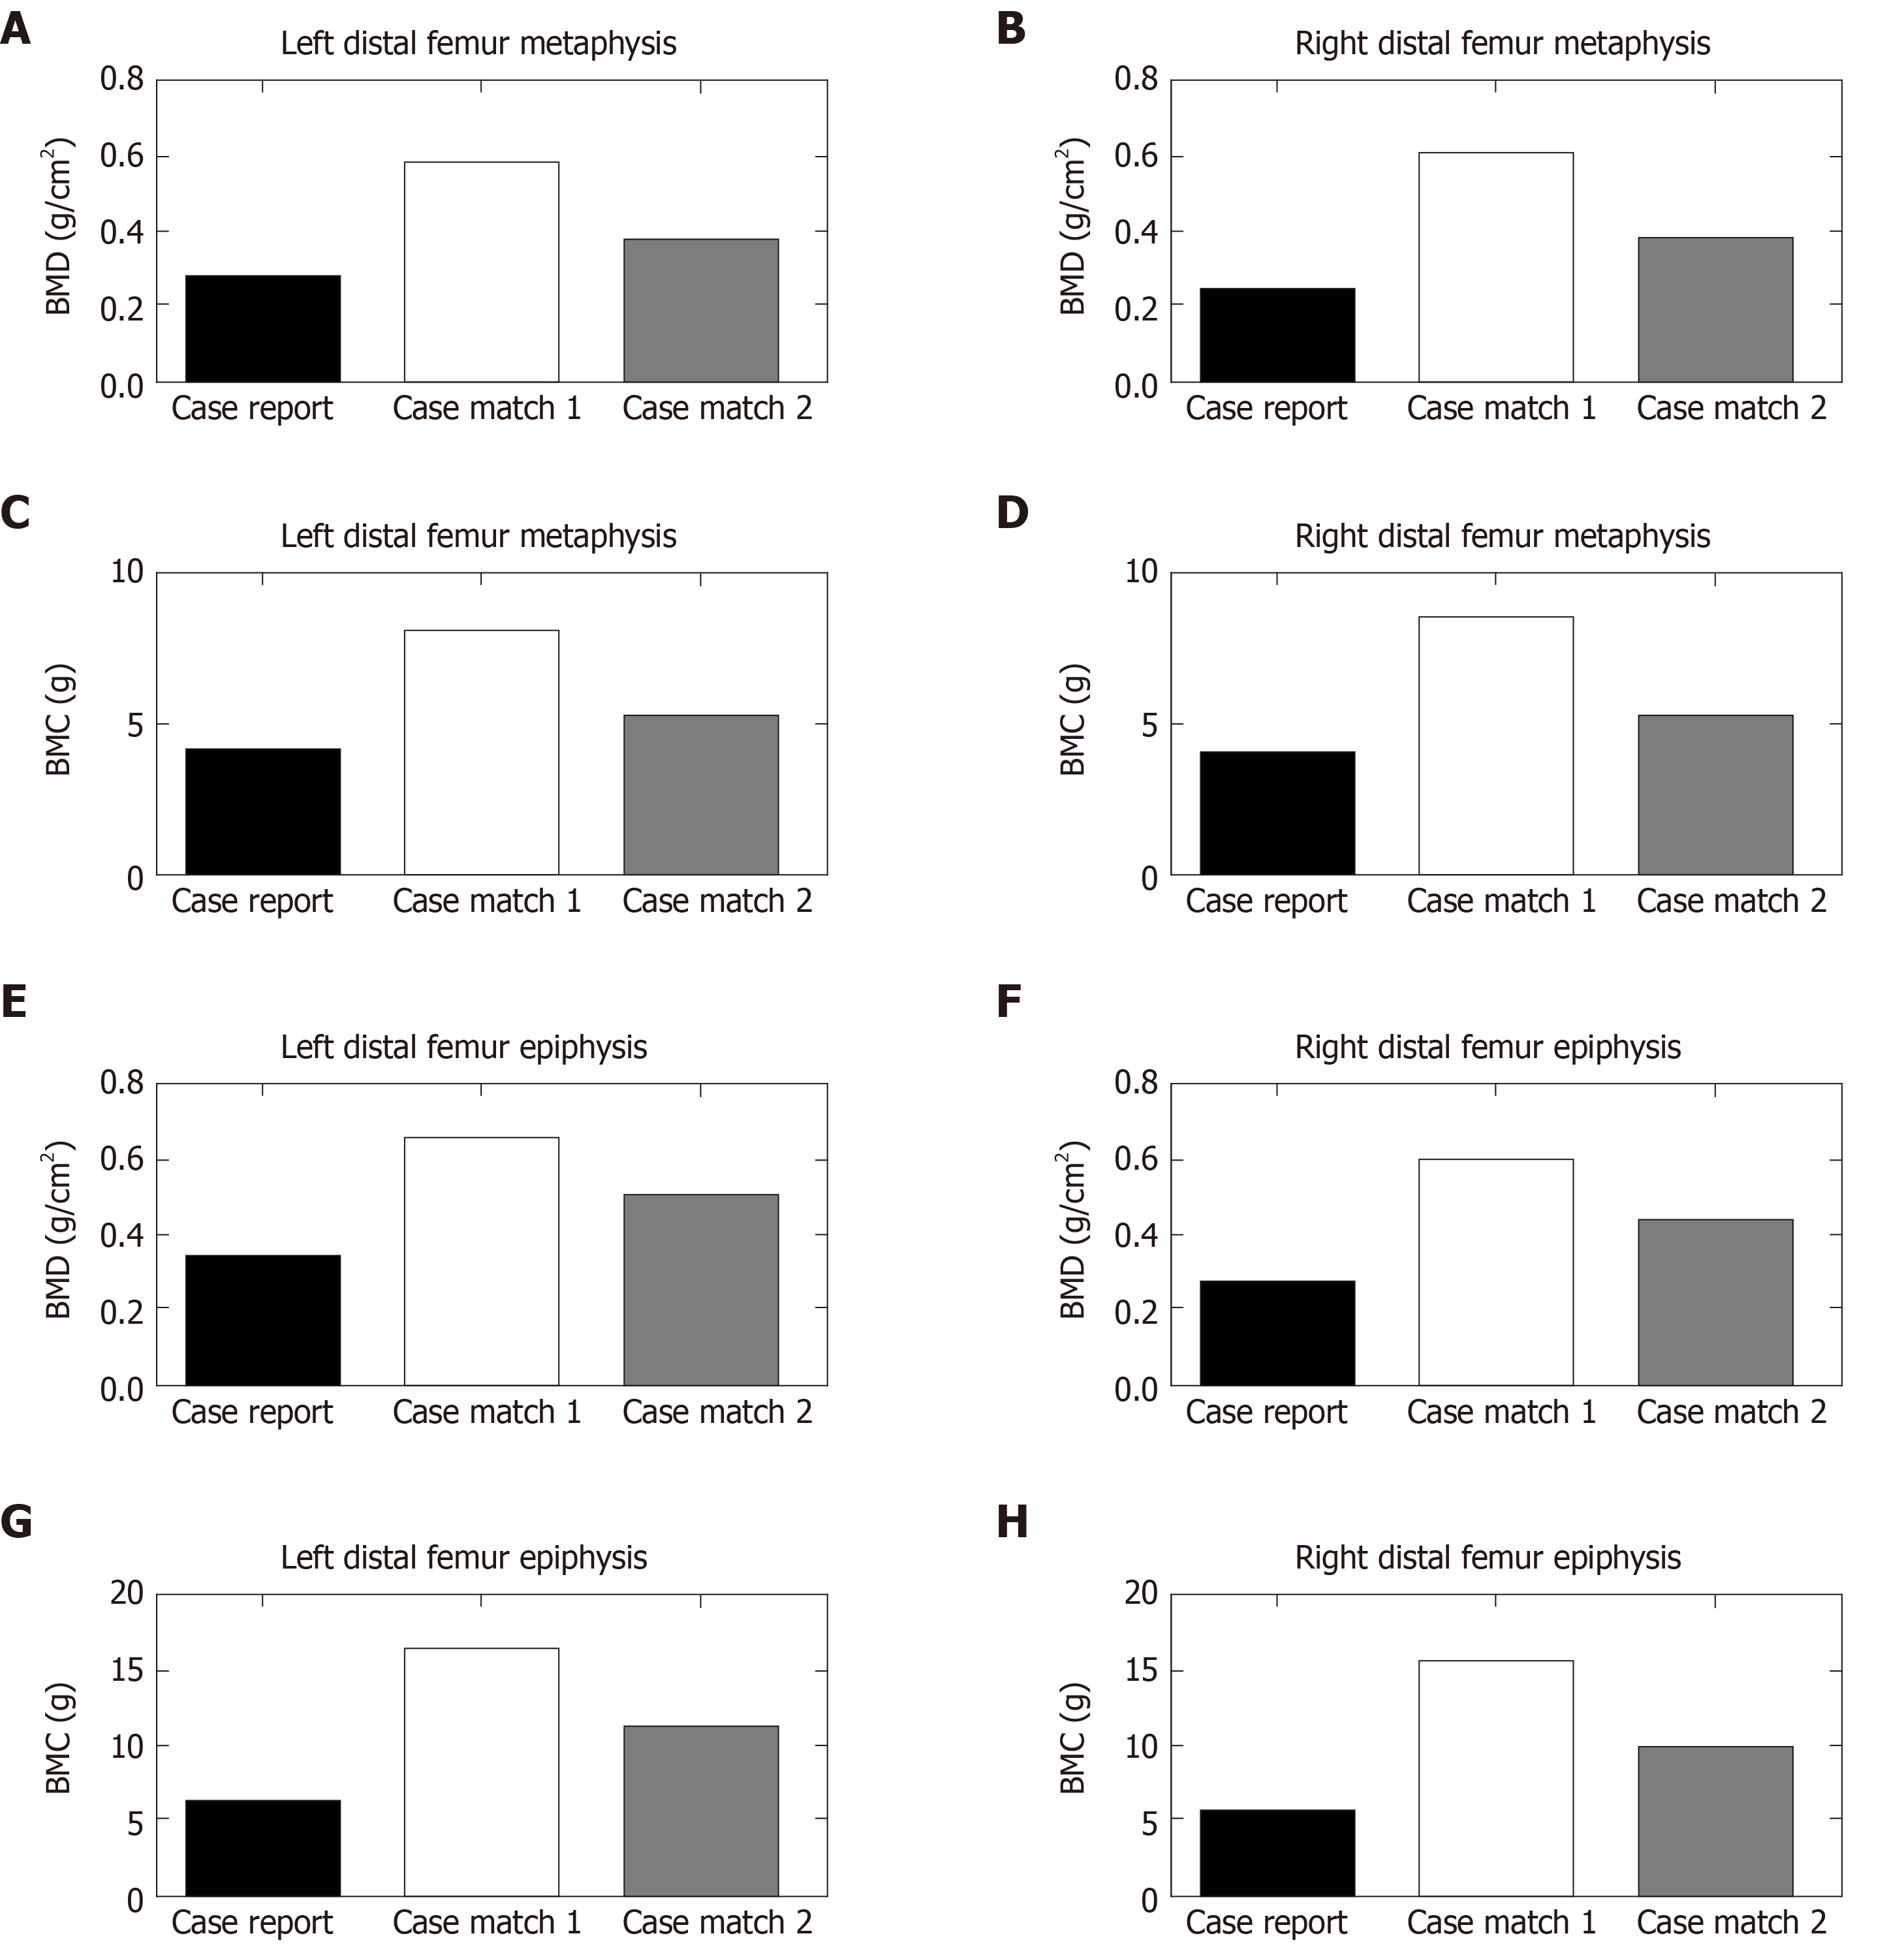
Figure 2 Bar plots for bone mineral density (g/cm2) and bone mineral content (g) values of distal femur for the case and matched participants.
A: Left distal femur metaphysis [Bone mineral density (BMD)]; B: Right distal femur metaphysis (BMD); C: Left distal femur metaphysis [Bone mineral content (BMC)]; D: Right distal femur metaphysis (BMC); E: Left distal femur epiphysis (BMD); F: Right distal femur epiphysis (BMD); G: Left distal femur epiphysis (BMC); H: Right distal femur epiphysis (BMC). BMC: Bone mineral content; BMD: Bone mineral density.
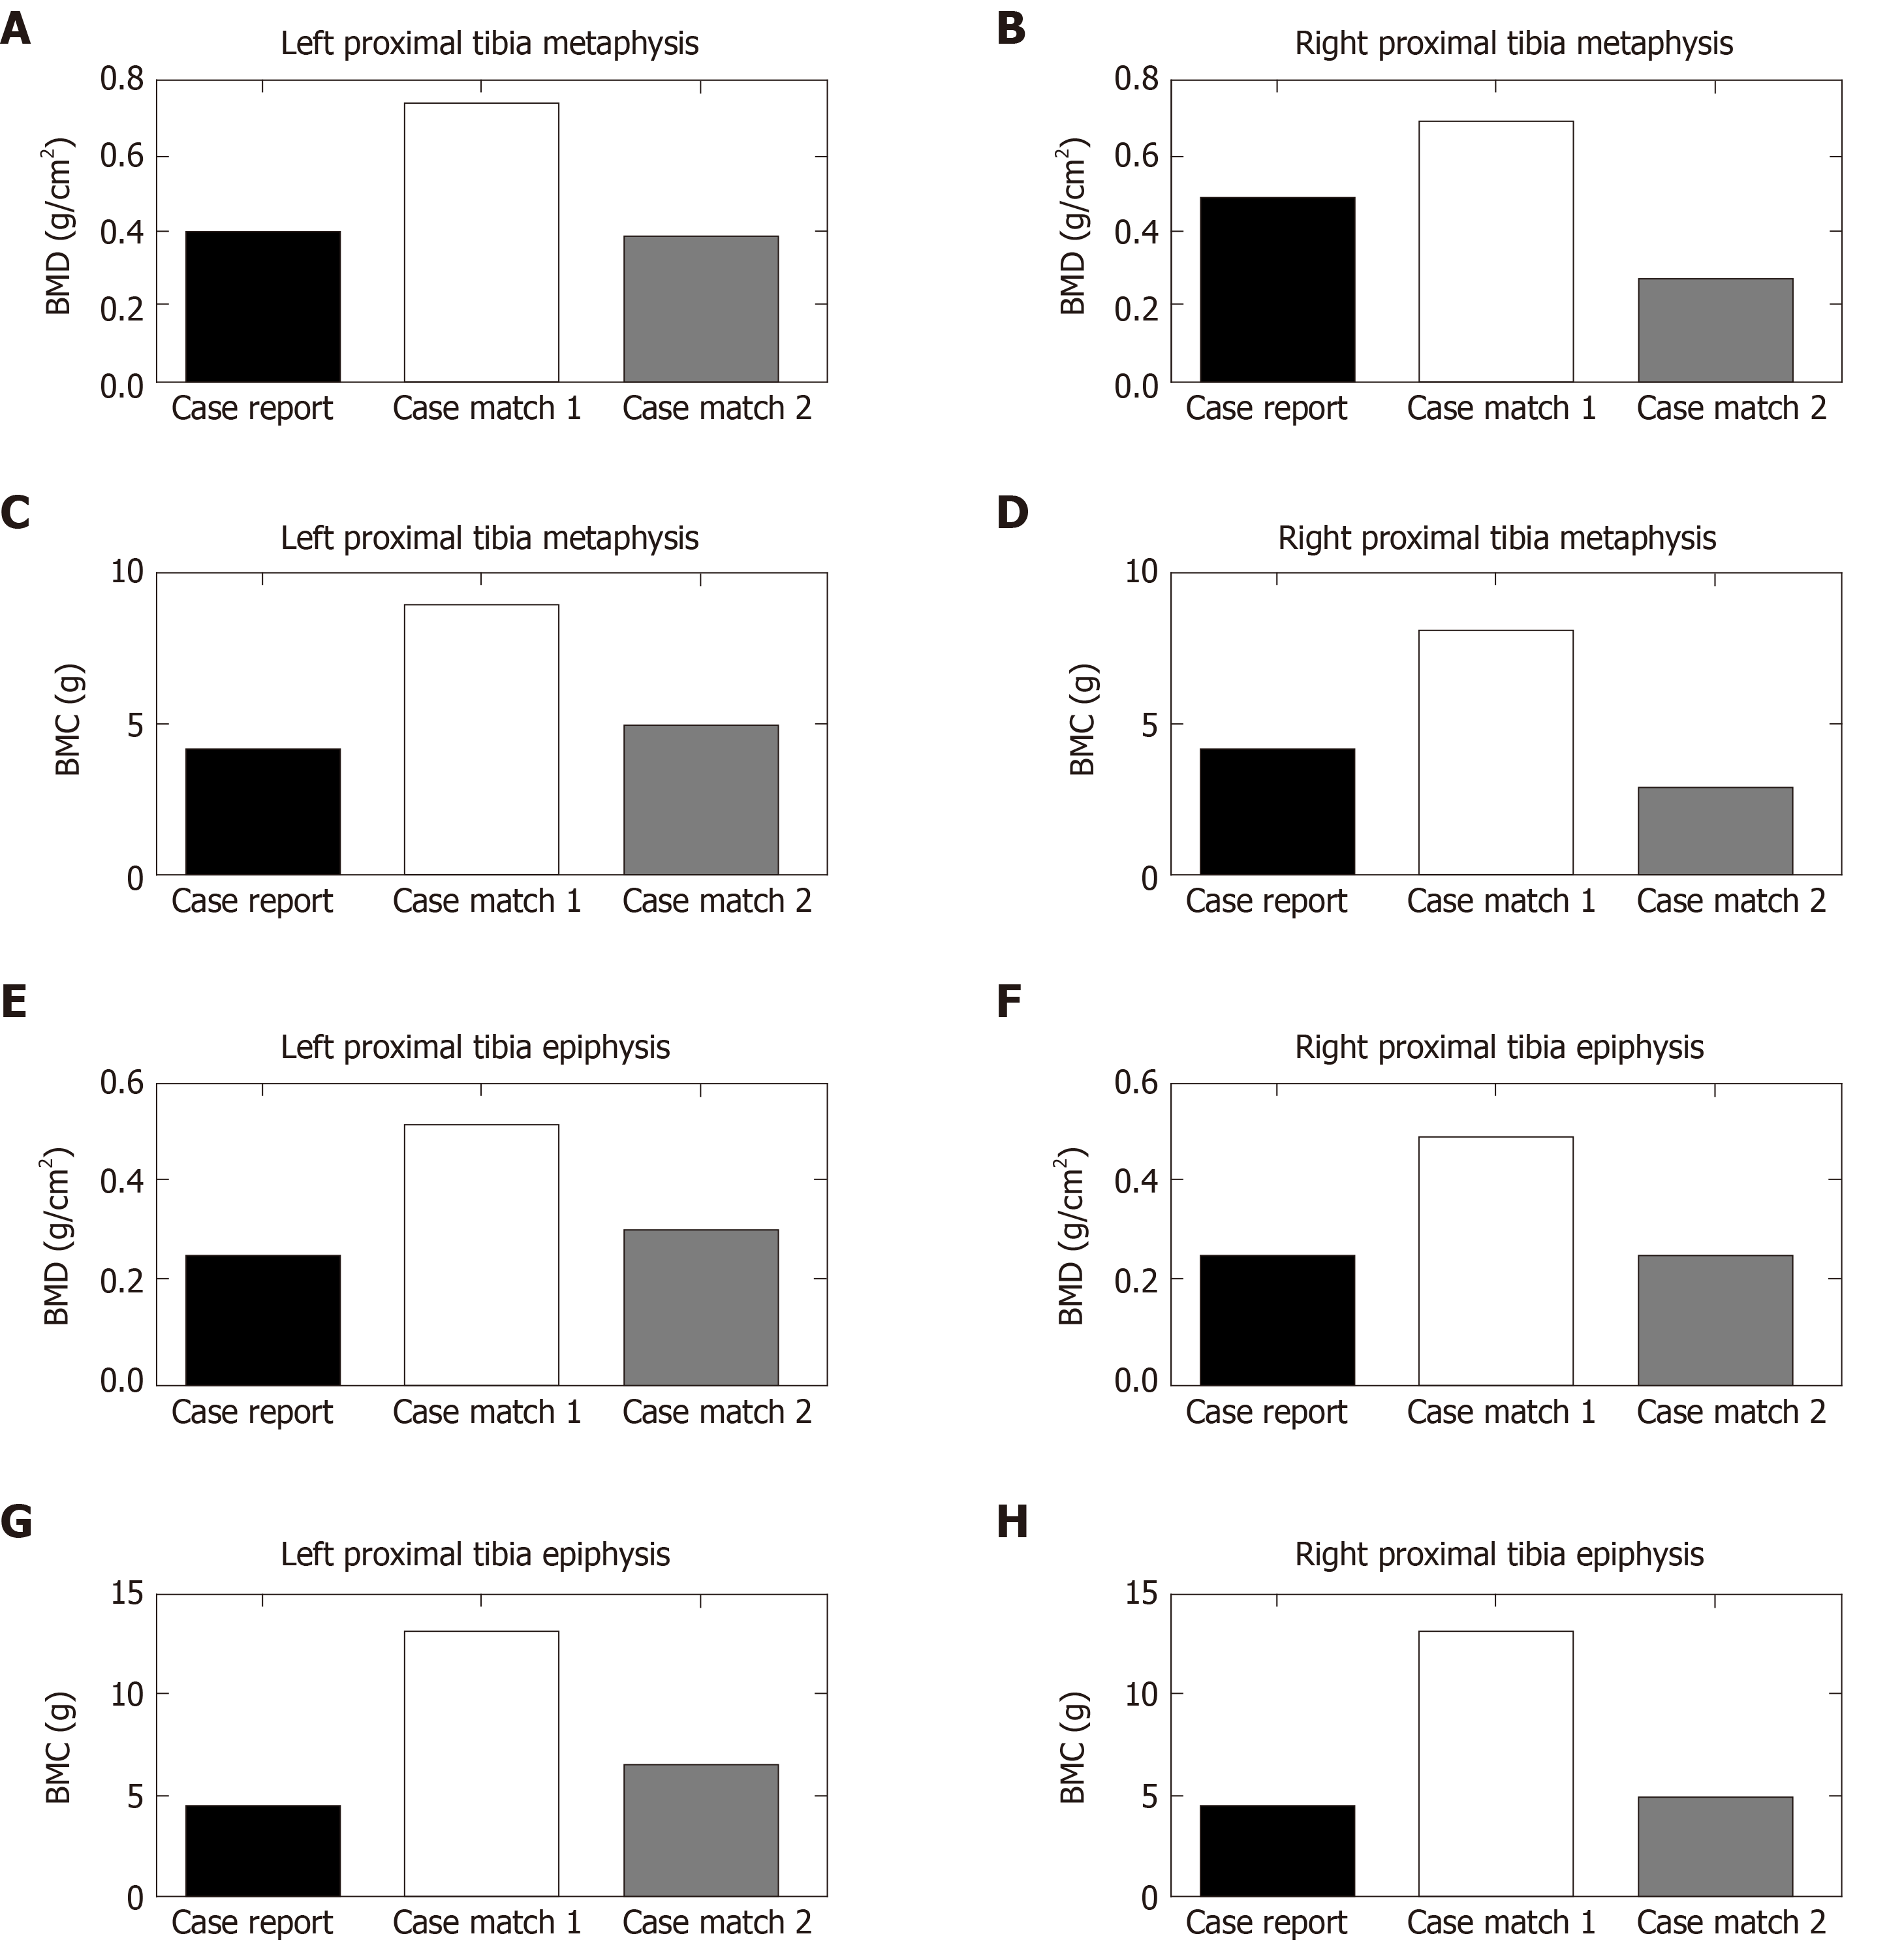
Figure 3 Bar plots for bone mineral density (g/cm2) and bone mineral content (g) values of proximal tibia for the case and matched participants.
A: Left proximal tibia metaphysis [Bone mineral density (BMD)]; B: Right proximal tibia metaphysis (BMD); C: Left proximal tibia metaphysis [Bone mineral content (BMC)]; D: Right proximal tibia metaphysis (BMC); E: Left proximal tibia epiphysis (BMD); F: Right proximal tibia epiphysis (BMD); G: Left proximal tibia epiphysis (BMC); H: Right proximal tibia epiphysis (BMC). BMC: Bone mineral content; BMD: Bone mineral density.
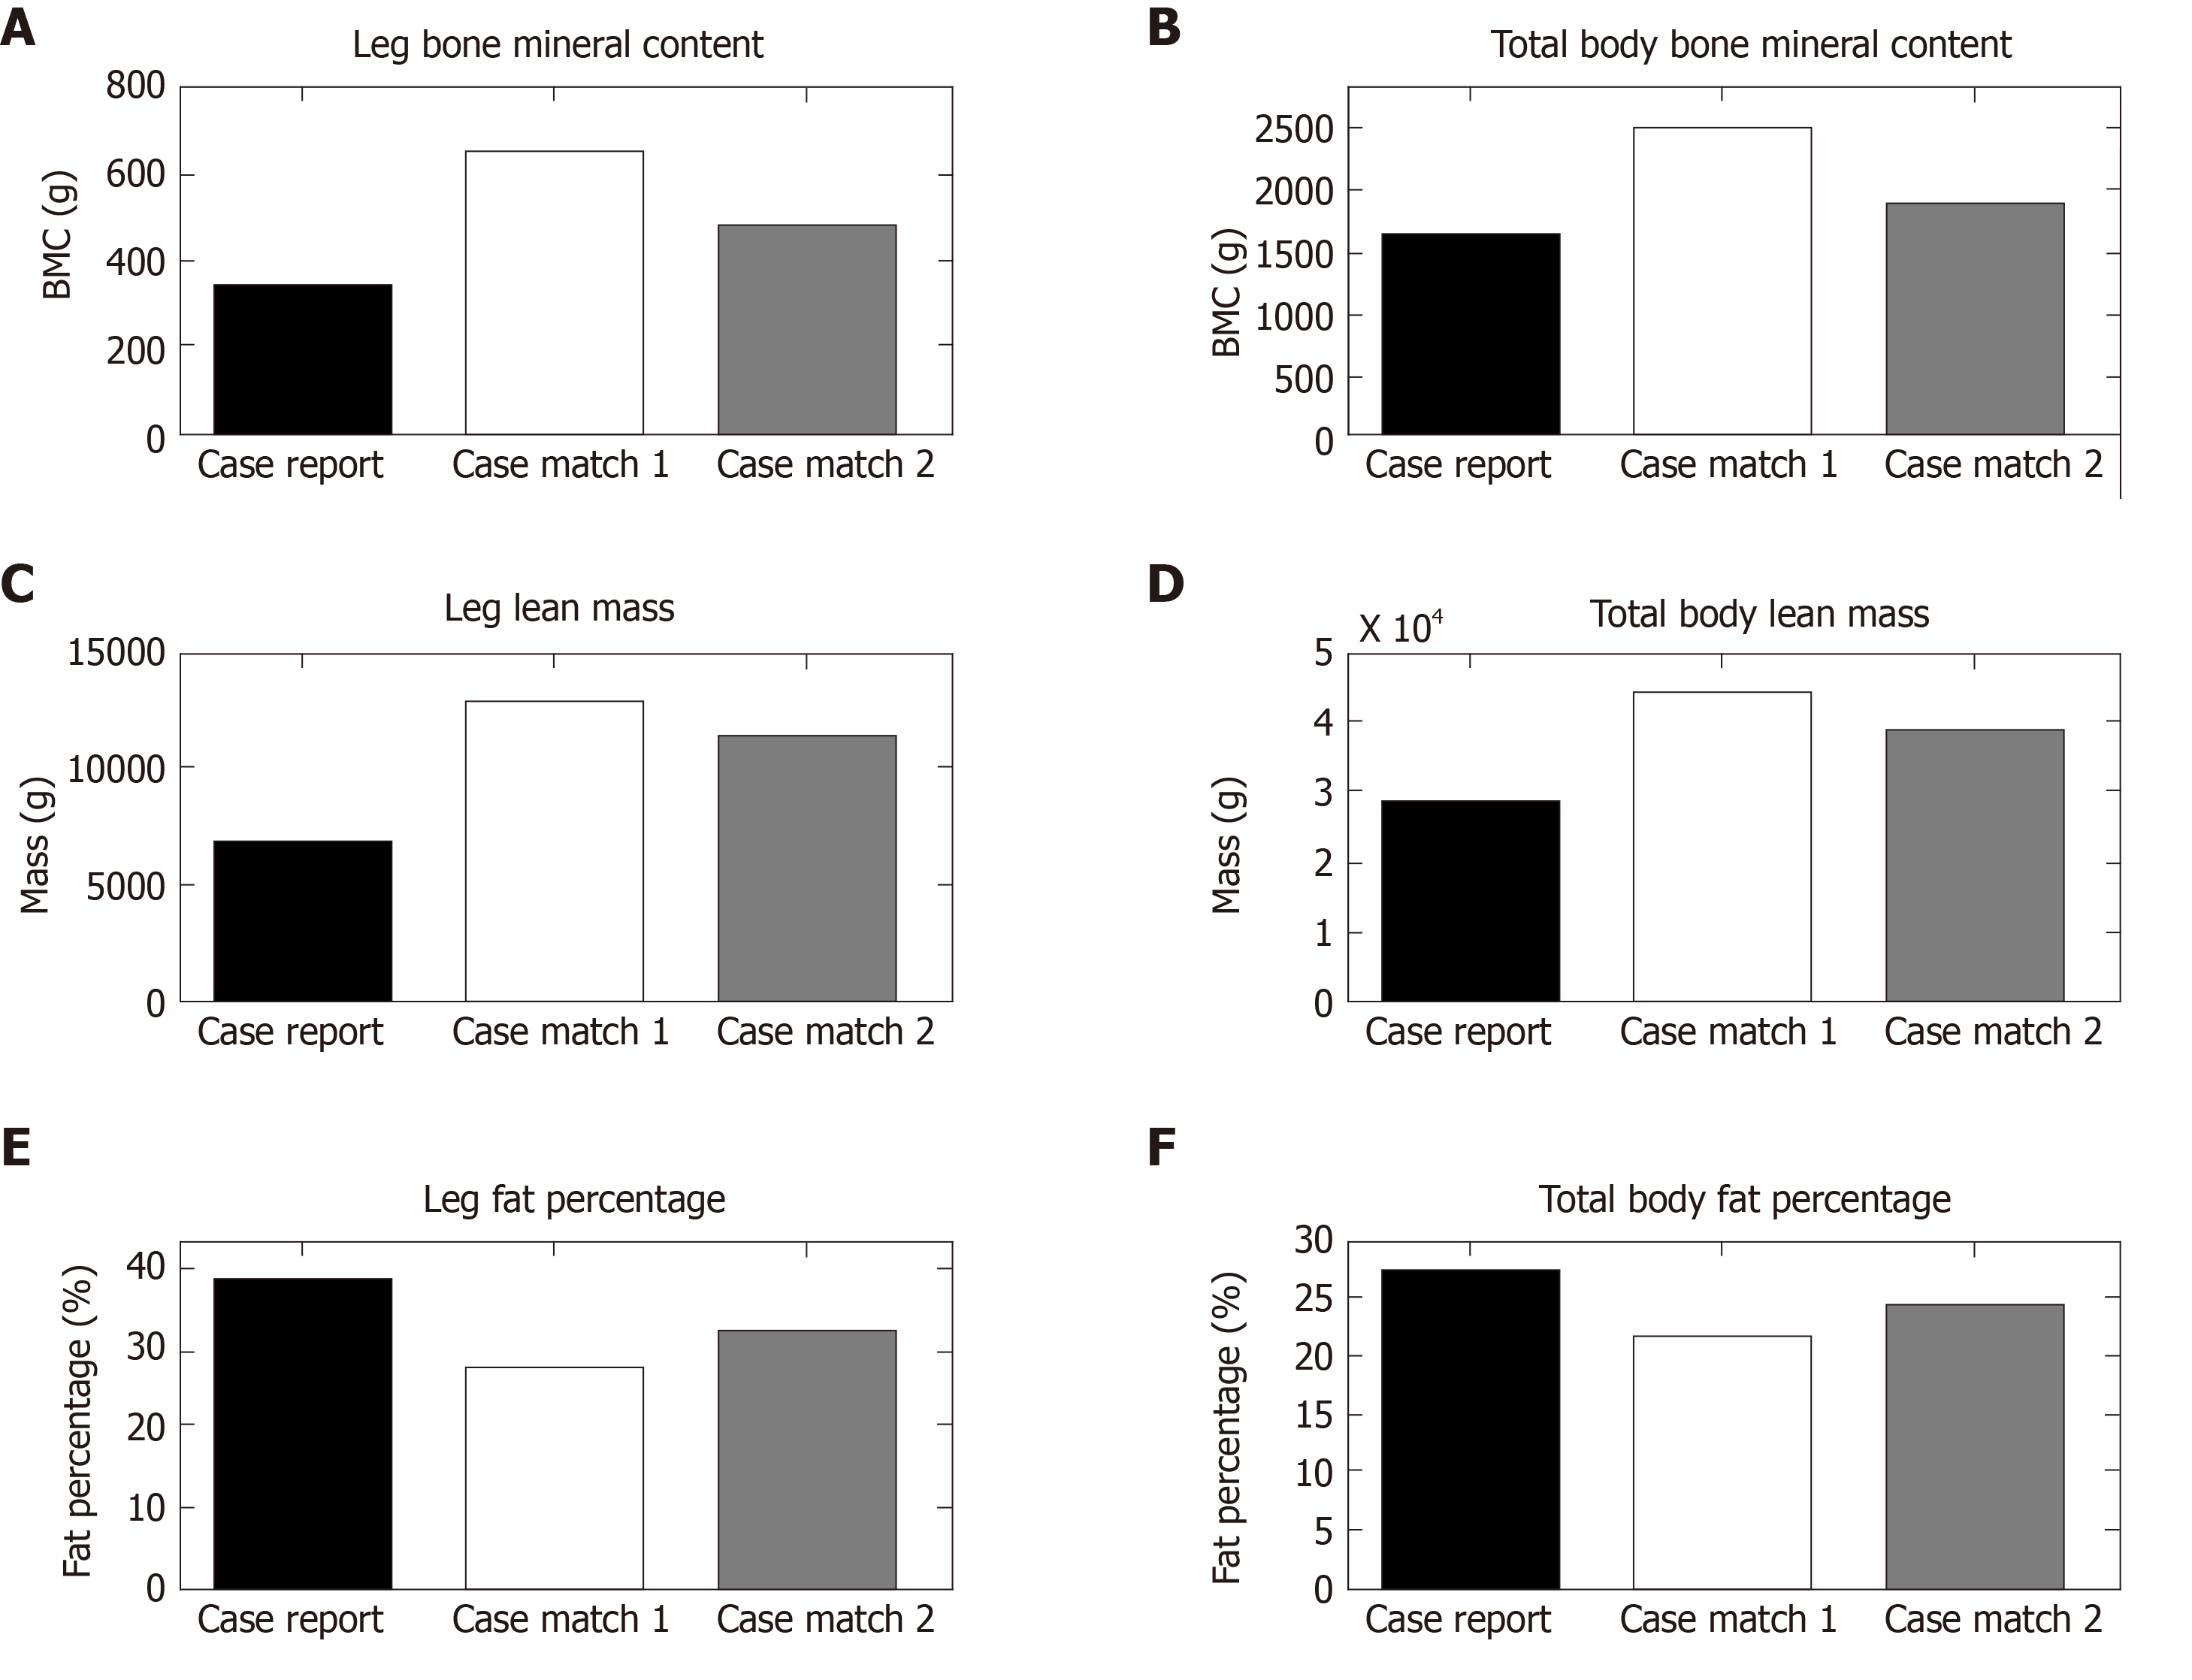
Figure 4 Bar plot for total body and leg composition for the case and matched participants.
A: Leg bone mineral content (BMC) (g); B: Total body BMC (g); C: Leg lean mass (g); D: Total body lean mass (g); E: Percentage leg fat mass; F: Percentage total body fat mass.
- Citation: Ifon DE, Ghatas MP, Davis JC, Khalil RE, Adler RA, Gorgey AS. Long-term effect of intrathecal baclofen treatment on bone health and body composition after spinal cord injury: A case matched report. World J Orthop 2020; 11(10): 453-464
- URL: https://www.wjgnet.com/2218-5836/full/v11/i10/453.htm
- DOI: https://dx.doi.org/10.5312/wjo.v11.i10.453


