
















Copyright: ©Author(s) 2026.
World J Clin Oncol. Sep 24, 2026; 17(9): 125511
Published online Sep 24, 2026. doi: 10.5306/wjco.125511
Published online Sep 24, 2026. doi: 10.5306/wjco.125511
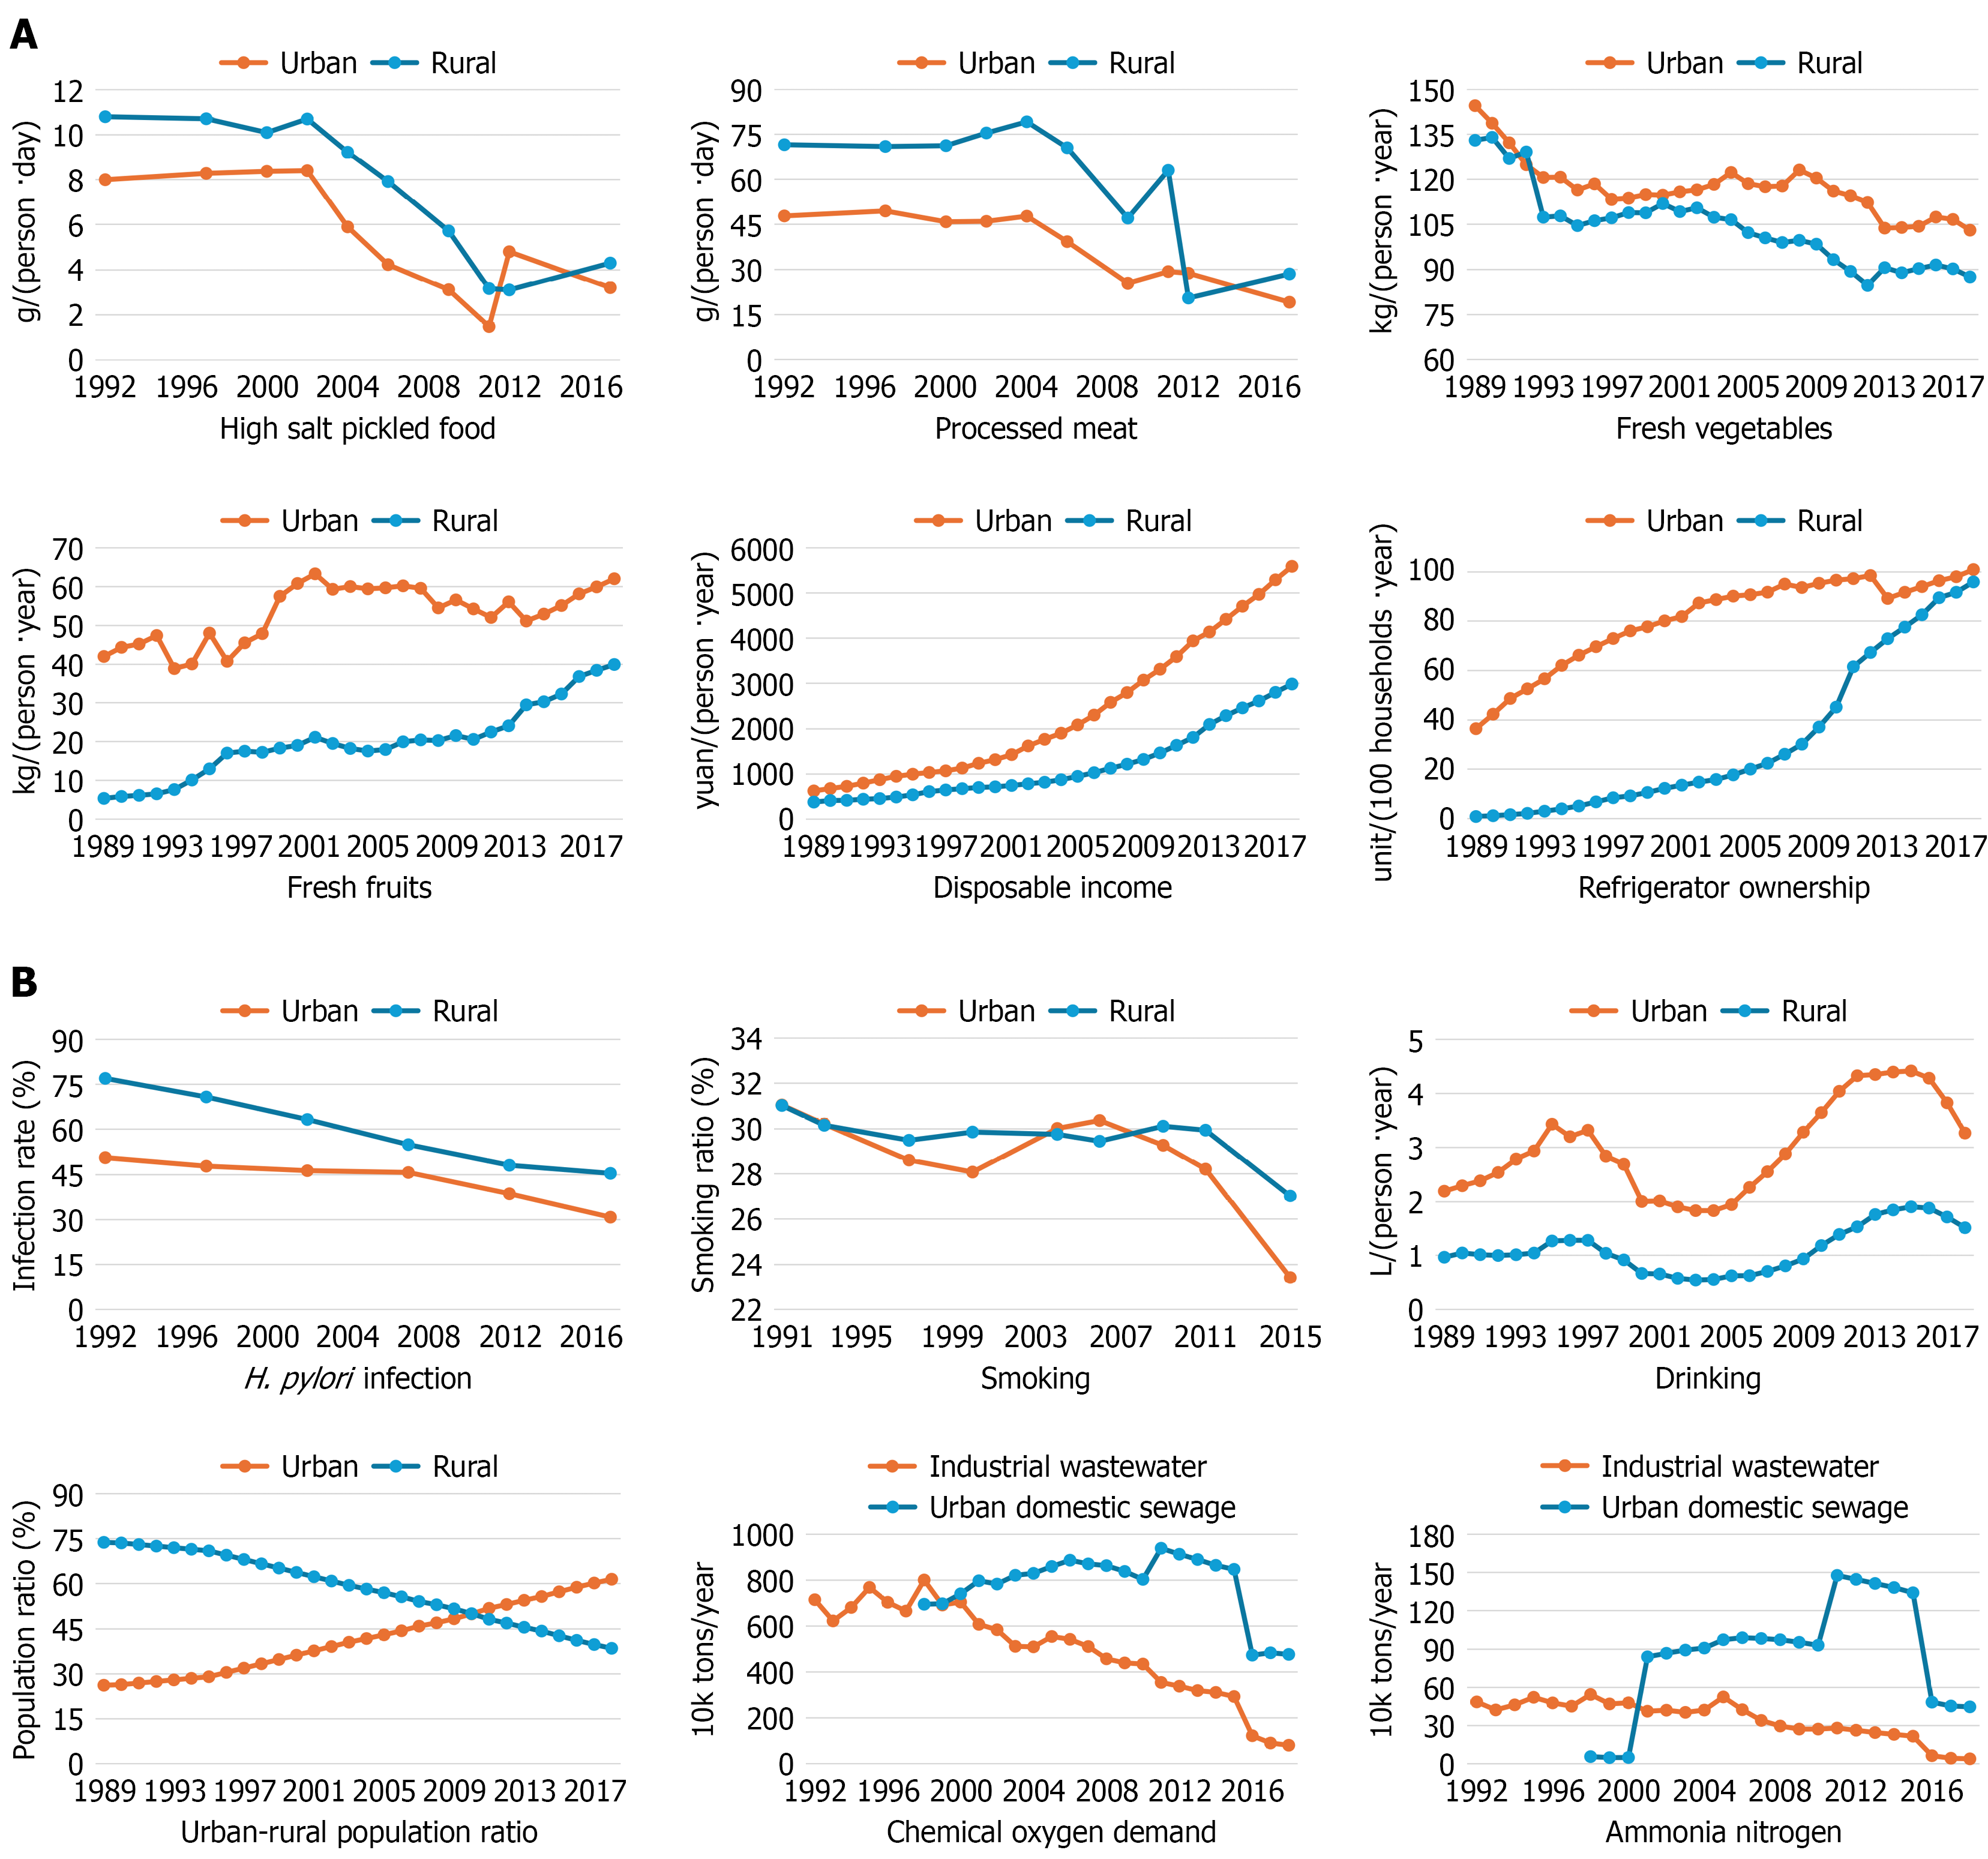
Figure 1 Trends in potential influencing factors of gastric cancer in China from 1989 to 2018.
A: Socioeconomic and dietary factors. High-salt pickled food[50]; processed meat[50]; annual per capita consumption of fresh vegetables[27]; annual per capita consumption of fresh fruits[27]; annual per capita disposable income[27] (standardized to the 1978 price level using the consumer price index); annual ownership of refrigerators per 100 households[27]; B: Lifestyle and environmental factors. Helicobacter pylori infection rate (derived from systematic literature reviews[41,42], with urban-rural calibration based on period-specific ratios; see Supplementary Table 1 for details); proportion of smokers[50]; average daily alcohol consumption per capita[49] (standardized using the urban-rural consumption expenditure ratio); proportions of urban and rural populations[27]; annual chemical oxygen demand emissions from industrial wastewater and municipal domestic sewage[52]; annual ammonia nitrogen emissions from industrial wastewater and municipal domestic sewage[52]. All trends are presented as observed; no interpolation or smoothing was applied.
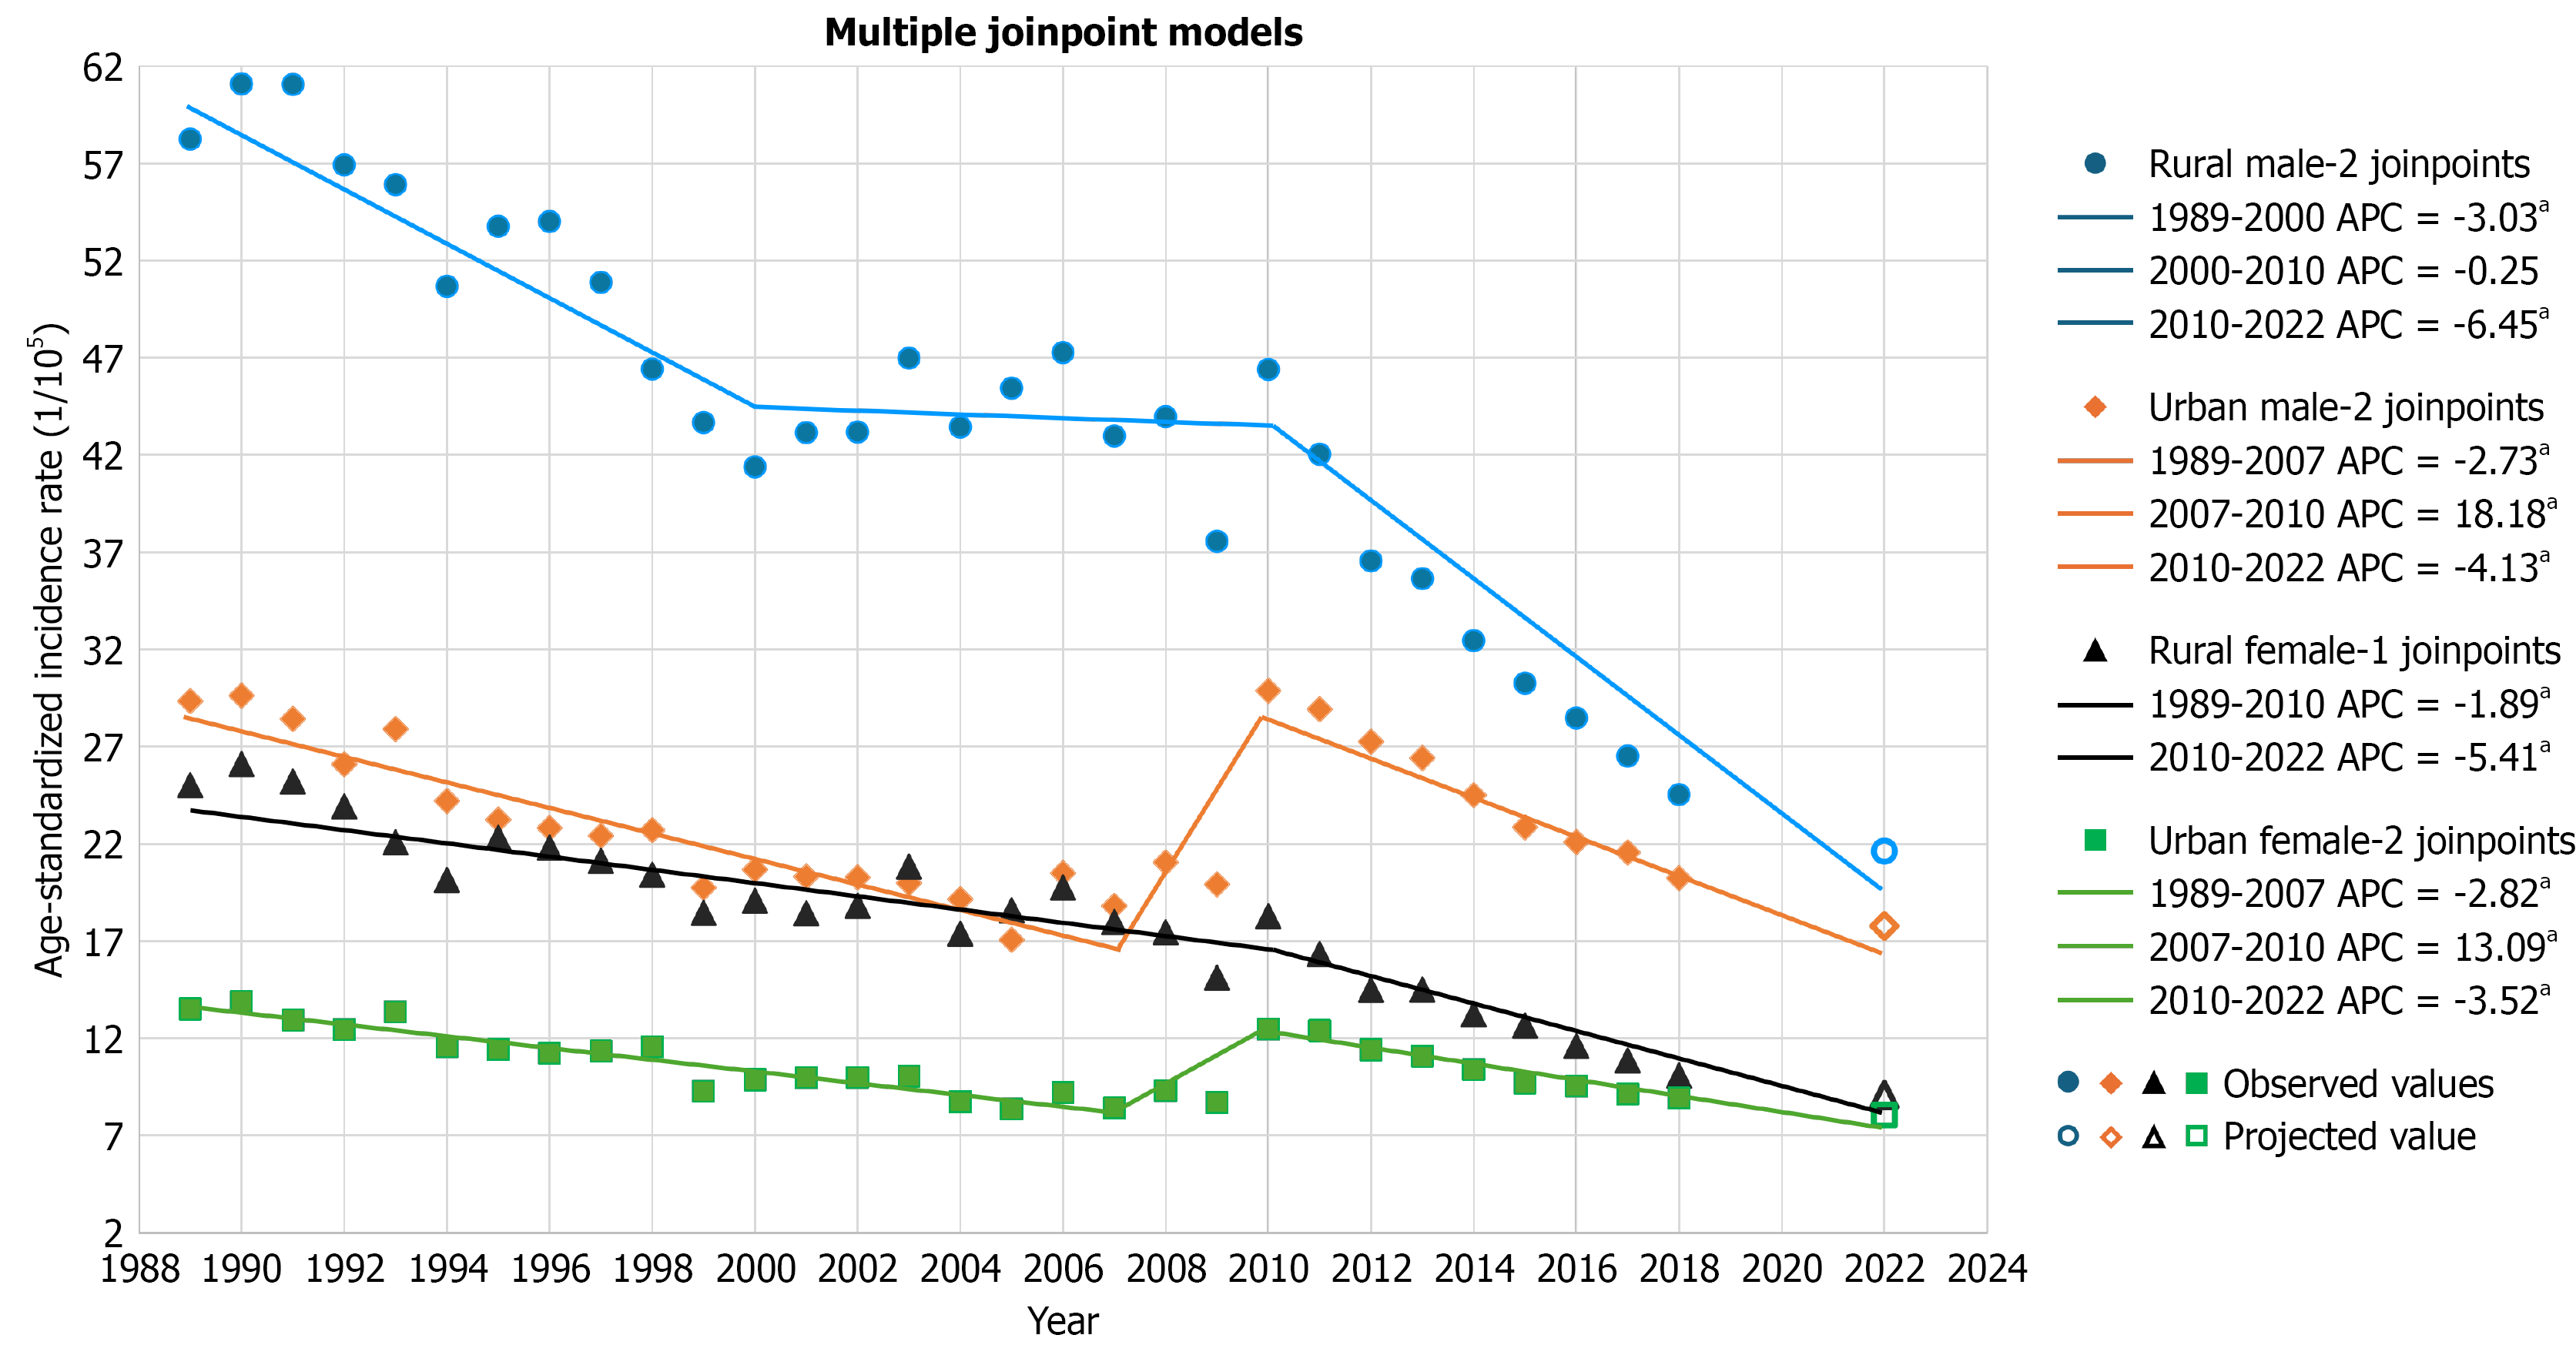
Figure 2 Age-standardized incidence rate of gastric cancer in China, 1989-2022, by sex and urban/rural residence.
Symbols: Filled symbols (blue circles, orange diamonds, black triangles, green squares) represent observed age-standardized incidence rates (per 100000, Chinese standard population) from the National Cancer Center of China (1989-2018). Open symbols (circles, diamonds, triangles, squares) represent projected values for 2022 estimated using a Bayesian age-period-cohort model fitted to data from 106 cancer registries during 2010-2018, with bias correction using 2018 data from 700 registries[2]. Solid lines represent Joinpoint regression fitted segments; joinpoints (trend change points) are indicated by line intersections. Rural male (blue, 2 joinpoints): Average annual percent change (AAPC) -3.47%a [95% confidence interval (CI): -4.19% to -2.74%]; annual percent change (APC) -3.03%a (1989-2000), -0.25% (2000-2010), -6.45%a (2010-2022). Urban male (orange, 2 joinpoints): AAPC -1.51%a (95%CI: -2.68% to -0.33%); APC -2.73%a (1989-2007), 18.18%a (2007-2010), -4.13%a (2010-2022). Rural female (black, 1 joinpoint): AAPC -3.18%a (95%CI: -3.86% to -2.5%); APC -1.89%a (1989-2010), -5.41%a (2010-2022). Urban female (green, 2 joinpoints): AAPC -1.73%a (95%CI: -2.91% to -0.53%); APC -2.82%a (1989-2007), 13.09%a (2007-2010), -3.52%a (2010-2022). aP < 0.05. Source: National Cancer Center of China[2,9-24]. The increases in urban males and urban females during 2007-2010 likely reflect data artifacts from the 2004 expansion of cancer registries and changes in diagnostic practices, rather than true epidemiological increases. Interpretation of incidence trends is primarily based on the filled-symbol observed data (1989-2018). Open-symbol projected values should be interpreted cautiously.
- Citation: Ren L, Zhang W, Sun L, Li WW, Xiao J, Wang W, Zhao CL, Han C. Gastric cancer incidence trends in China: 1989-2018 registry data, 2022 Bayesian age-period-cohort estimates, ecological correlates. World J Clin Oncol 2026; 17(9): 125511
- URL: https://www.wjgnet.com/2218-4333/full/v17/i9/125511.htm
- DOI: https://dx.doi.org/10.5306/wjco.125511