
















Copyright: ©Author(s) 2026.
World J Clin Oncol. Sep 24, 2026; 17(9): 124416
Published online Sep 24, 2026. doi: 10.5306/wjco.124416
Published online Sep 24, 2026. doi: 10.5306/wjco.124416
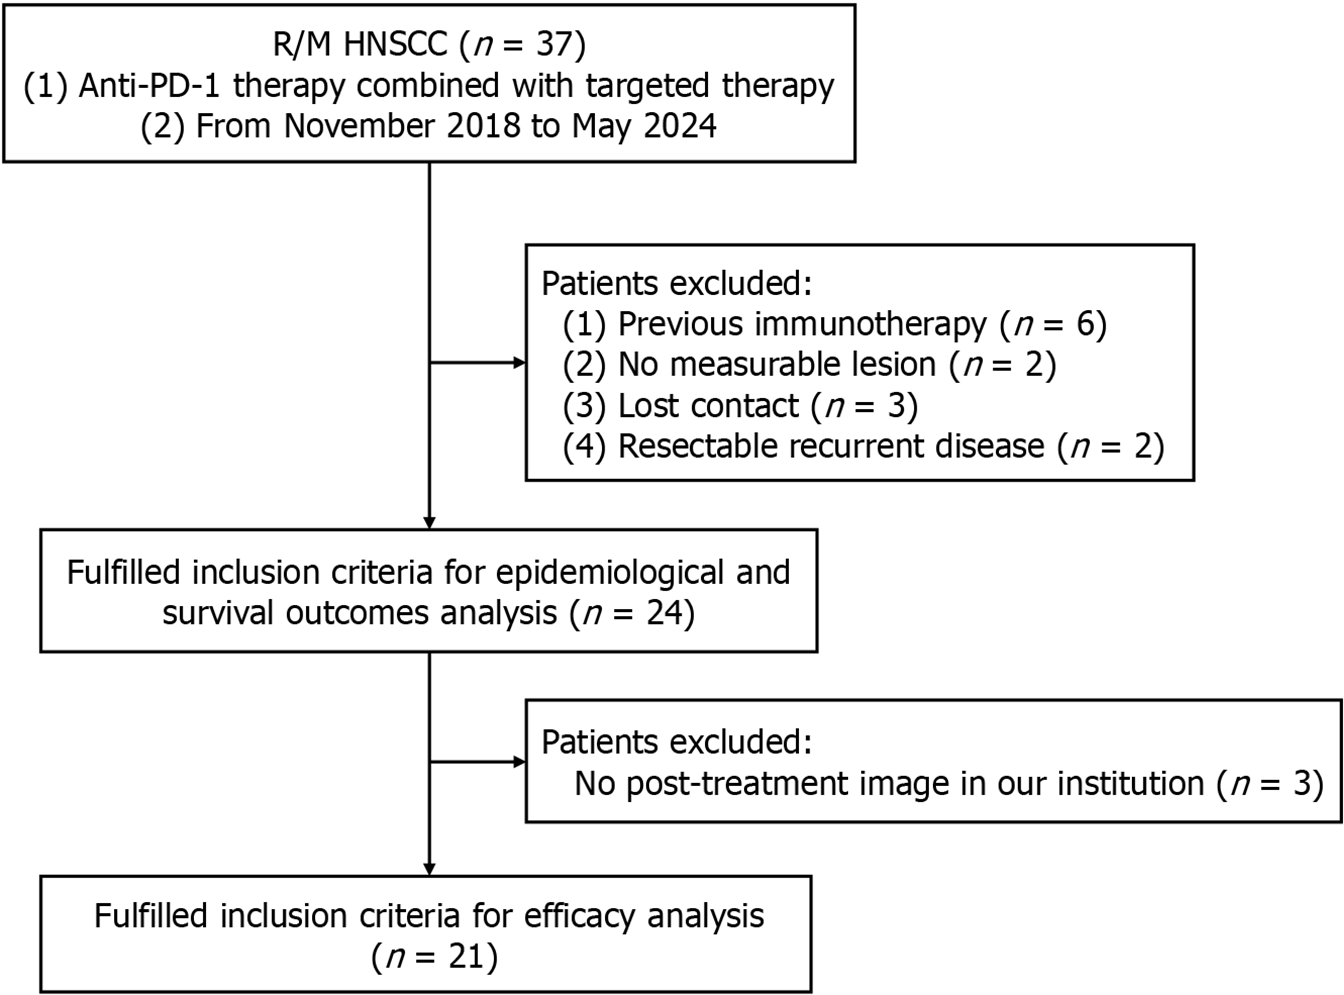
Figure 1 Flow chart demonstrating the study cohort.
R/M HNSCC: Recurrent and/or metastatic head and neck squamous cell carcinoma.
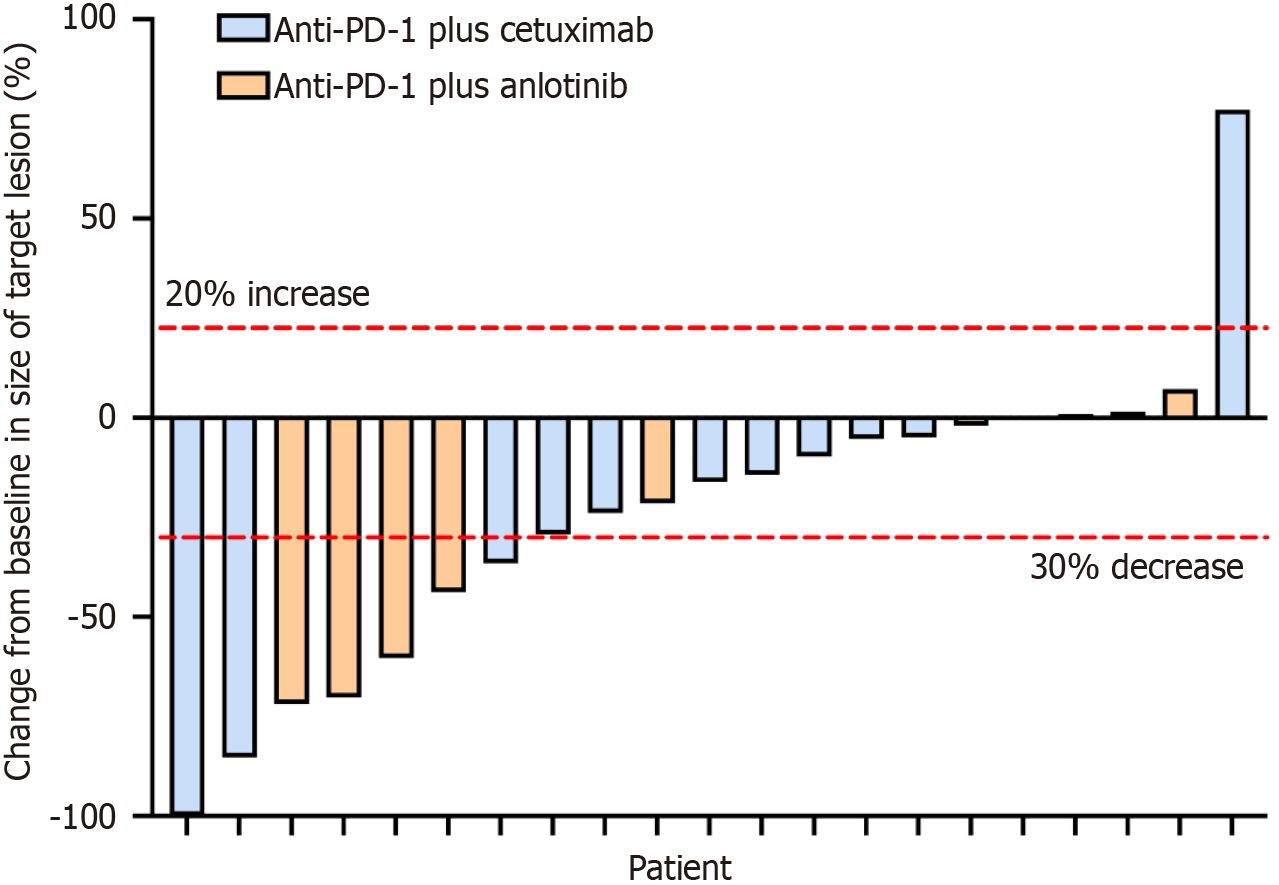
Figure 2 Waterfall plot of best overall response based on target lesions only.
21 (87.5%) of 24 patients are included. 3 participants are excluded in the efficacy analysis due to the lack of post-treatment image for Response Evaluation Criteria in Solid Tumors. PD-1: Programmed cell death 1.
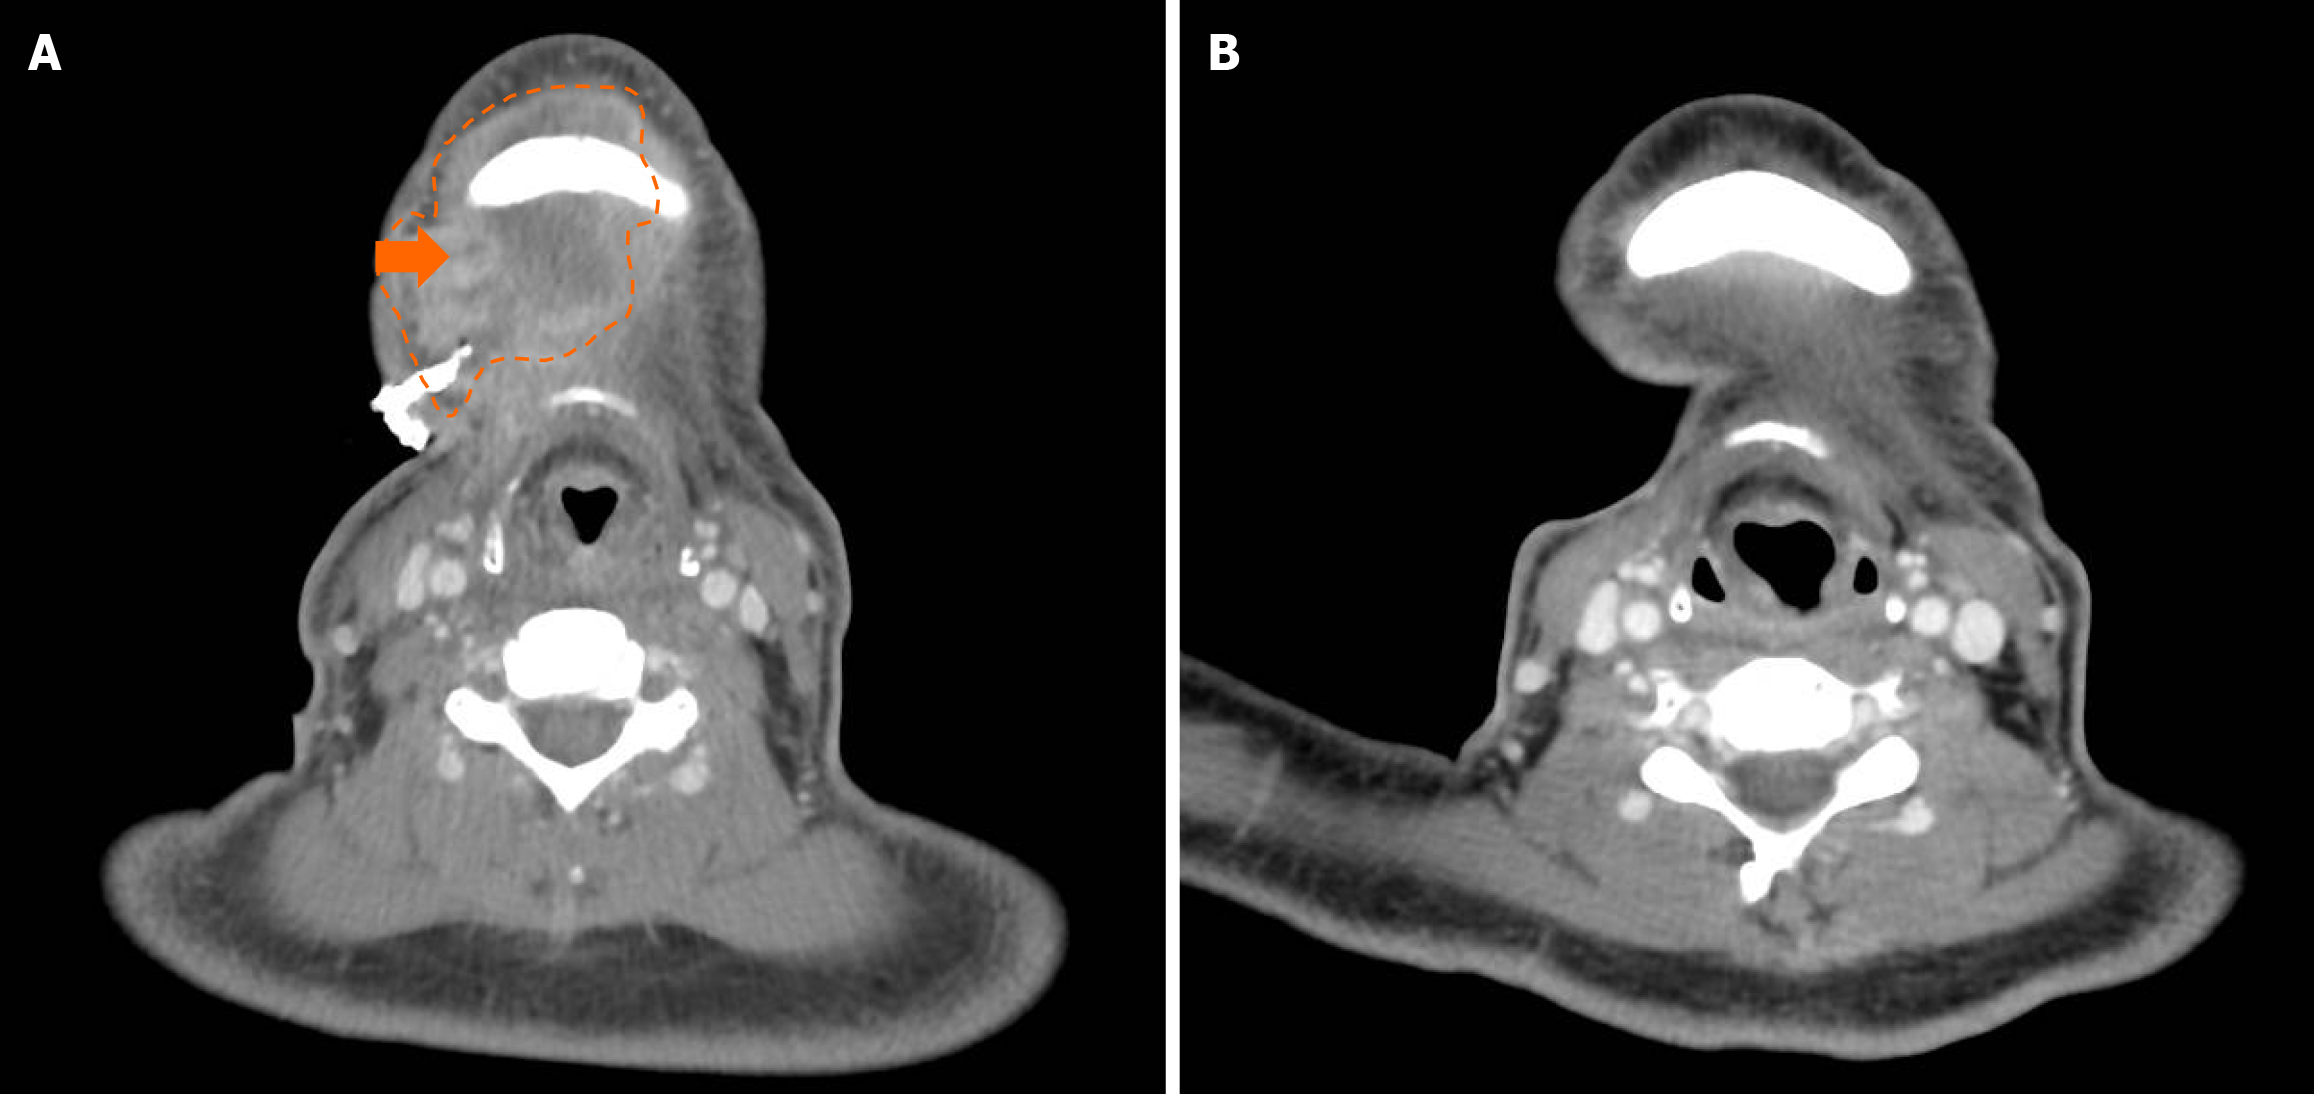
Figure 3 Radiological changes of target lesions at the primary site in a female patient with control rate.
A: Baseline imaging at recurrence; B: After the administration of pembrolizumab plus cetuximab.
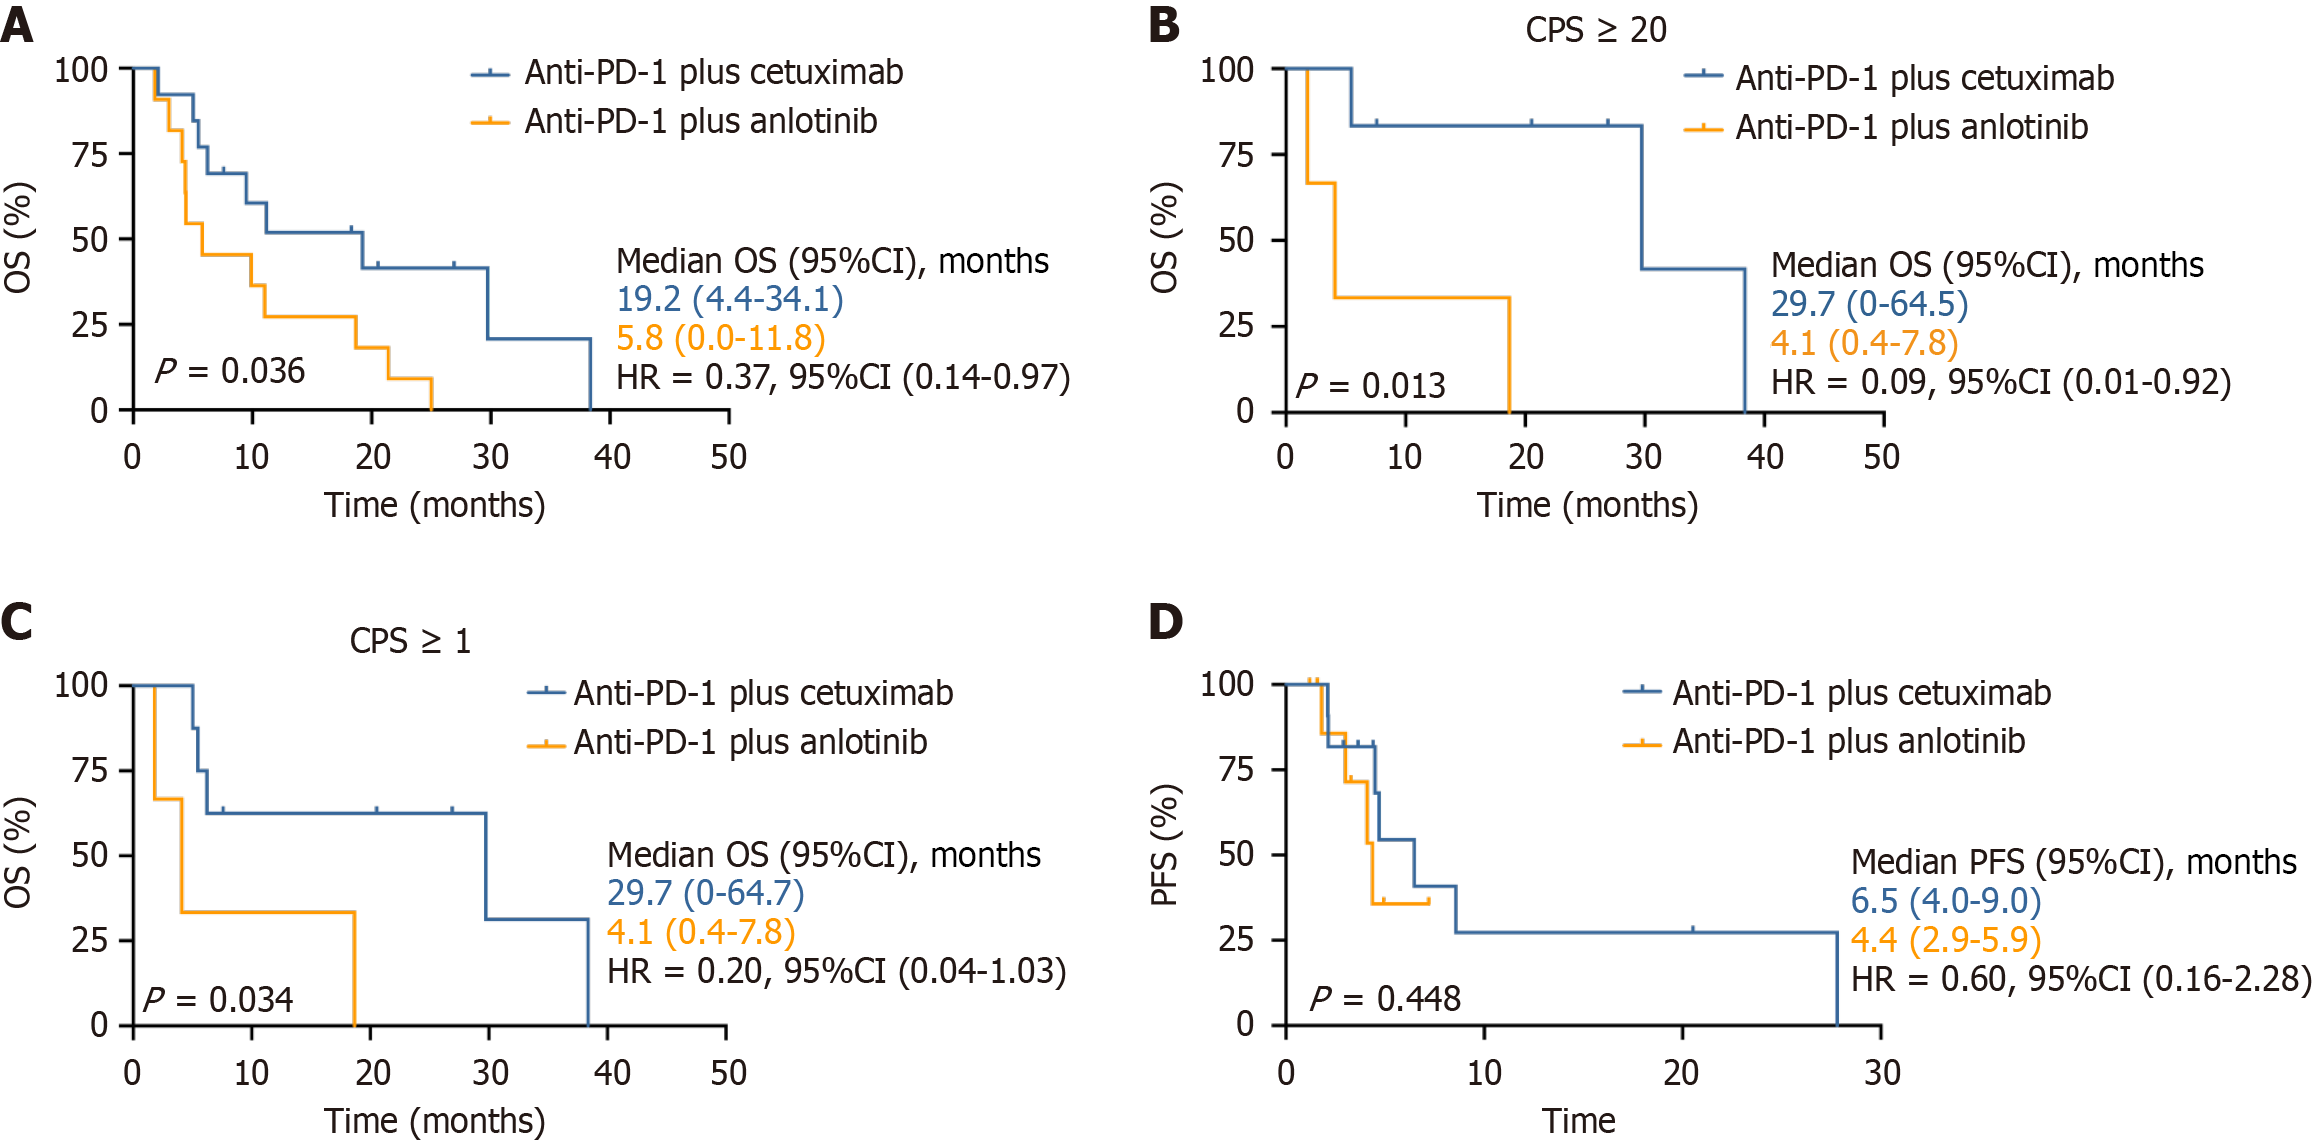
Figure 4 Kaplan-Meier curves of overall survival and progression-free survival for enrolled patients.
A: Overall survival (OS) of all patients; B: OS of patients with combined positive score (CPS) ≥ 20; C: OS of patients with CPS ≥ 1; D: Progression-free survival of all patients. OS: Overall survival; CI: Confidence interval; HR: Hazard ratio; CPS: Combined positive score; PD-1: Programmed cell death 1.
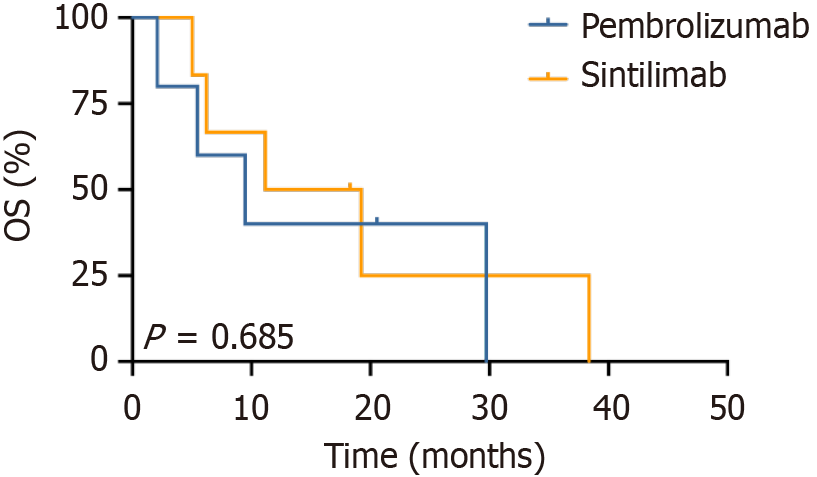
Figure 5 Kaplan-Meier curves representing overall survival of patients treated with anti-programmed cell death 1 plus anti-epidermal growth factor receptor stratified by programmed cell death 1 antibody.
OS: Overall survival.
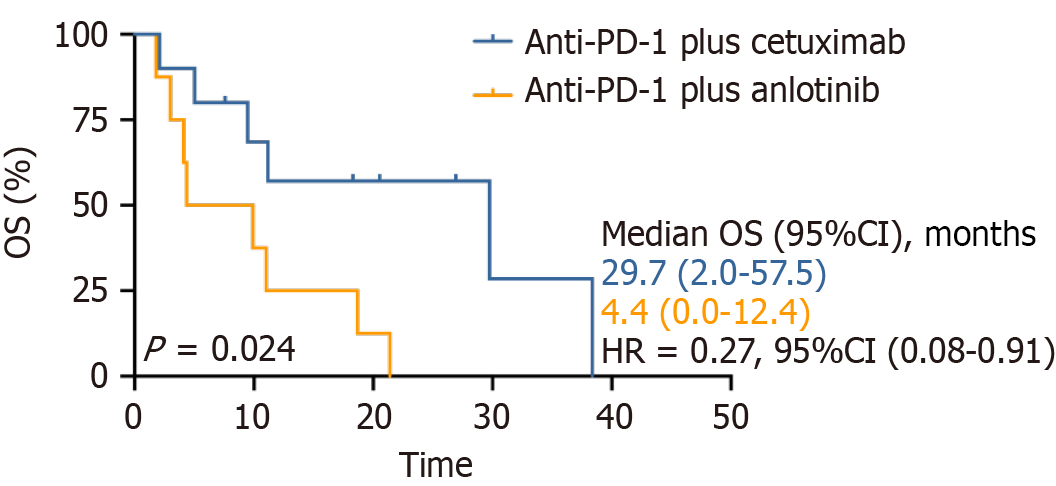
Figure 6 Kaplan-Meier curves representing overall survival of patients in the first-line treatment for recurrent or metastatic disease.
OS: Overall survival; CI: Confidence interval; HR: Hazard ratio; PD-1: Programmed cell death 1.
- Citation: Wang JX, Wang TX, Song YT, Xu GH, Zhang YB, Zhang B. Efficacy of two programmed cell death 1 combination regimens in recurrent and/or metastatic head and neck carcinoma: A real-world retrospective study. World J Clin Oncol 2026; 17(9): 124416
- URL: https://www.wjgnet.com/2218-4333/full/v17/i9/124416.htm
- DOI: https://dx.doi.org/10.5306/wjco.124416