
















Copyright: ©Author(s) 2026.
World J Clin Oncol. Sep 24, 2026; 17(9): 124416
Published online Sep 24, 2026. doi: 10.5306/wjco.124416
Published online Sep 24, 2026. doi: 10.5306/wjco.124416
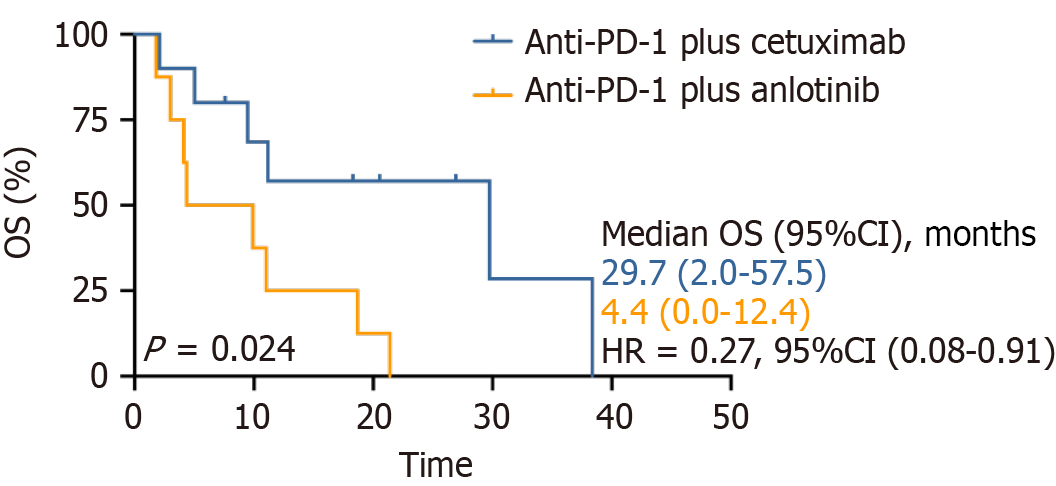
Figure 6 Kaplan-Meier curves representing overall survival of patients in the first-line treatment for recurrent or metastatic disease.
OS: Overall survival; CI: Confidence interval; HR: Hazard ratio; PD-1: Programmed cell death 1.
- Citation: Wang JX, Wang TX, Song YT, Xu GH, Zhang YB, Zhang B. Efficacy of two programmed cell death 1 combination regimens in recurrent and/or metastatic head and neck carcinoma: A real-world retrospective study. World J Clin Oncol 2026; 17(9): 124416
- URL: https://www.wjgnet.com/2218-4333/full/v17/i9/124416.htm
- DOI: https://dx.doi.org/10.5306/wjco.124416