
















Copyright: ©Author(s) 2026.
World J Clin Oncol. Sep 24, 2026; 17(9): 123454
Published online Sep 24, 2026. doi: 10.5306/wjco.123454
Published online Sep 24, 2026. doi: 10.5306/wjco.123454
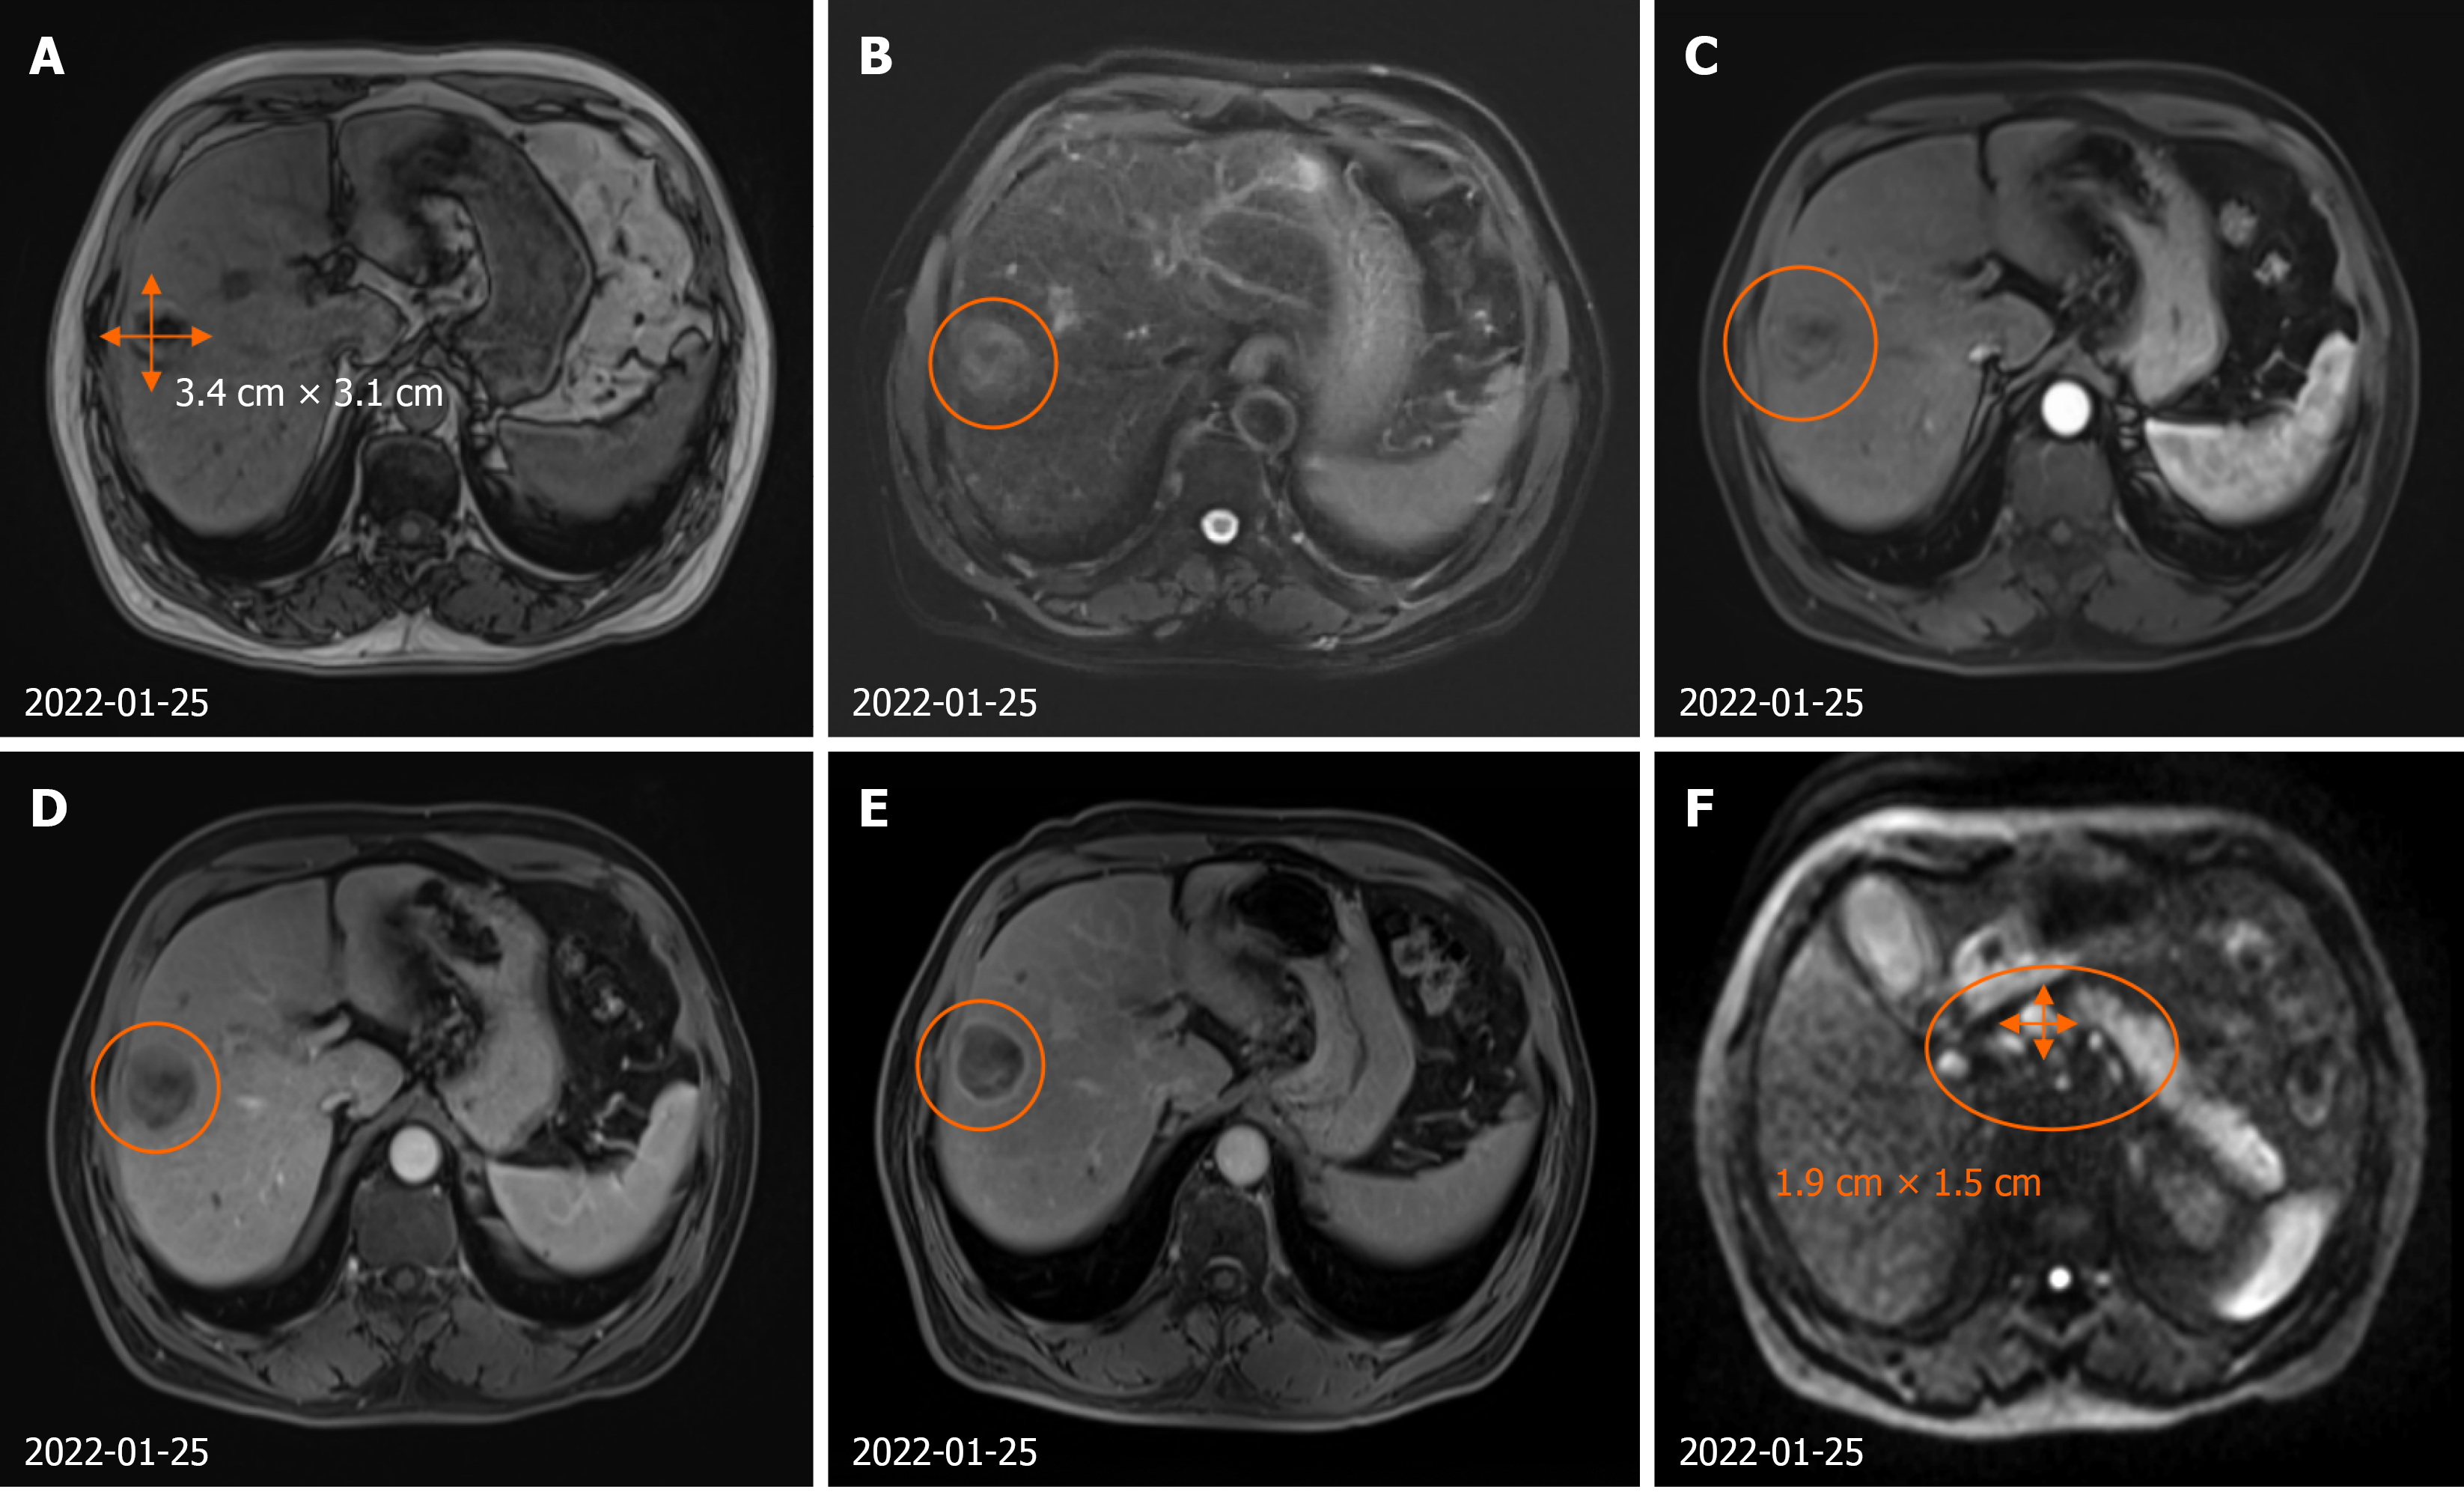
Figure 1 Hepatocellular carcinoma with multiple lymph node metastases in the liver, hepatic hilar region, peripancreatic head region, retroperitoneum, pelvic cavity, bilateral iliac vascular regions, and bilateral inguinal regions.
A: T1-weighted sequence of plain abdominal magnetic resonance imaging (MRI) at the junction of segments S8 and S5 of the liver; B: T2-weighted sequence of plain abdominal MRI at the junction of segments S8 and S5 of the liver; C: Arterial phase of enhanced abdominal MRI at the junction of segments S8 and S5 of the liver; D: Venous phase of enhanced abdominal MRI at the junction of segments S8 and S5 of the liver; E: Delayed phase of enhanced abdominal MRI at the junction of segments S8 and S5 of the liver; F: Multiple metastatic lymph nodes in the hepatic hilar region and peripancreatic head region.
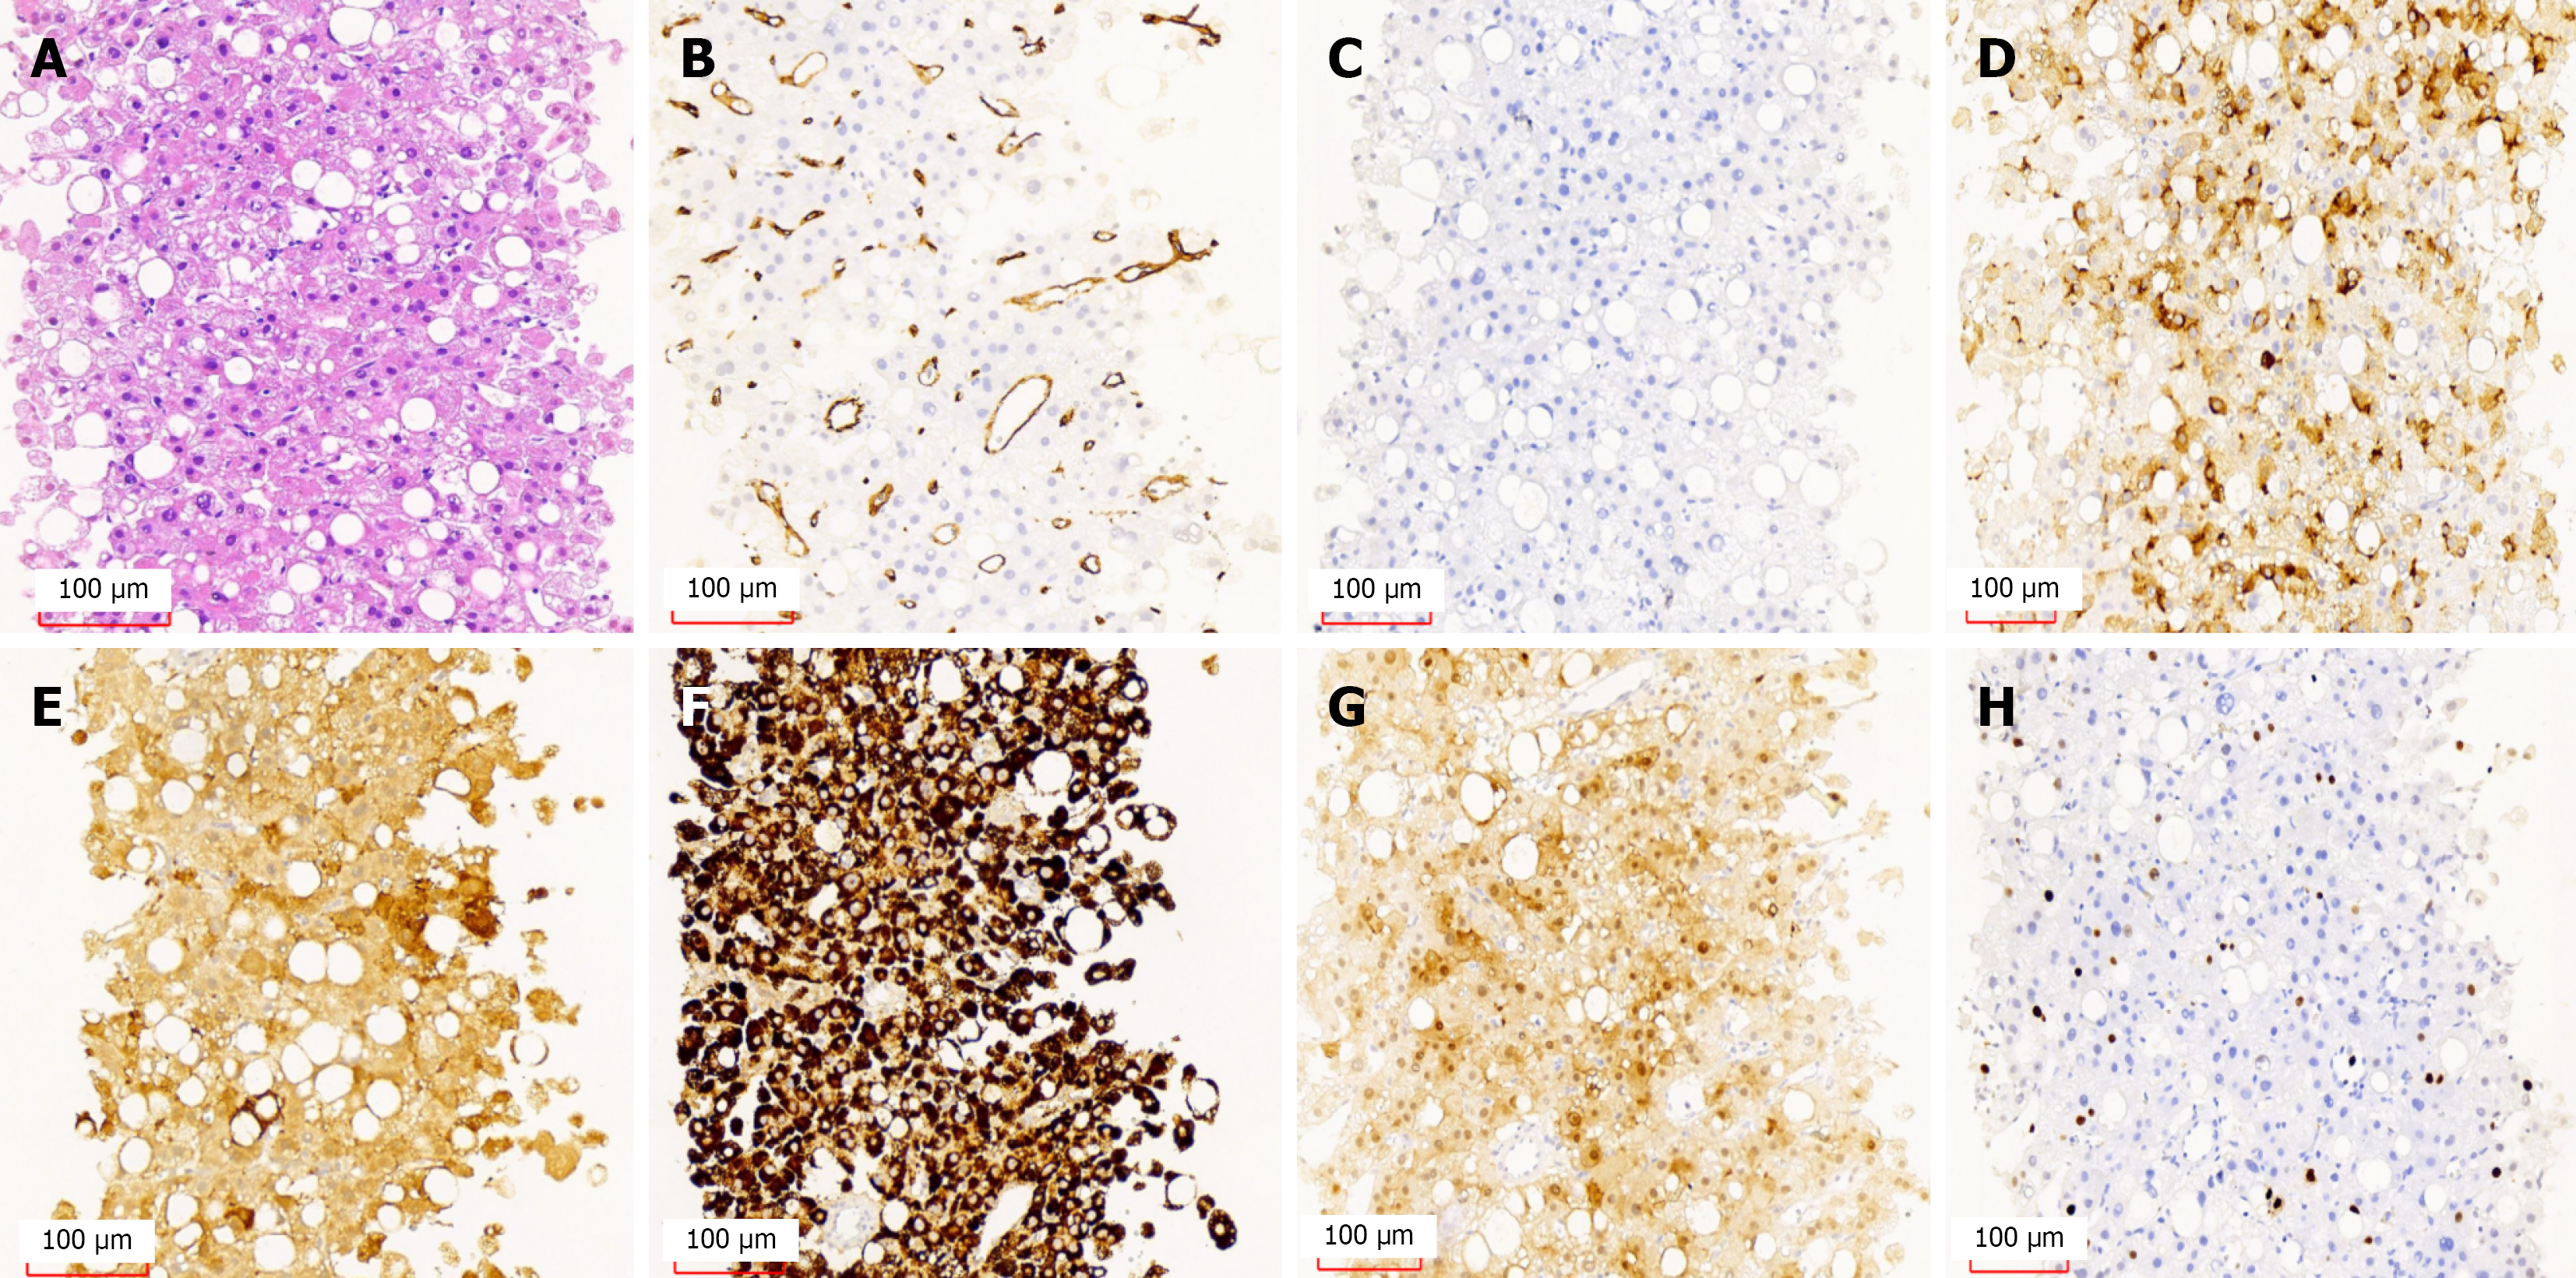
Figure 2 Histopathological examination of liver tissue.
A: Hematoxylin and eosin (HE); B: Cluster of differentiation 34 (CD34); C: Cytokeratin 7 (CK7); D: Glypican-3 (Gly-3); E: Glutamine synthetase (GS); F: Hepatocyte-1 (Hep-1); G: Heat Shock Protein 70 (HSP70); H: Ki-67 (Ki67). Liver tumor cells are arranged in trabeculae of at least two cell layers thick. The trabeculae are separated by hepatic sinusoids lined with a single layer of endothelial cells, and no bile duct structures are observed. Immunohistochemical staining: Ki-67 (+, < 5%); HSP70 (weakly positive); Hep-1 (+); GS (+); Gly-3 (equivocal ±); CD34 (vascular positive); CK7 (focally positive).
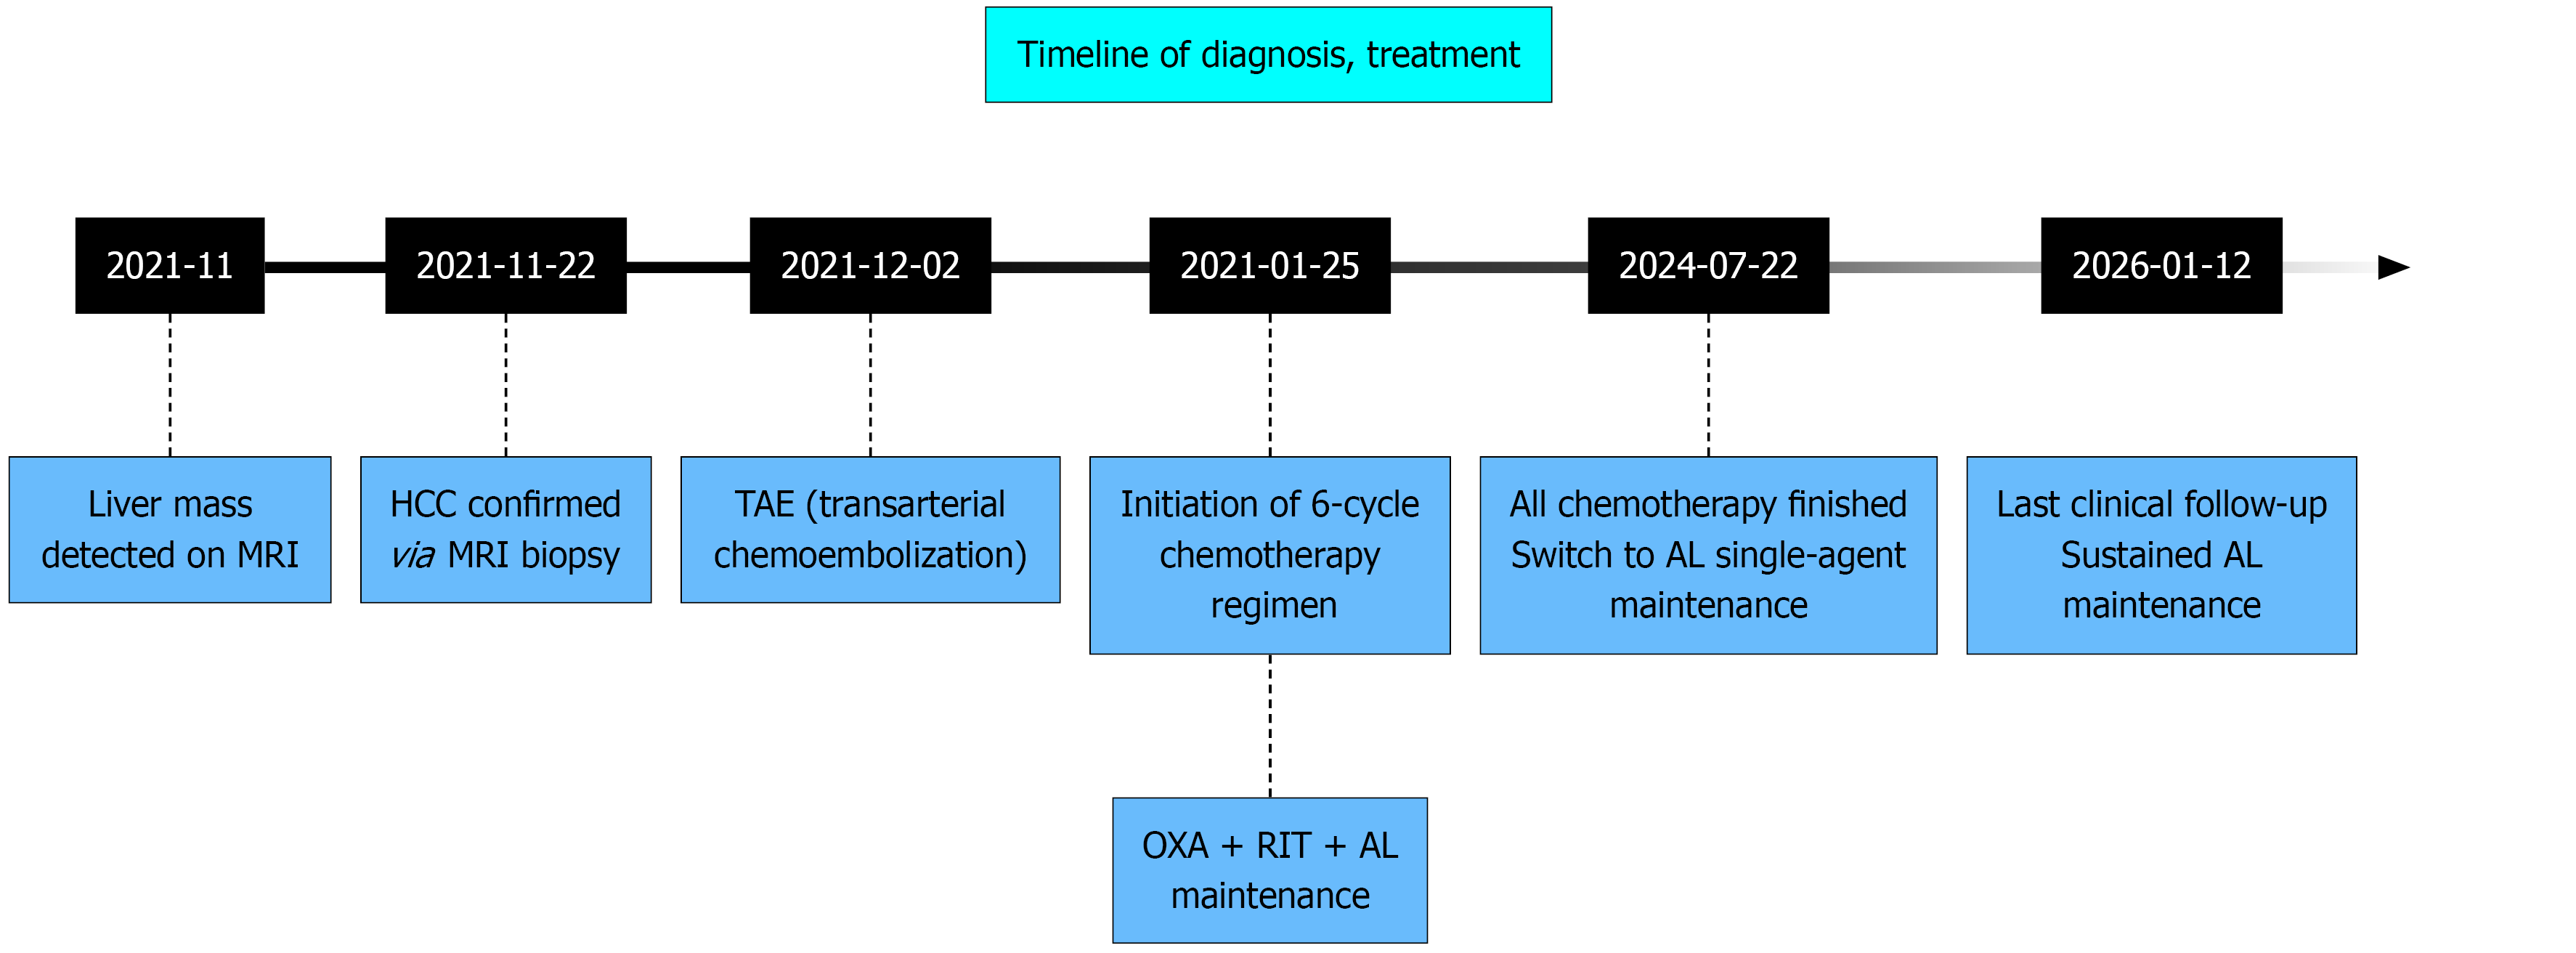
Figure 3 Timeline of diagnosis and treatment.
Timeline of diagnosis, treatment interventions, response assessments, and key laboratory parameters from initial diagnosis (November 2021) through to last follow-up (January 2026). MRI: Magnetic resonance imaging; HCC: Hepatocellular carcinoma; TAE: Transcatheter arterial embolization; OXA: Oxaliplatin; RIT: Raltitrexed; AL: Anlotinib.
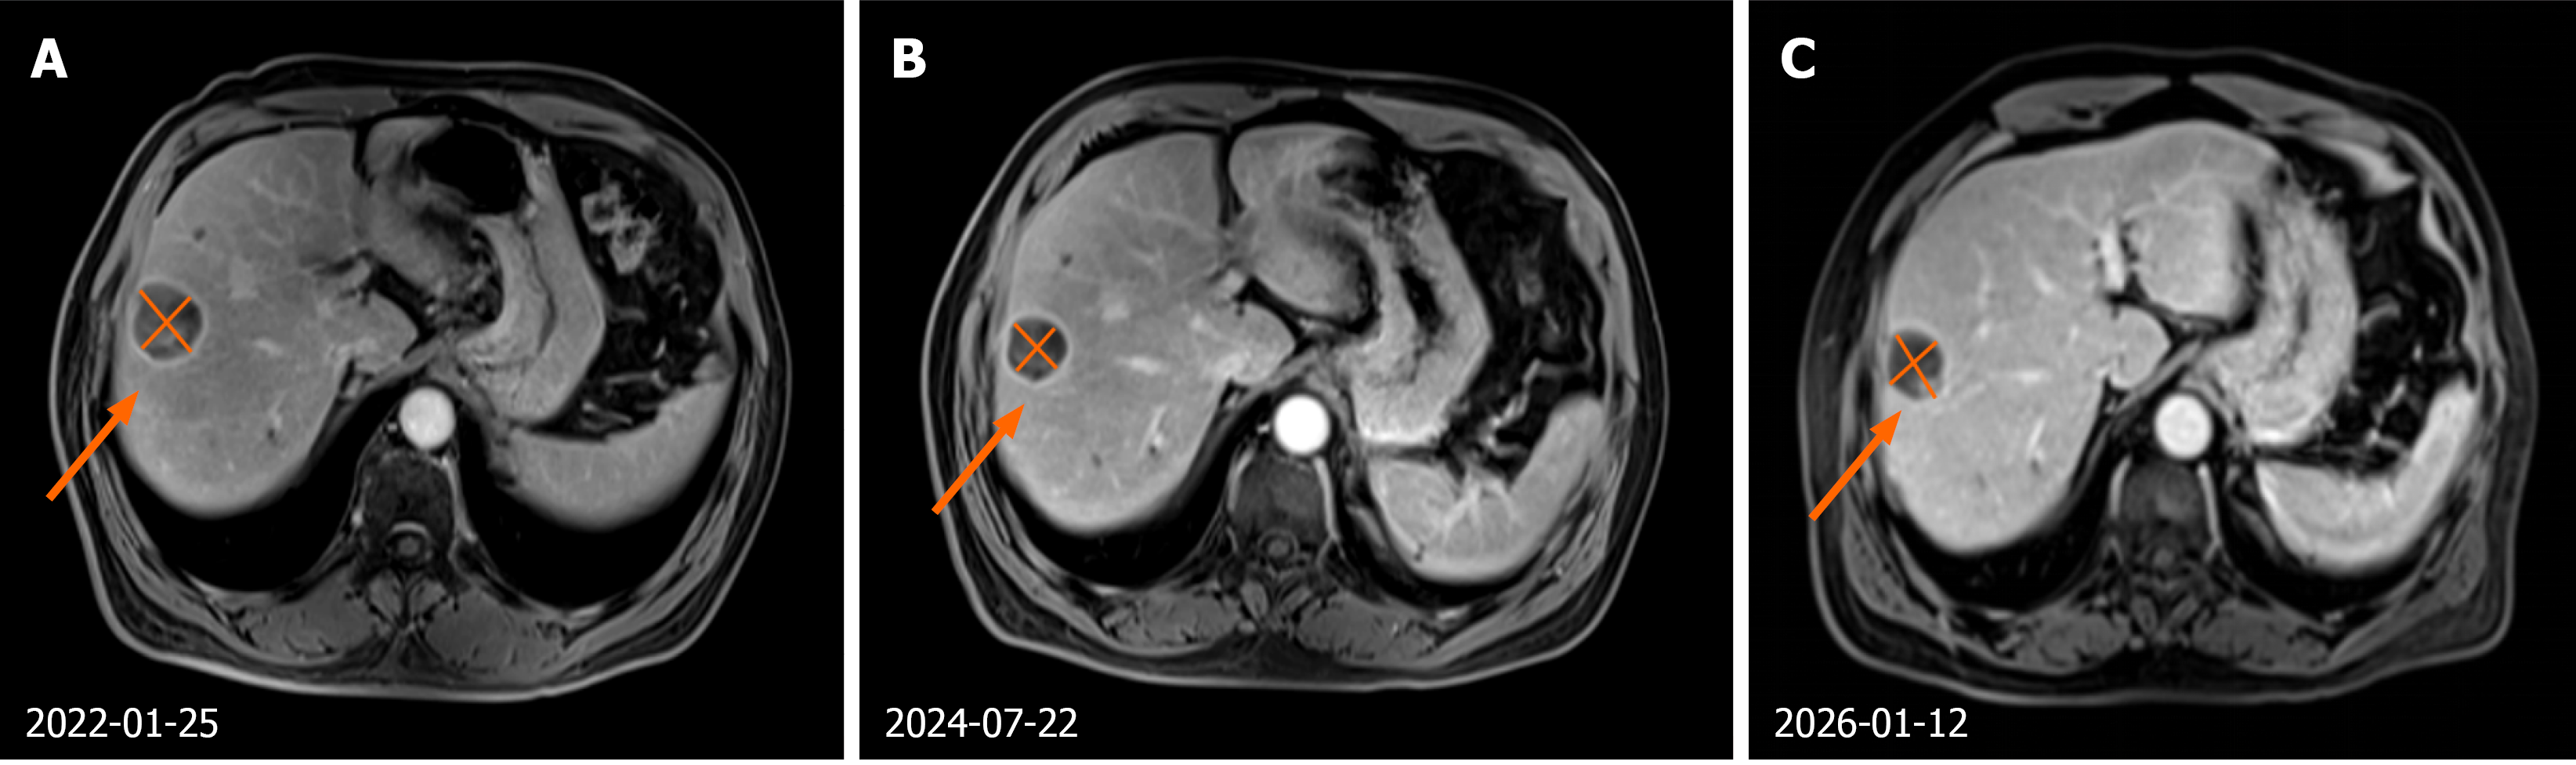
Figure 4 Comparison of primary hepatic lesions in the portal venous phase after treatment.
A: The lesion size was approximately 3.4 cm × 3.1 cm on January 25, 2022 (stable disease); B: The lesion size was approximately 2.6 cm × 2.6 cm on July 22, 2024 partial response (PR); C: The lesion size was approximately 2.6 cm × 2.3 cm on January 12, 2026 (PR, stable).
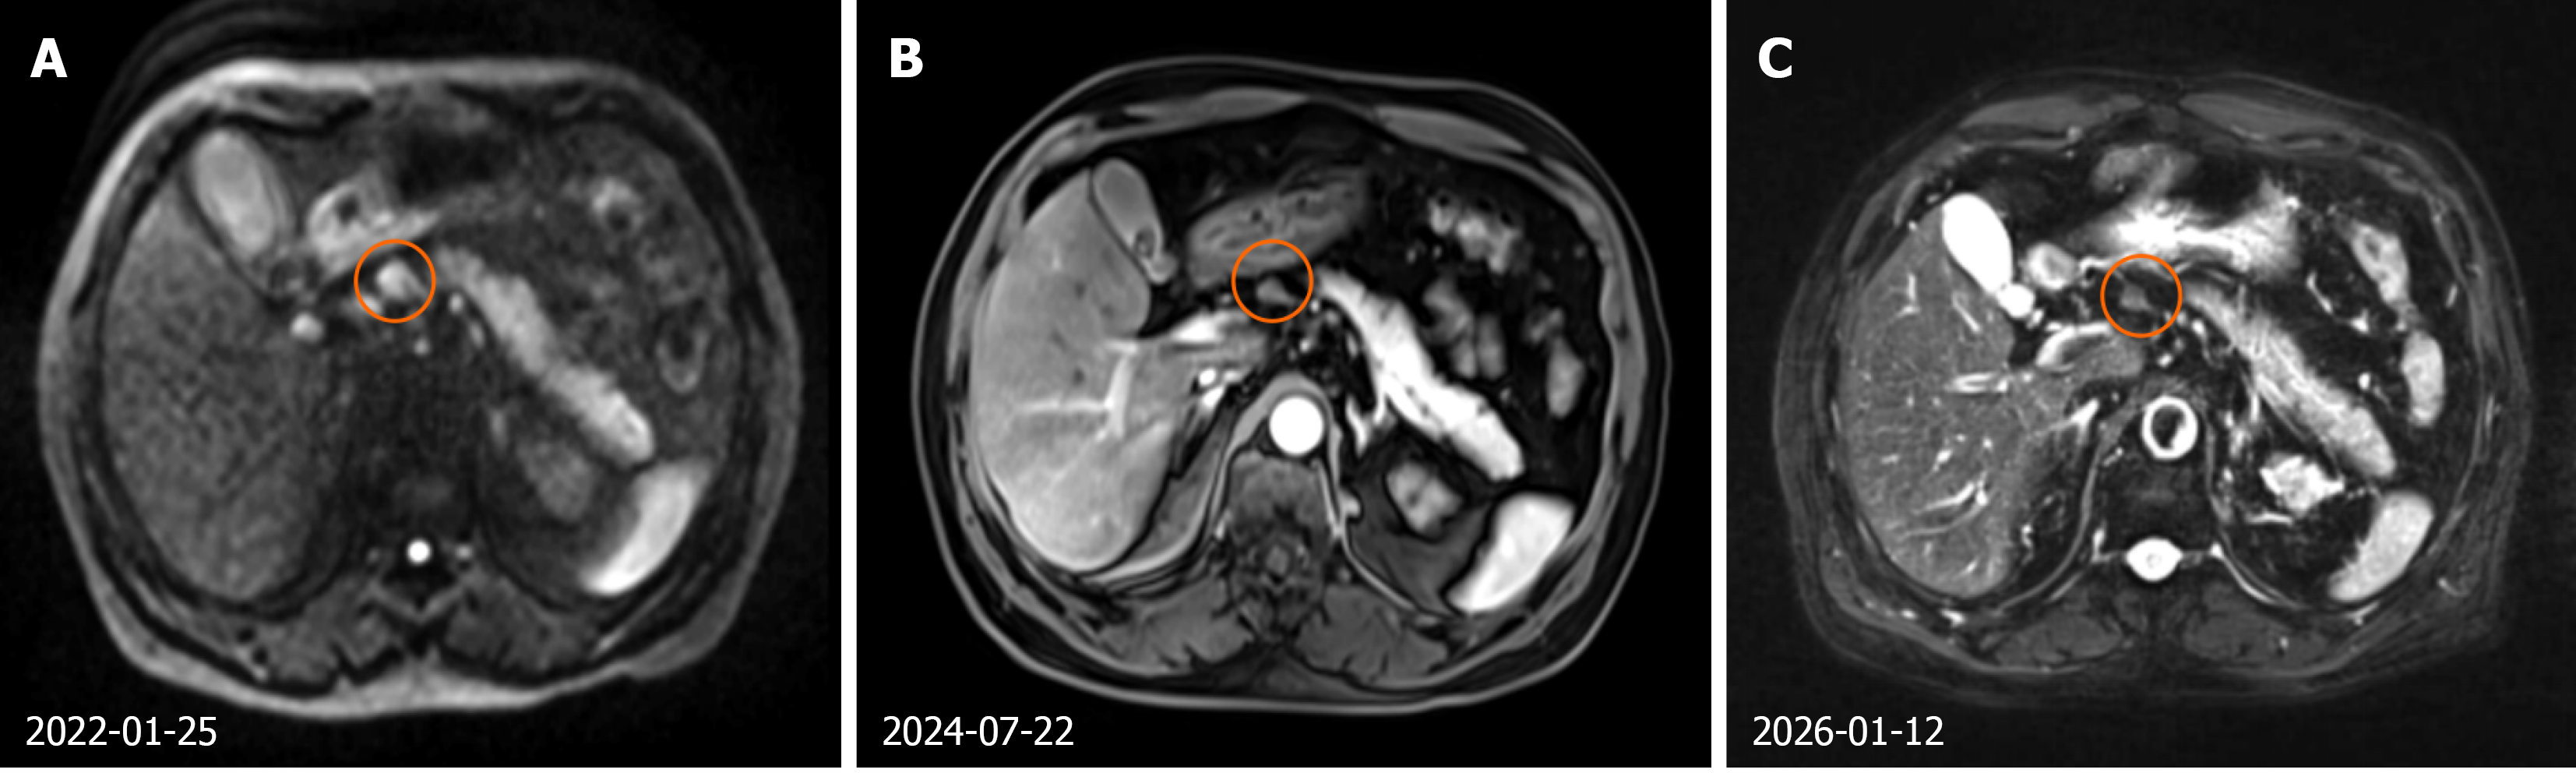
Figure 5 Comparison of metastatic lymph node size after treatment.
A: The major metastatic lymph node measured 1.9 cm × 1.5 cm on January 25, 2022 (stable disease); B: The major metastatic lymph node measured 1.4 cm × 0.9 cm on July 22, 2024 (partial response [PR]); C: The major metastatic lymph node decreased to 5-7 mm in diameter on January 12, 2026 (PR, stable).
- Citation: Yu SL, Liu JE, Li CY, Ling H, Tao HY, Shen YQ. Efficacy of transcatheter arterial embolization plus targeted chemotherapy for advanced hepatocellular carcinoma: A case report and literature review. World J Clin Oncol 2026; 17(9): 123454
- URL: https://www.wjgnet.com/2218-4333/full/v17/i9/123454.htm
- DOI: https://dx.doi.org/10.5306/wjco.123454