
















Copyright: ©Author(s) 2026.
World J Clin Oncol. Nov 24, 2026; 17(11): 125117
Published online Nov 24, 2026. doi: 10.5306/wjco.125117
Published online Nov 24, 2026. doi: 10.5306/wjco.125117
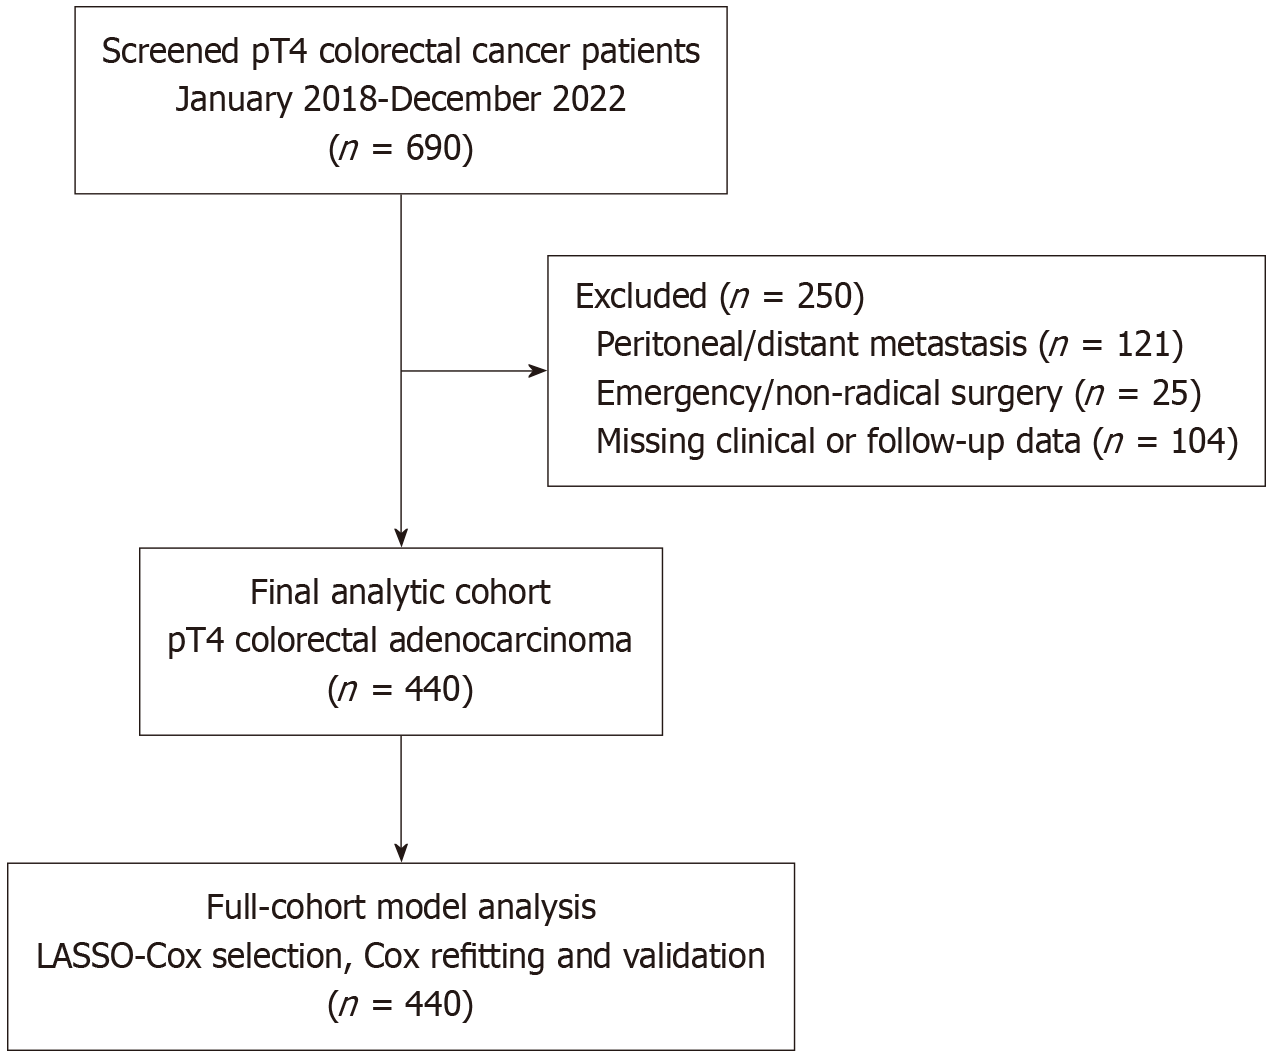
Figure 1 Study flow diagram.
LASSO: Least absolute shrinkage and selection operator; pT4: Pathological T4.
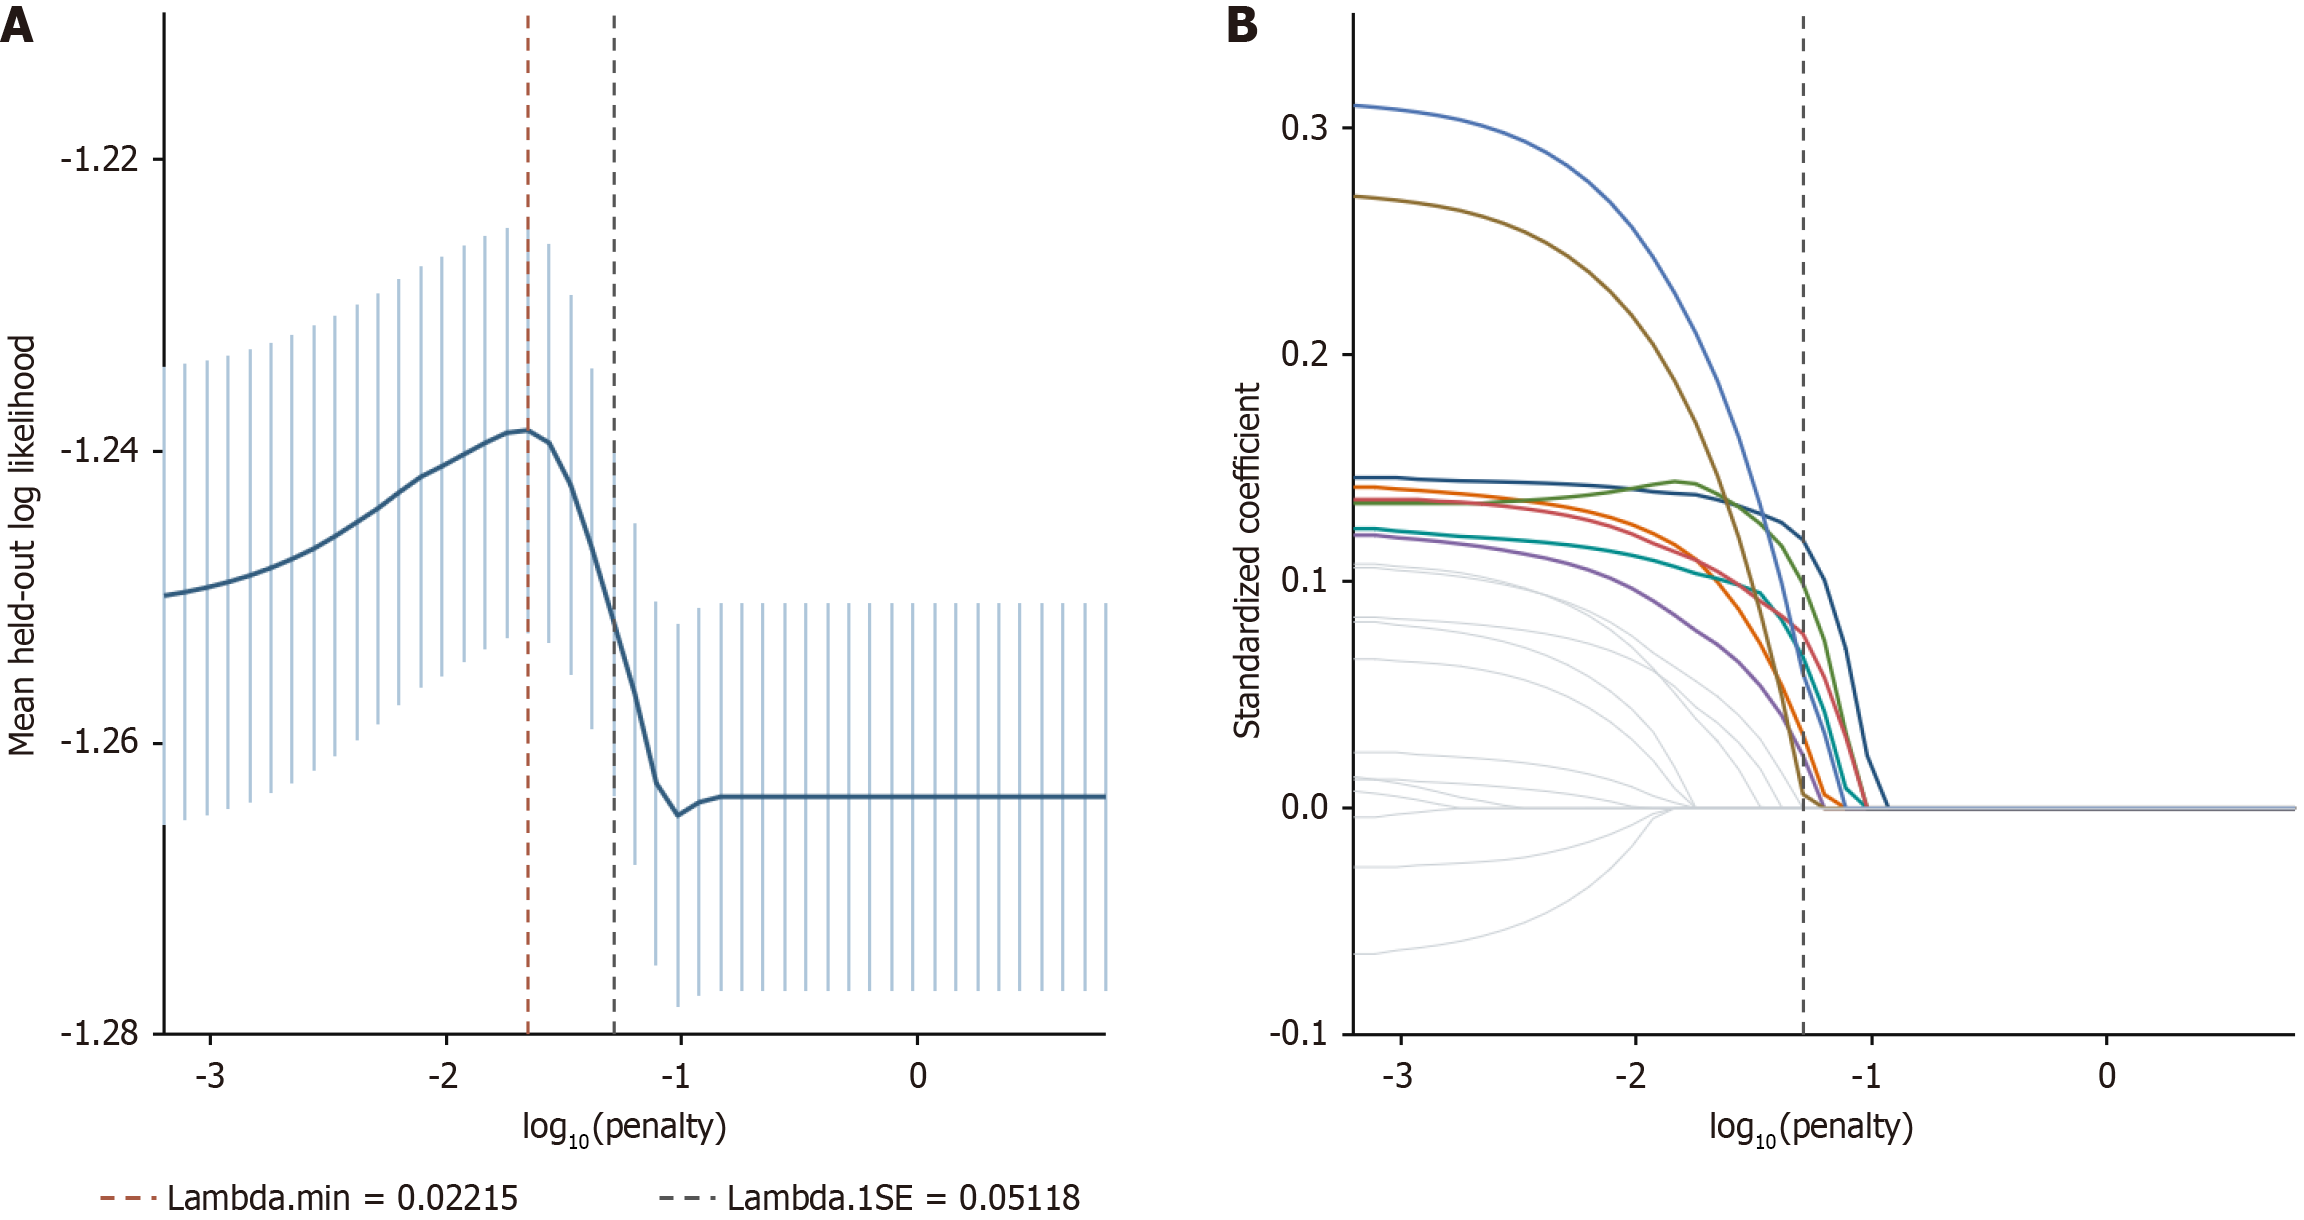
Figure 2 Least absolute shrinkage and selection operator-Cox variable selection.
A: Ten-fold cross-validation with standard-error bars and the minimum-error and one-standard-error penalties; B: Standardized coefficient paths.
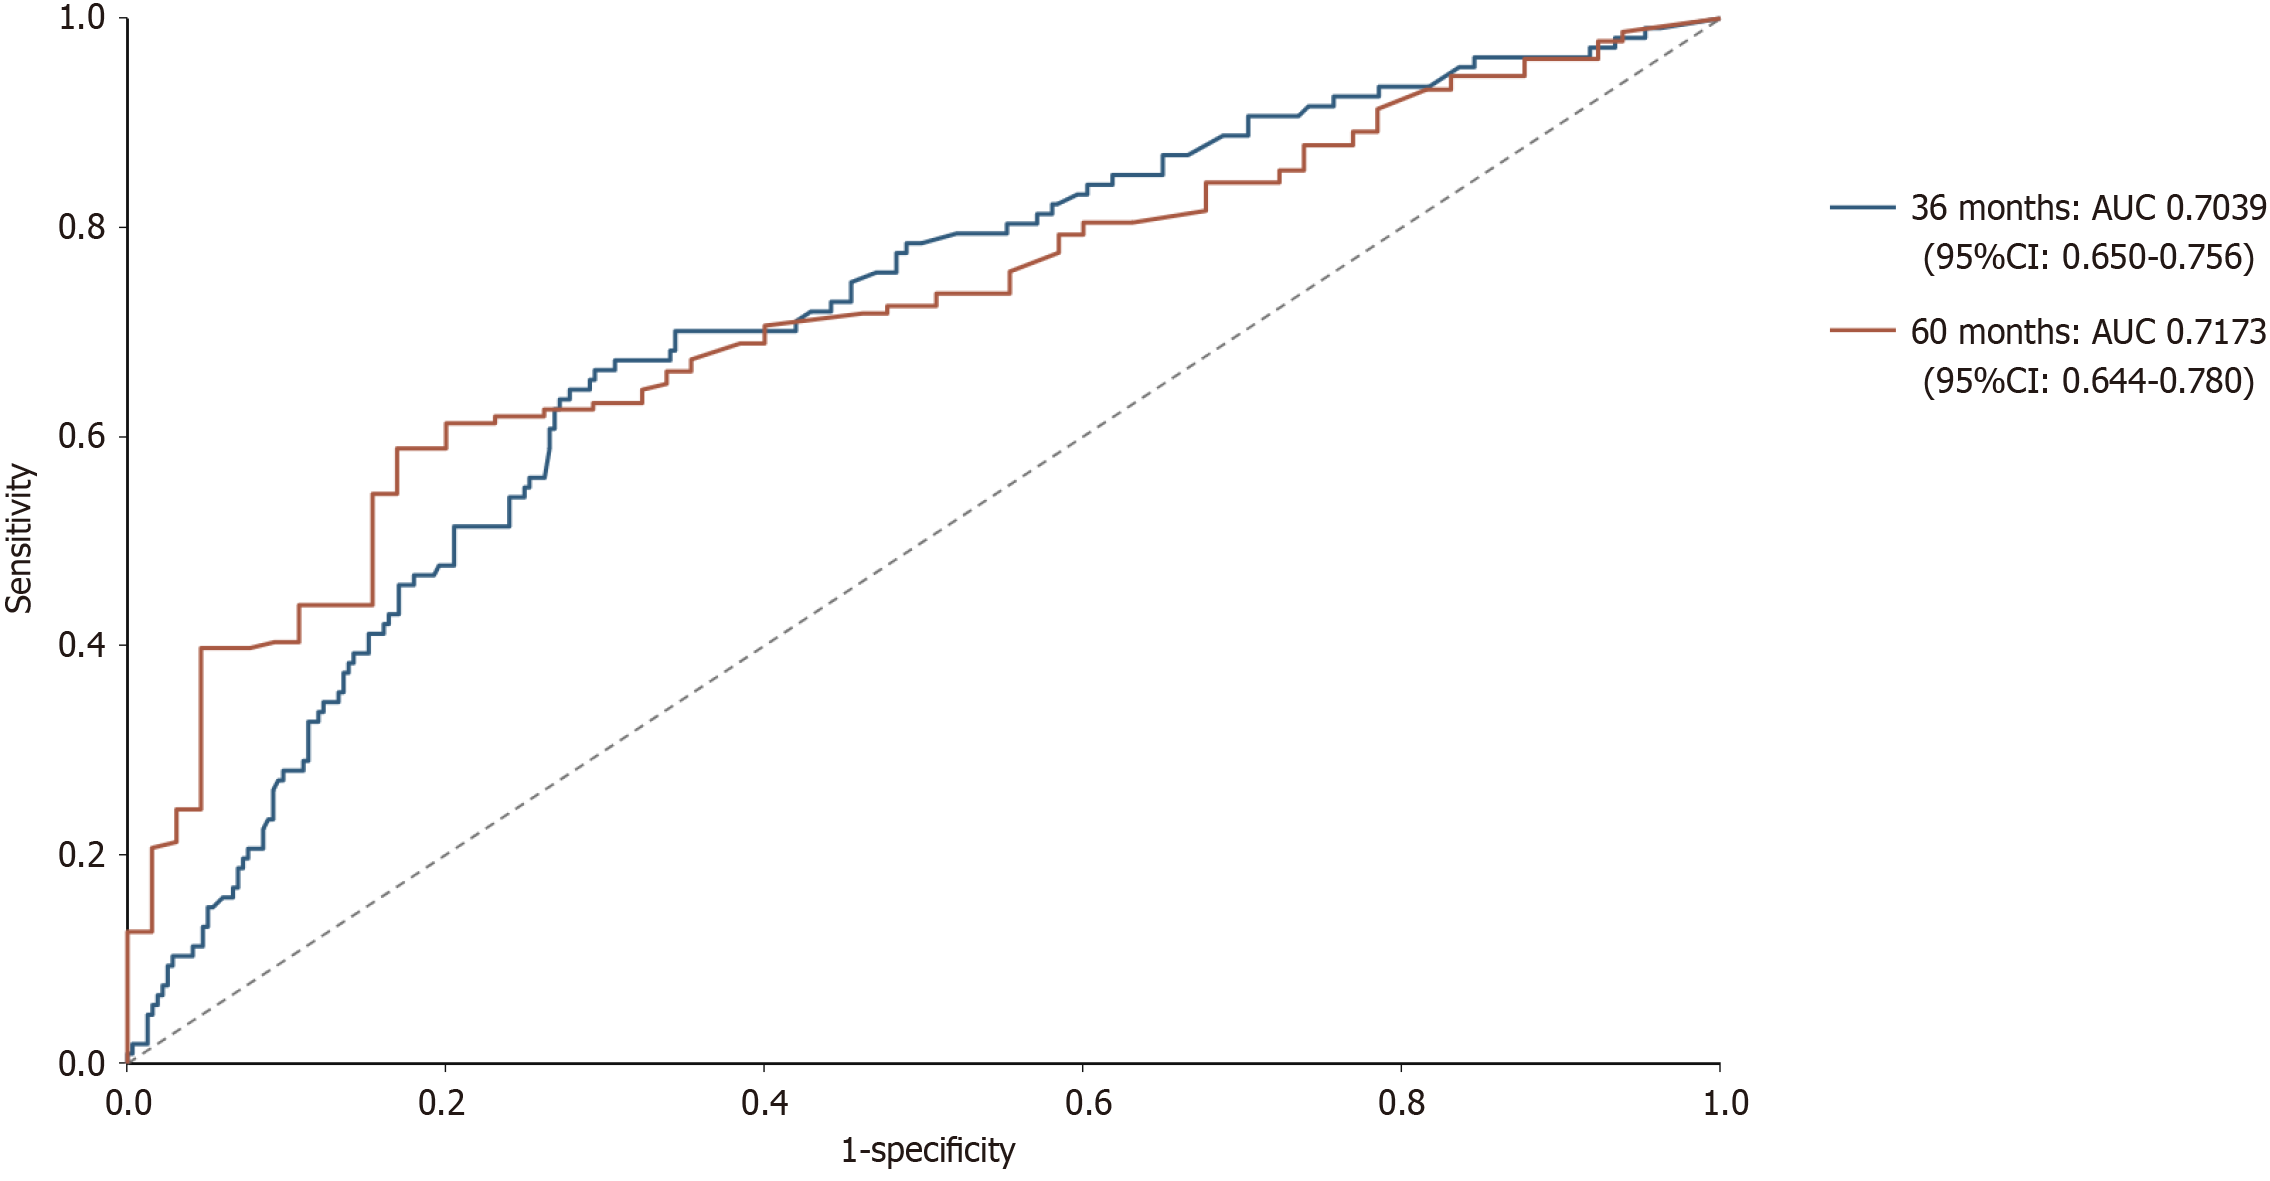
Figure 3 Apparent time-dependent receiver operating characteristic curves at 36 months and 60 months.
AUC: Area under the receiver operating characteristic curve; CI: Confidence interval.
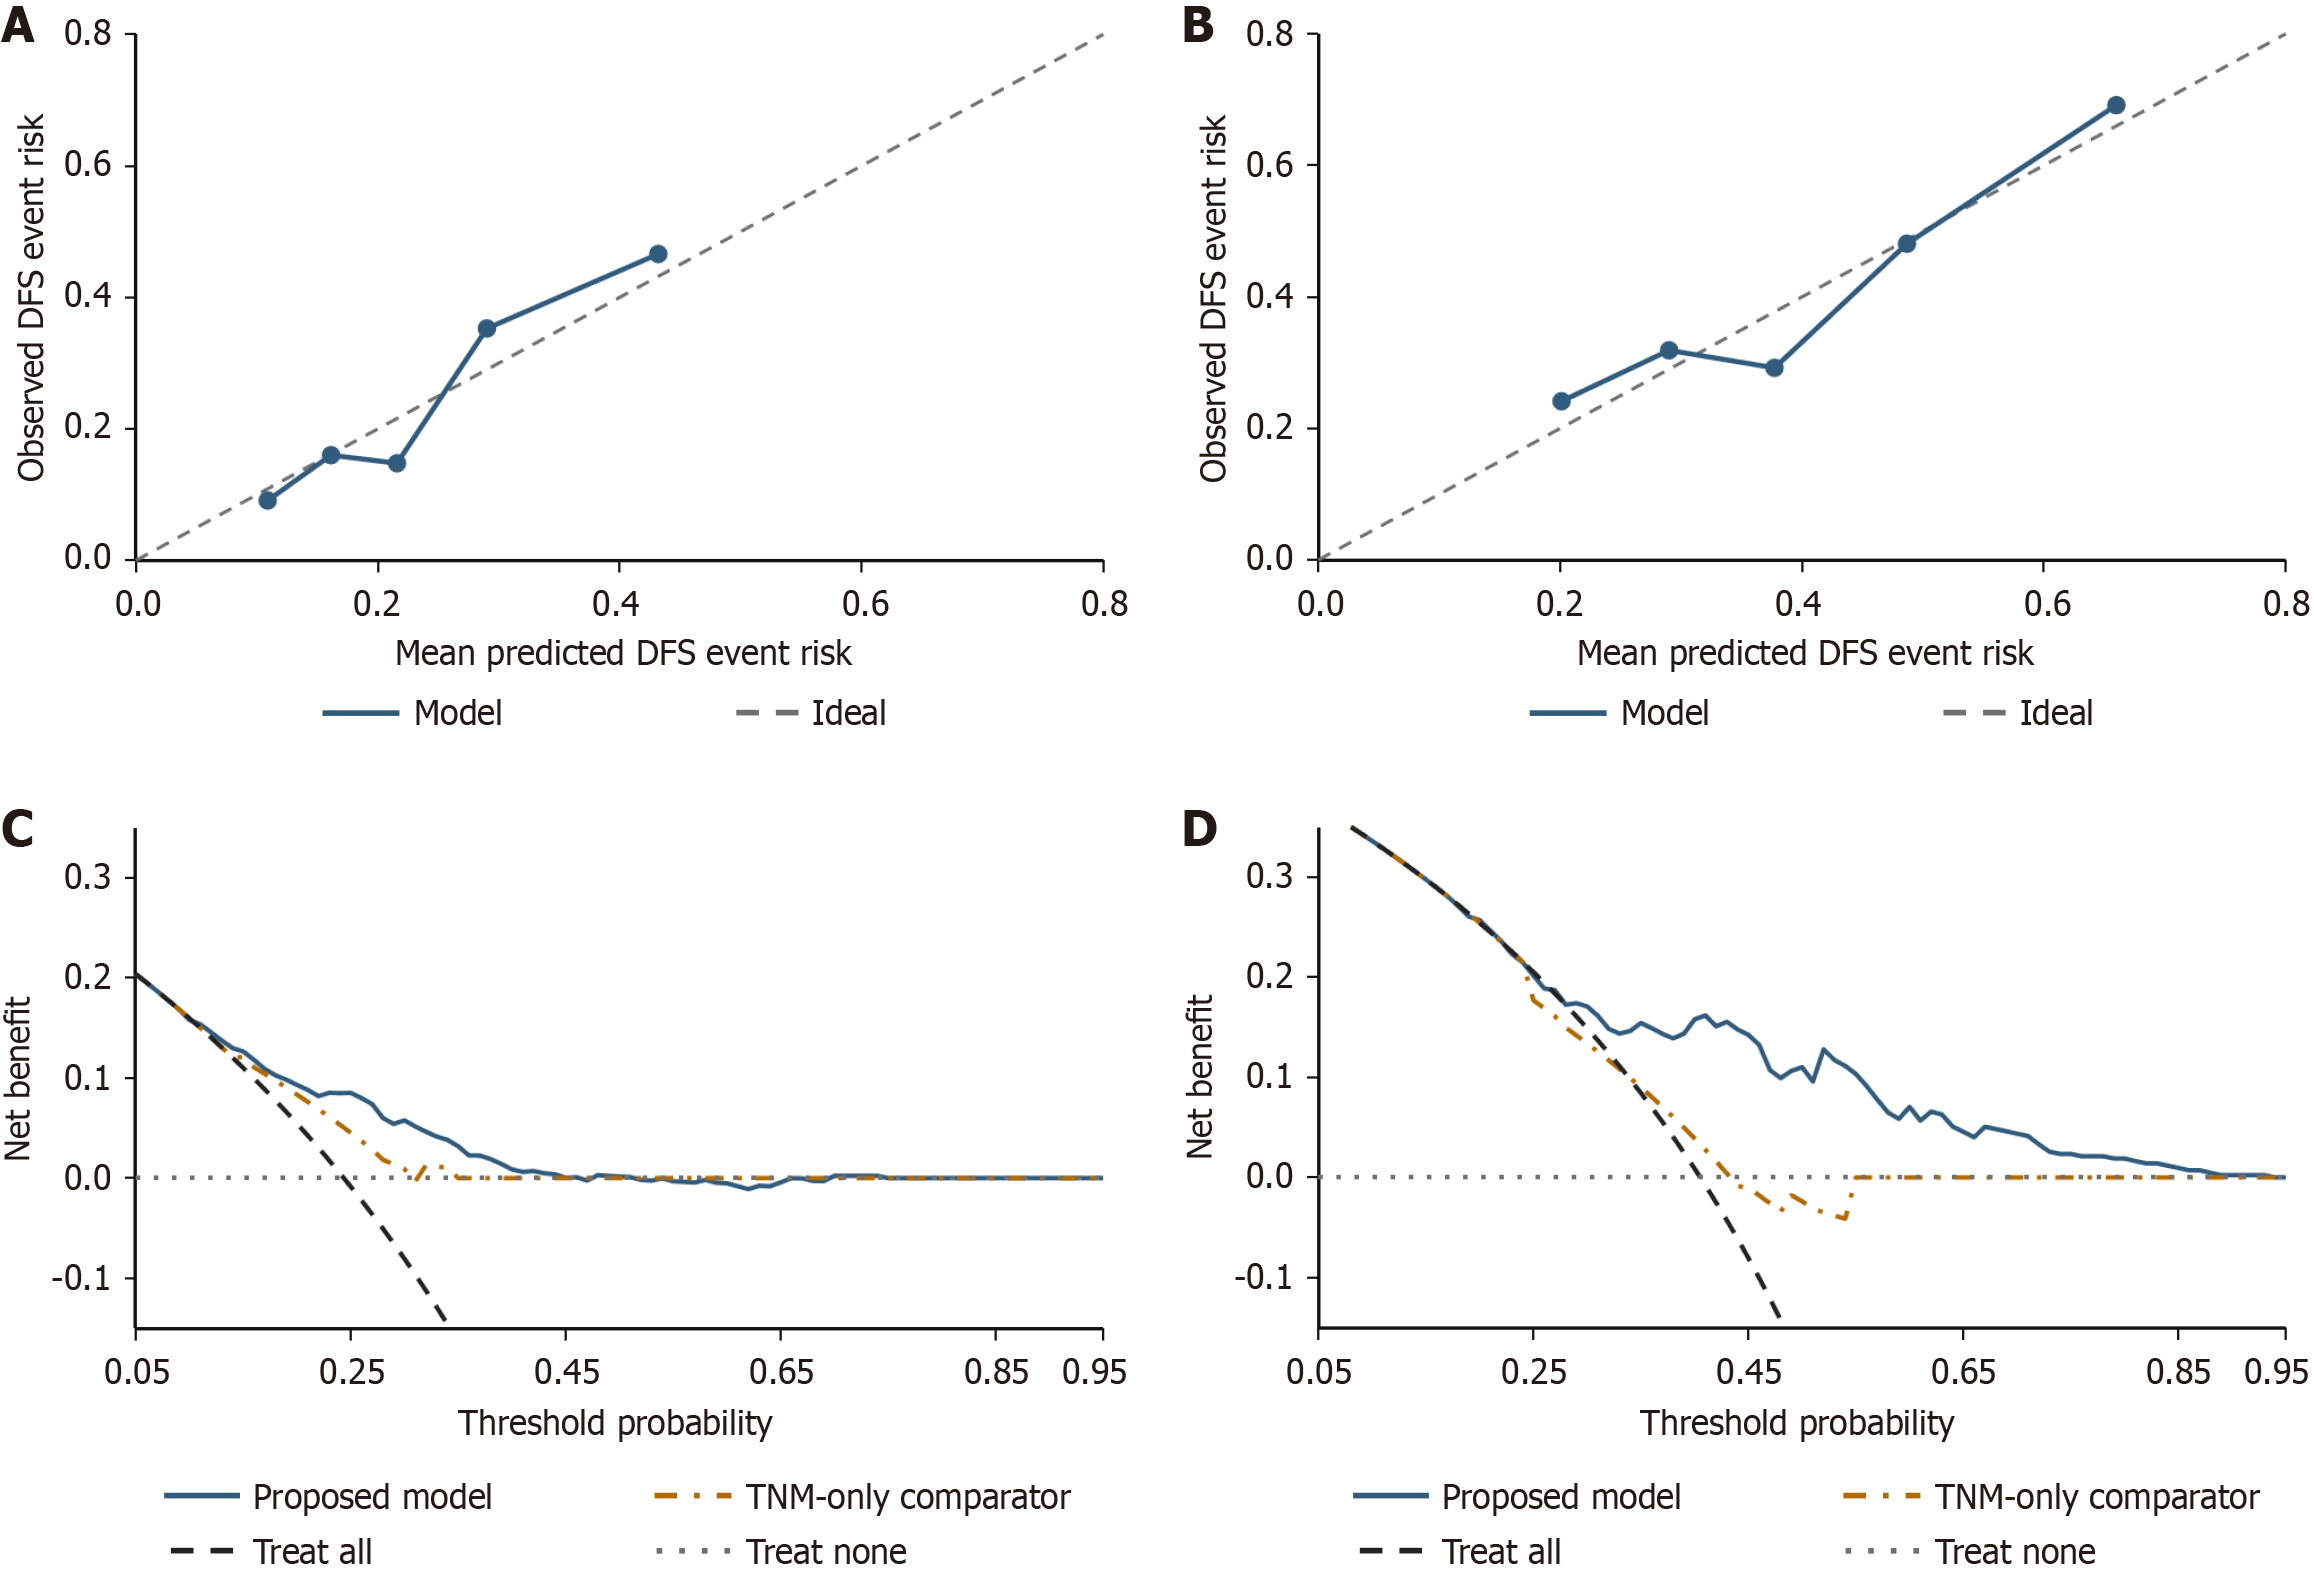
Figure 4 Apparent calibration and decision curves.
A: Calibration at 36 months; B: Calibration at 60 months. Predicted disease-free survival event risks are compared with observed risks by risk quintile, and dashed lines indicate ideal calibration; C: Decision-curve analysis at 36 months; D: Decision-curve analysis at 60 months. Decision curves compare the proposed model, the TNM-only comparator, and treat-all and treat-none strategies. The TNM-only comparator includes pathological T4 subtype and pN stage. DFS: Disease-free survival.
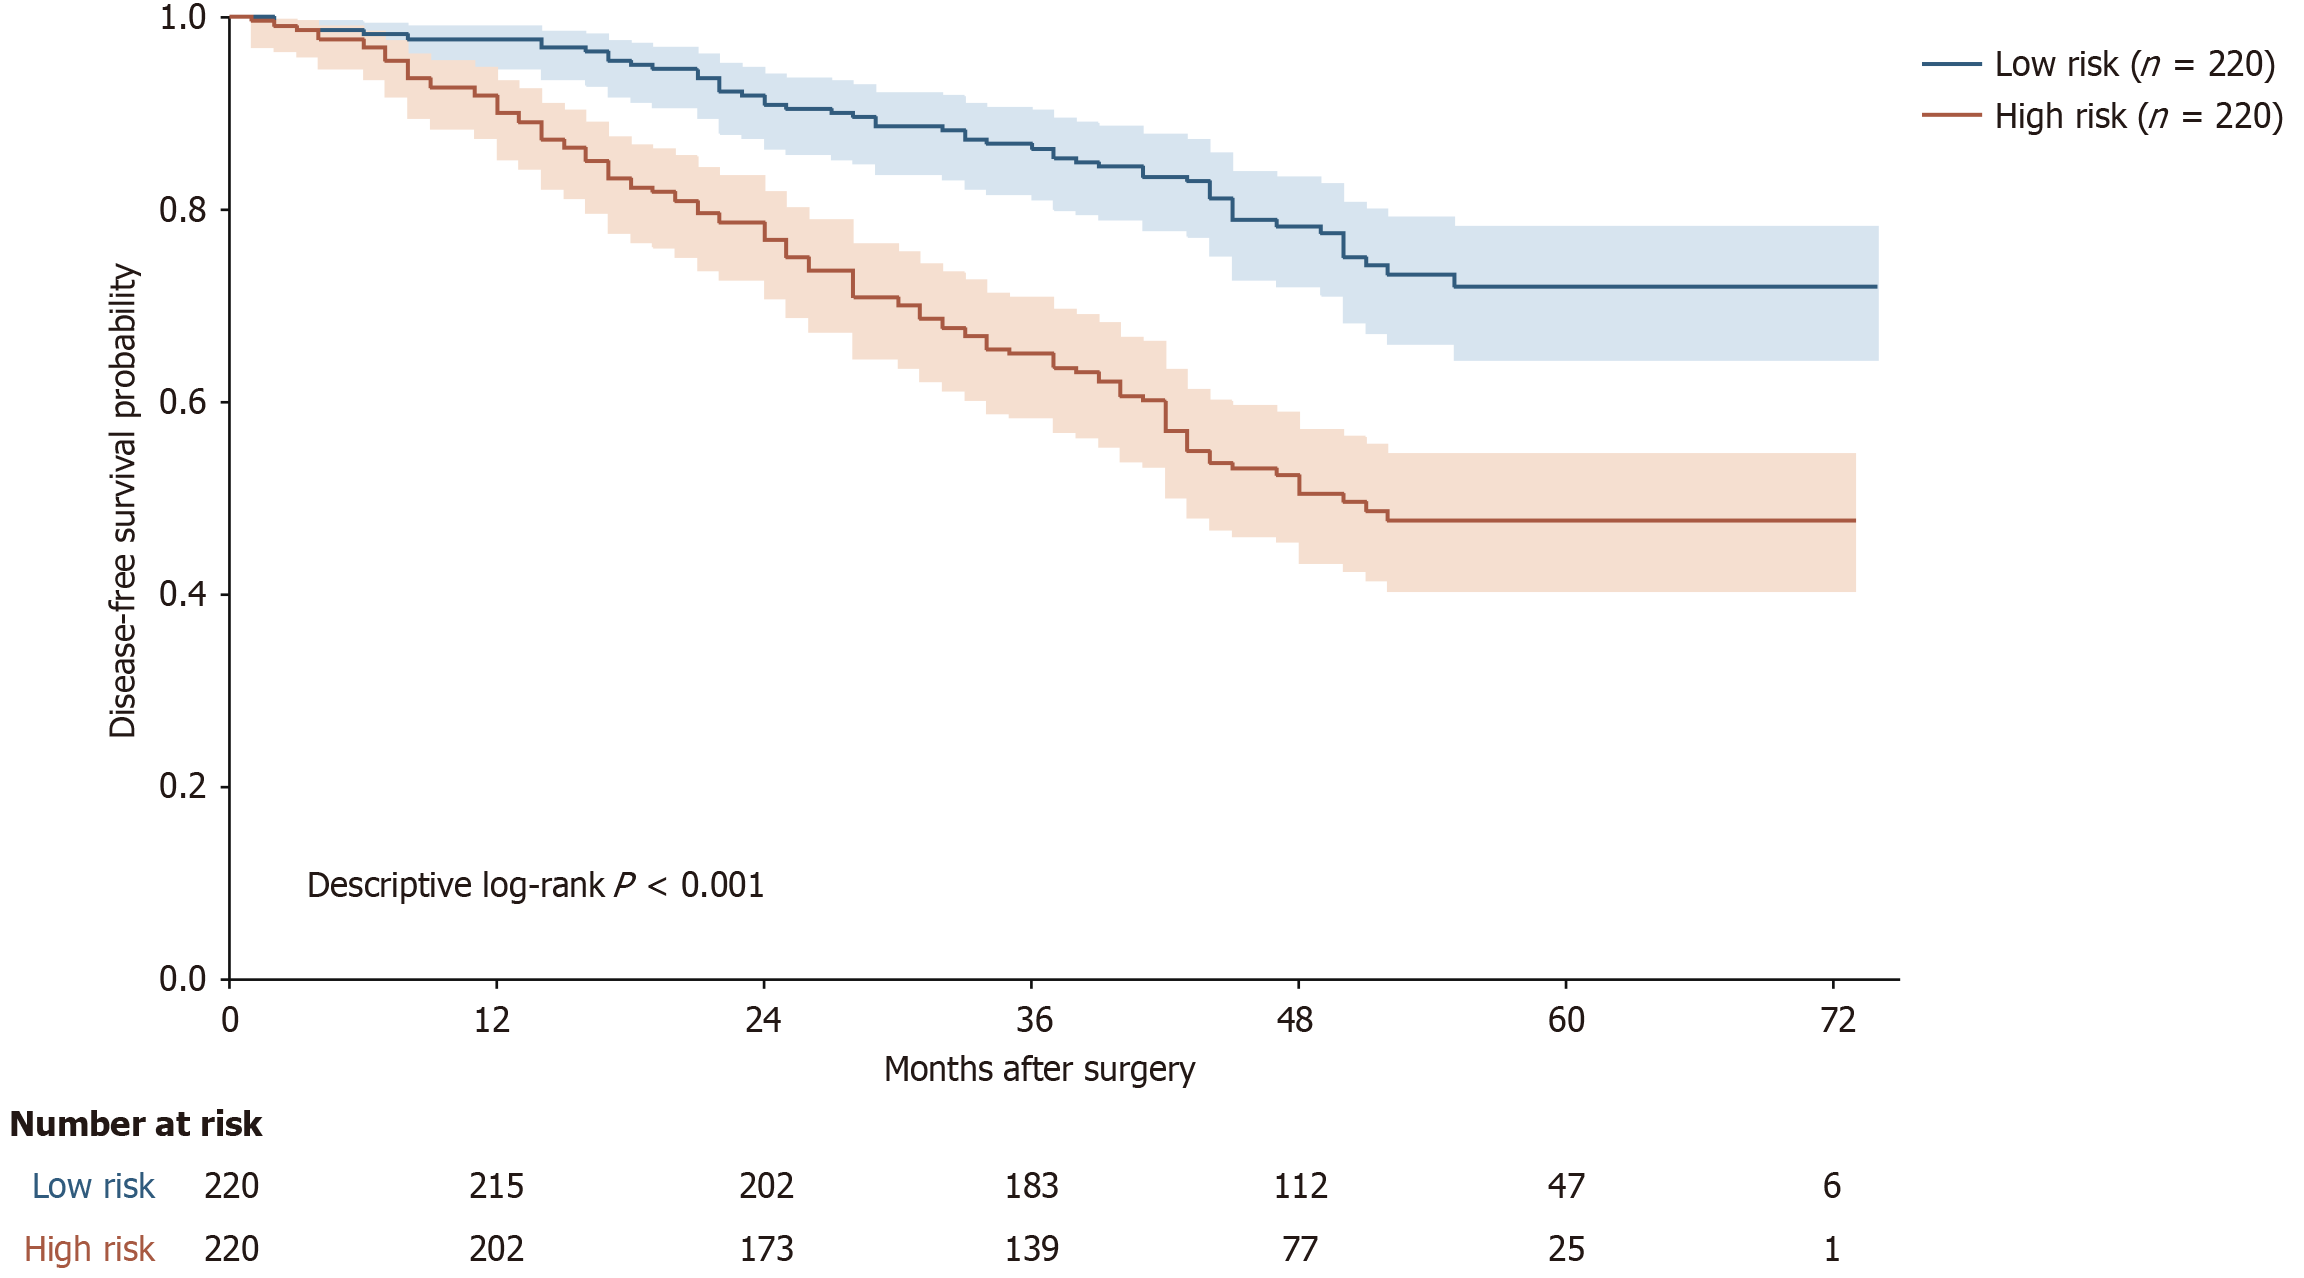
Figure 5 Kaplan-Meier disease-free survival curves for groups defined by the median centered linear predictor.
Shading indicates pointwise 95% confidence intervals.
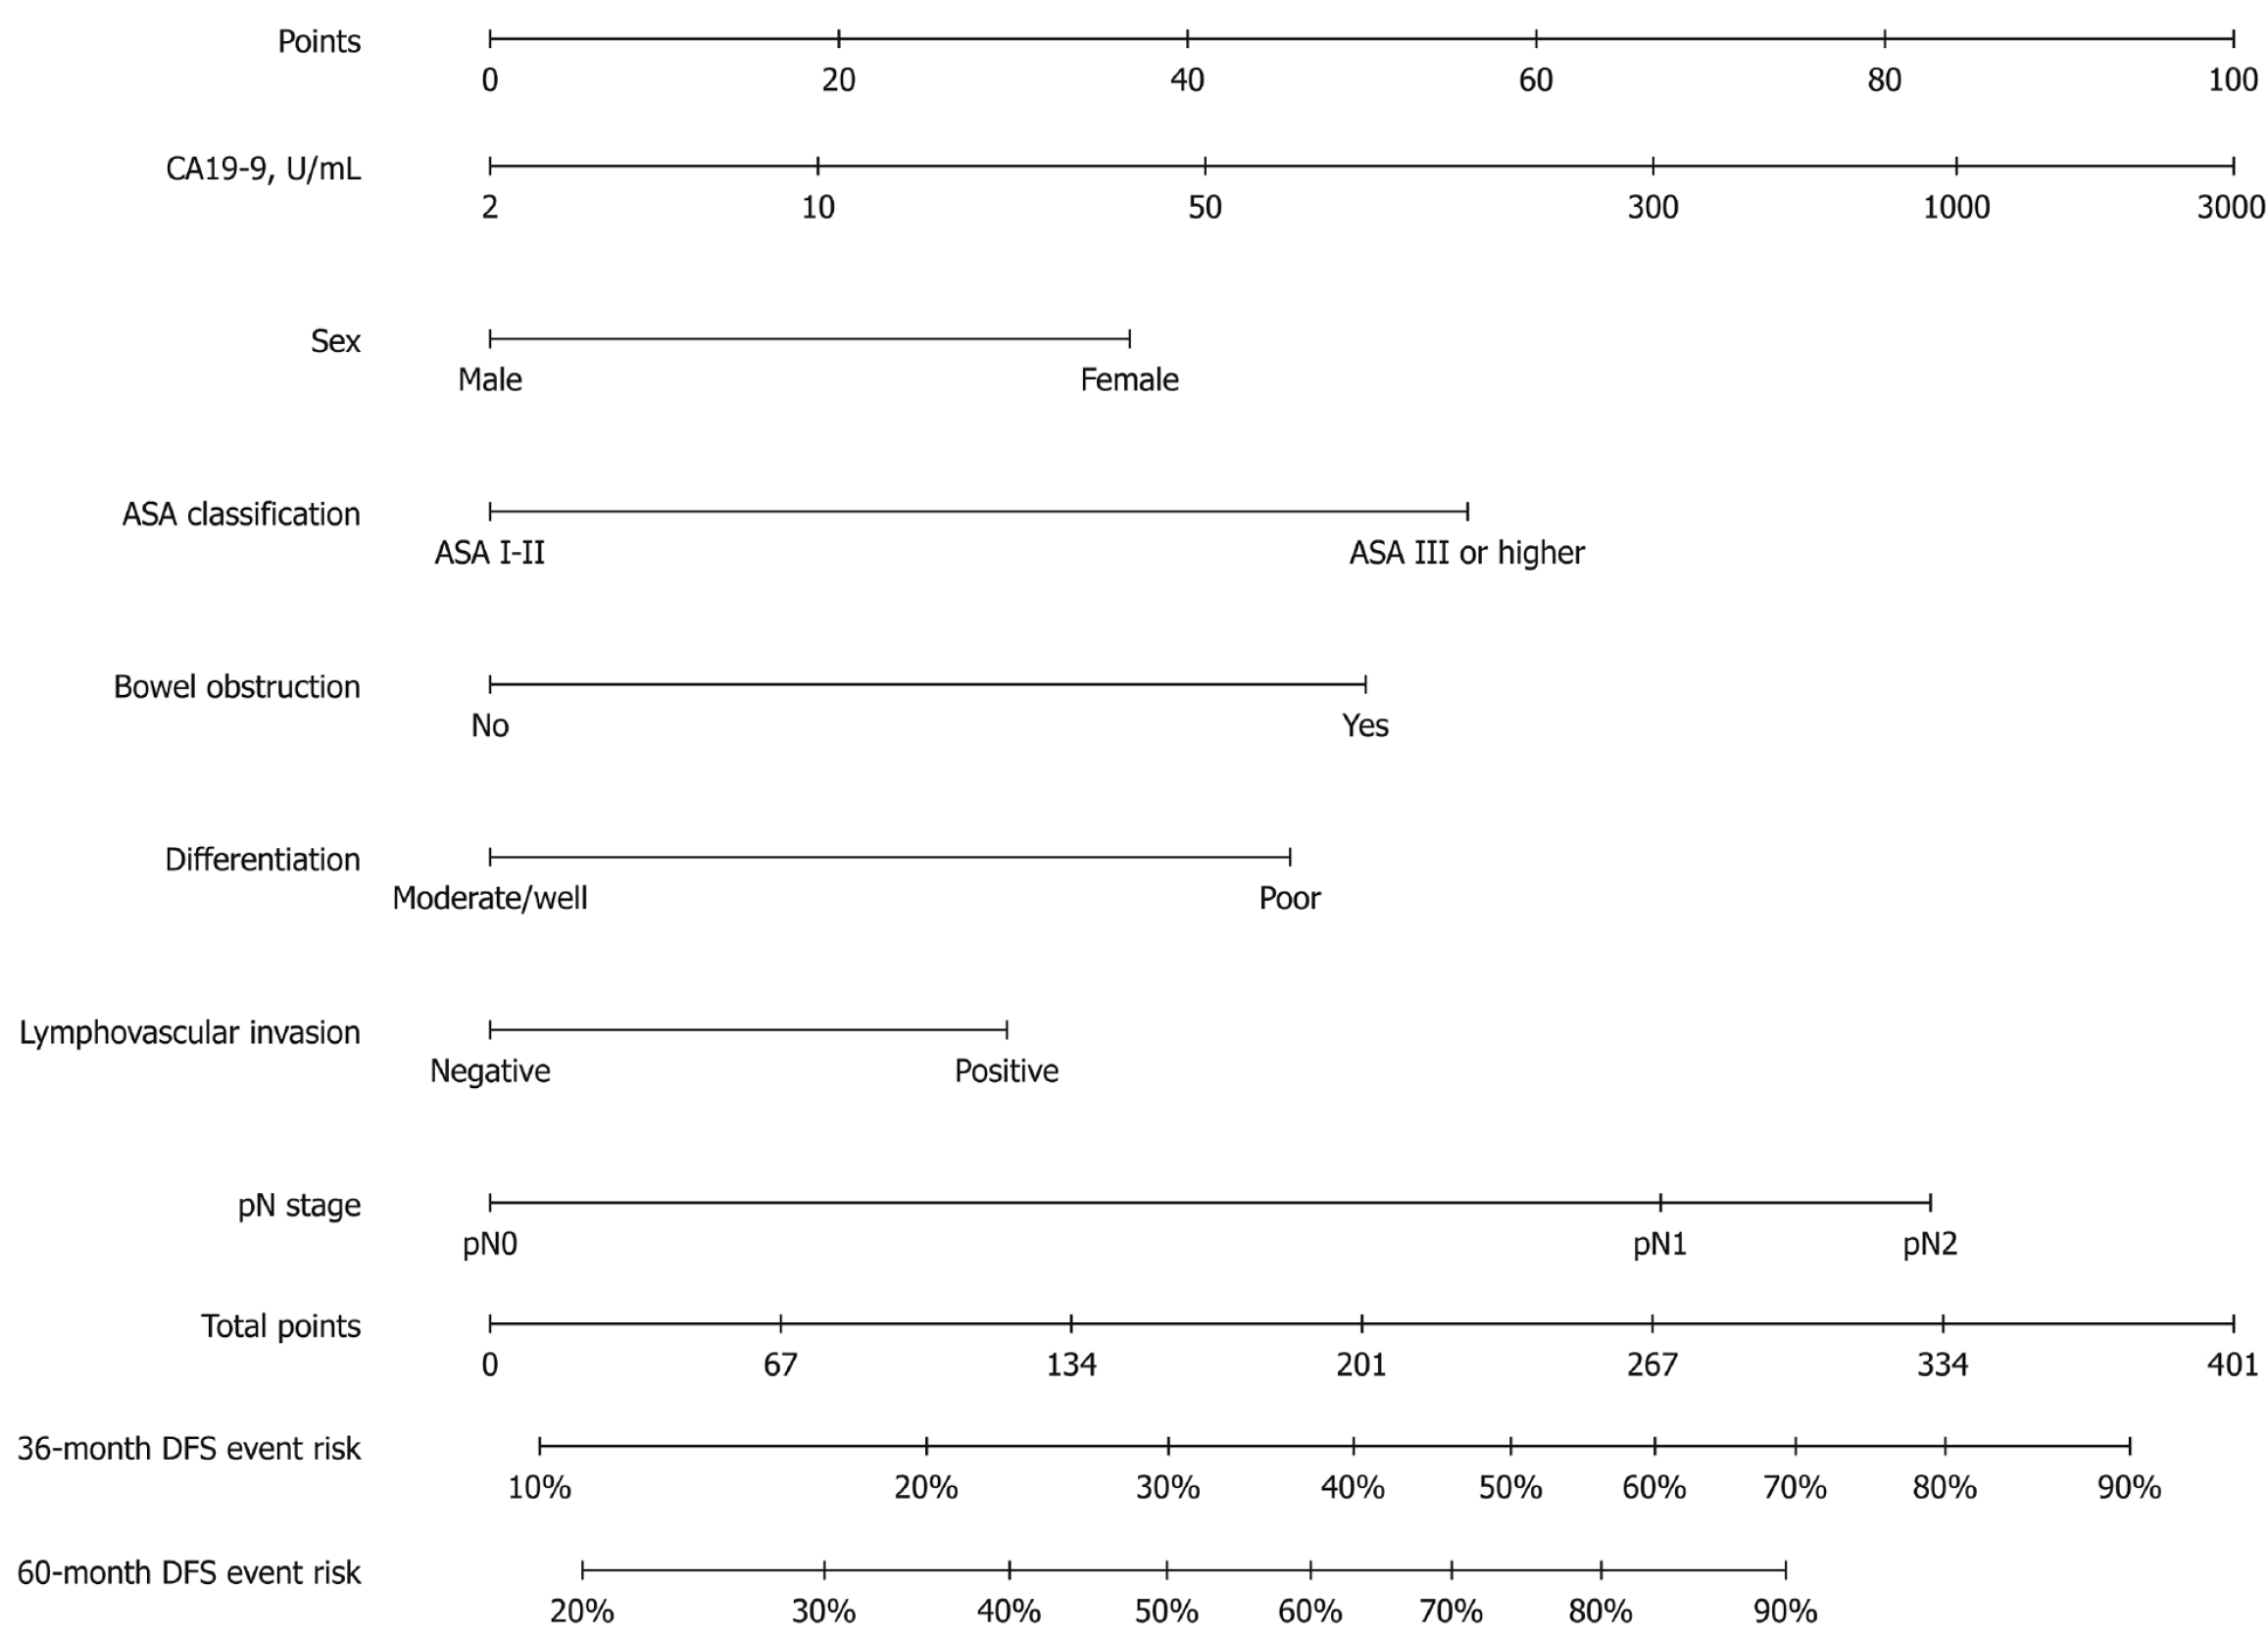
Figure 6 Nomogram for 36-month and 60-month disease-free survival event risk.
Total predictor points are mapped to the 36-month and 60-month disease-free survival event-risk axes. The nomogram represents all eight regression terms across seven clinical-variable axes; pN stage is encoded by separate pN1 and pN2 indicator terms, with pN0 as the reference. DFS: Disease-free survival; ASA: American Society of Anesthesiologists; CA19-9: Carbohydrate antigen 19-9.
- Citation: Zeng QY, Wu XL, Hang QR, Chen RP, Wang GQ. Development and internal validation of a disease-free survival model after radical resection of pathological T4 colorectal adenocarcinoma. World J Clin Oncol 2026; 17(11): 125117
- URL: https://www.wjgnet.com/2218-4333/full/v17/i11/125117.htm
- DOI: https://dx.doi.org/10.5306/wjco.125117