
















Copyright: ©Author(s) 2026.
World J Clin Oncol. Nov 24, 2026; 17(11): 125117
Published online Nov 24, 2026. doi: 10.5306/wjco.125117
Published online Nov 24, 2026. doi: 10.5306/wjco.125117
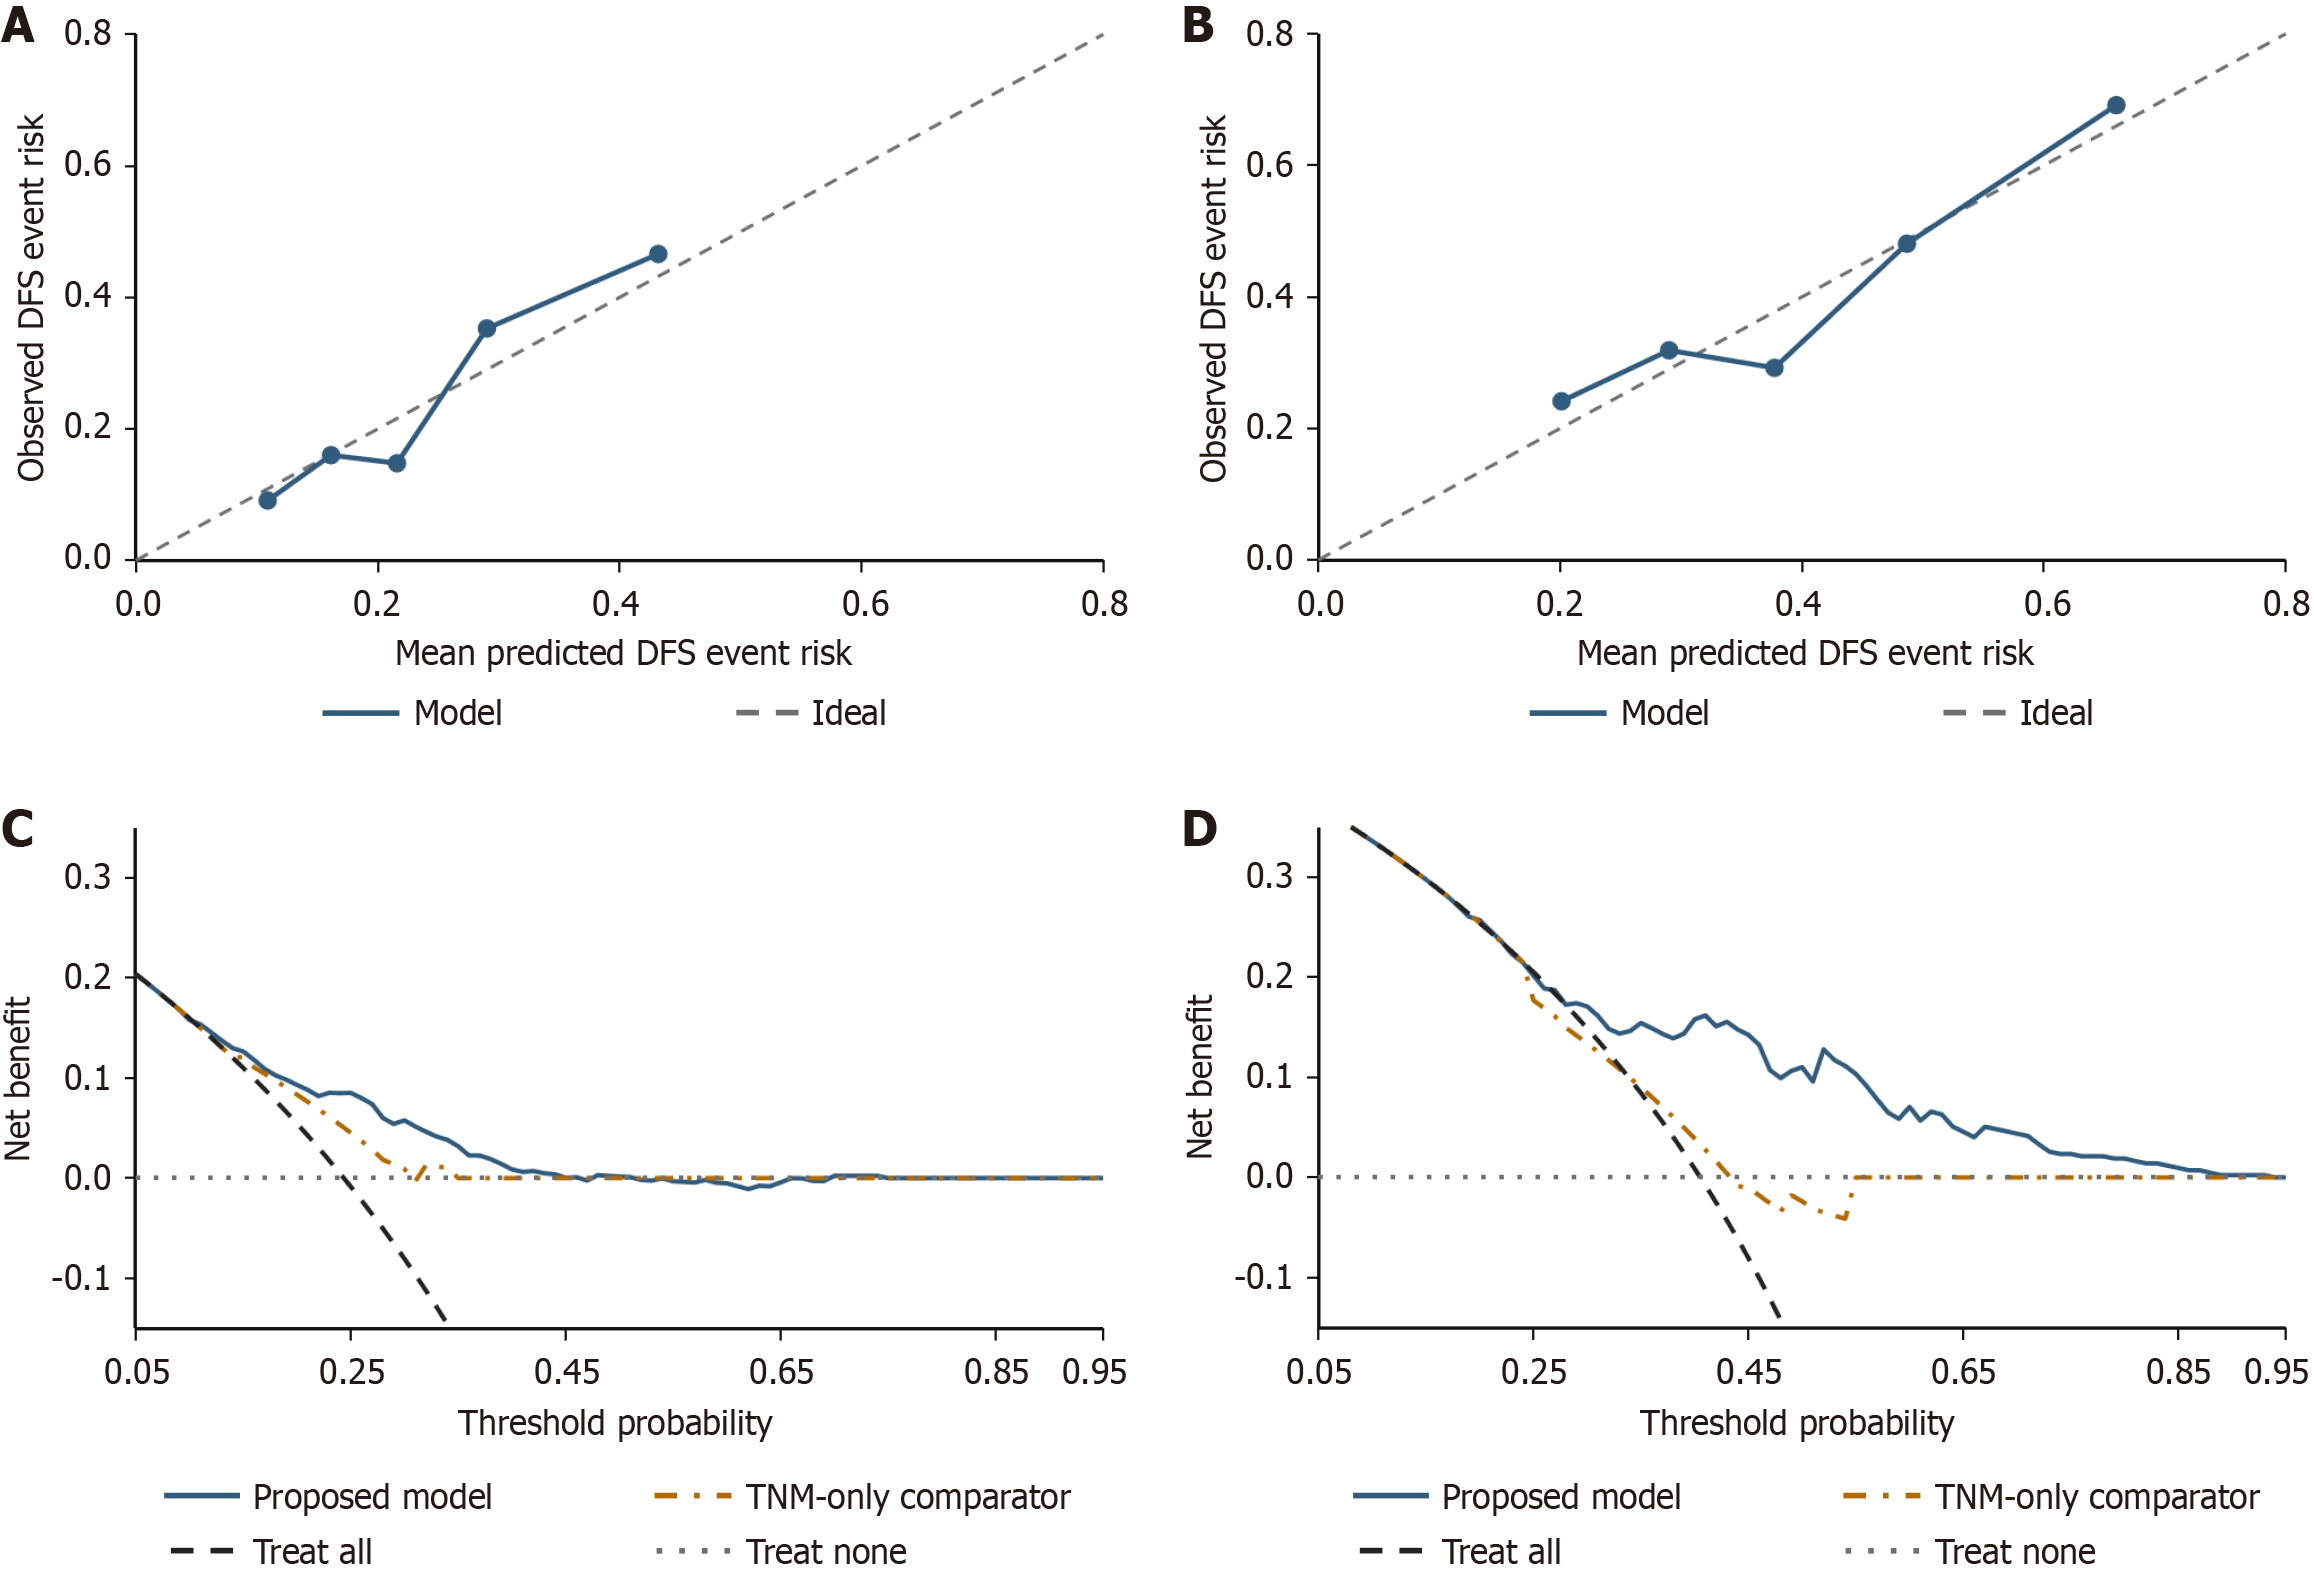
Figure 4 Apparent calibration and decision curves.
A: Calibration at 36 months; B: Calibration at 60 months. Predicted disease-free survival event risks are compared with observed risks by risk quintile, and dashed lines indicate ideal calibration; C: Decision-curve analysis at 36 months; D: Decision-curve analysis at 60 months. Decision curves compare the proposed model, the TNM-only comparator, and treat-all and treat-none strategies. The TNM-only comparator includes pathological T4 subtype and pN stage. DFS: Disease-free survival.
- Citation: Zeng QY, Wu XL, Hang QR, Chen RP, Wang GQ. Development and internal validation of a disease-free survival model after radical resection of pathological T4 colorectal adenocarcinoma. World J Clin Oncol 2026; 17(11): 125117
- URL: https://www.wjgnet.com/2218-4333/full/v17/i11/125117.htm
- DOI: https://dx.doi.org/10.5306/wjco.125117