Copyright
©The Author(s) 2025.
World J Clin Oncol. Jun 24, 2025; 16(6): 108393
Published online Jun 24, 2025. doi: 10.5306/wjco.v16.i6.108393
Published online Jun 24, 2025. doi: 10.5306/wjco.v16.i6.108393
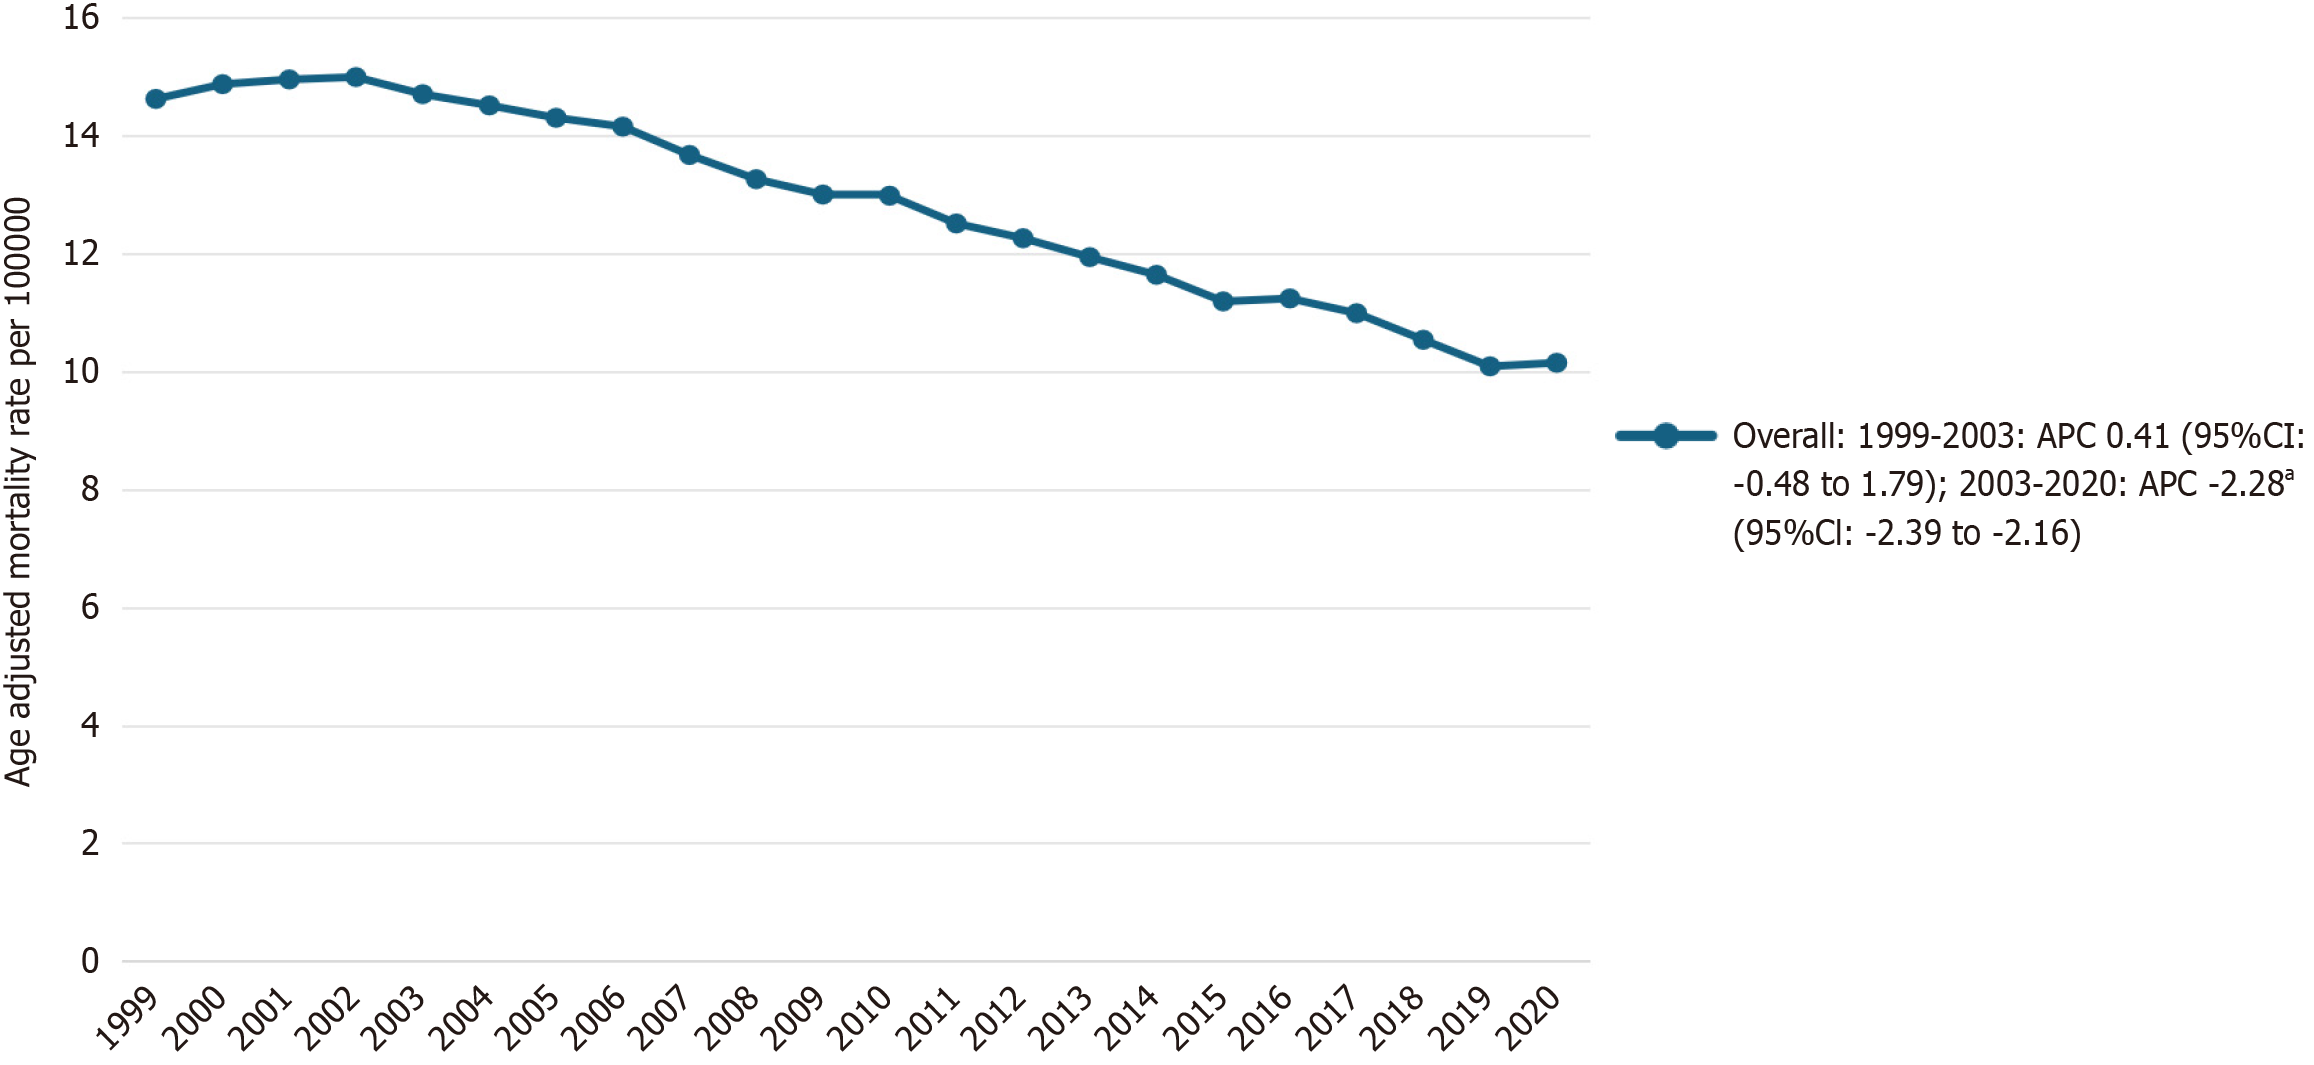
Figure 1 Overall ovarian carcinoma-related age-adjusted mortality rates per 100000 in the United States, 1999 to 2020.
aP value < 0.05, statistically significant annual percent change values. APC: Annual percent change; CI: Confidence interval.
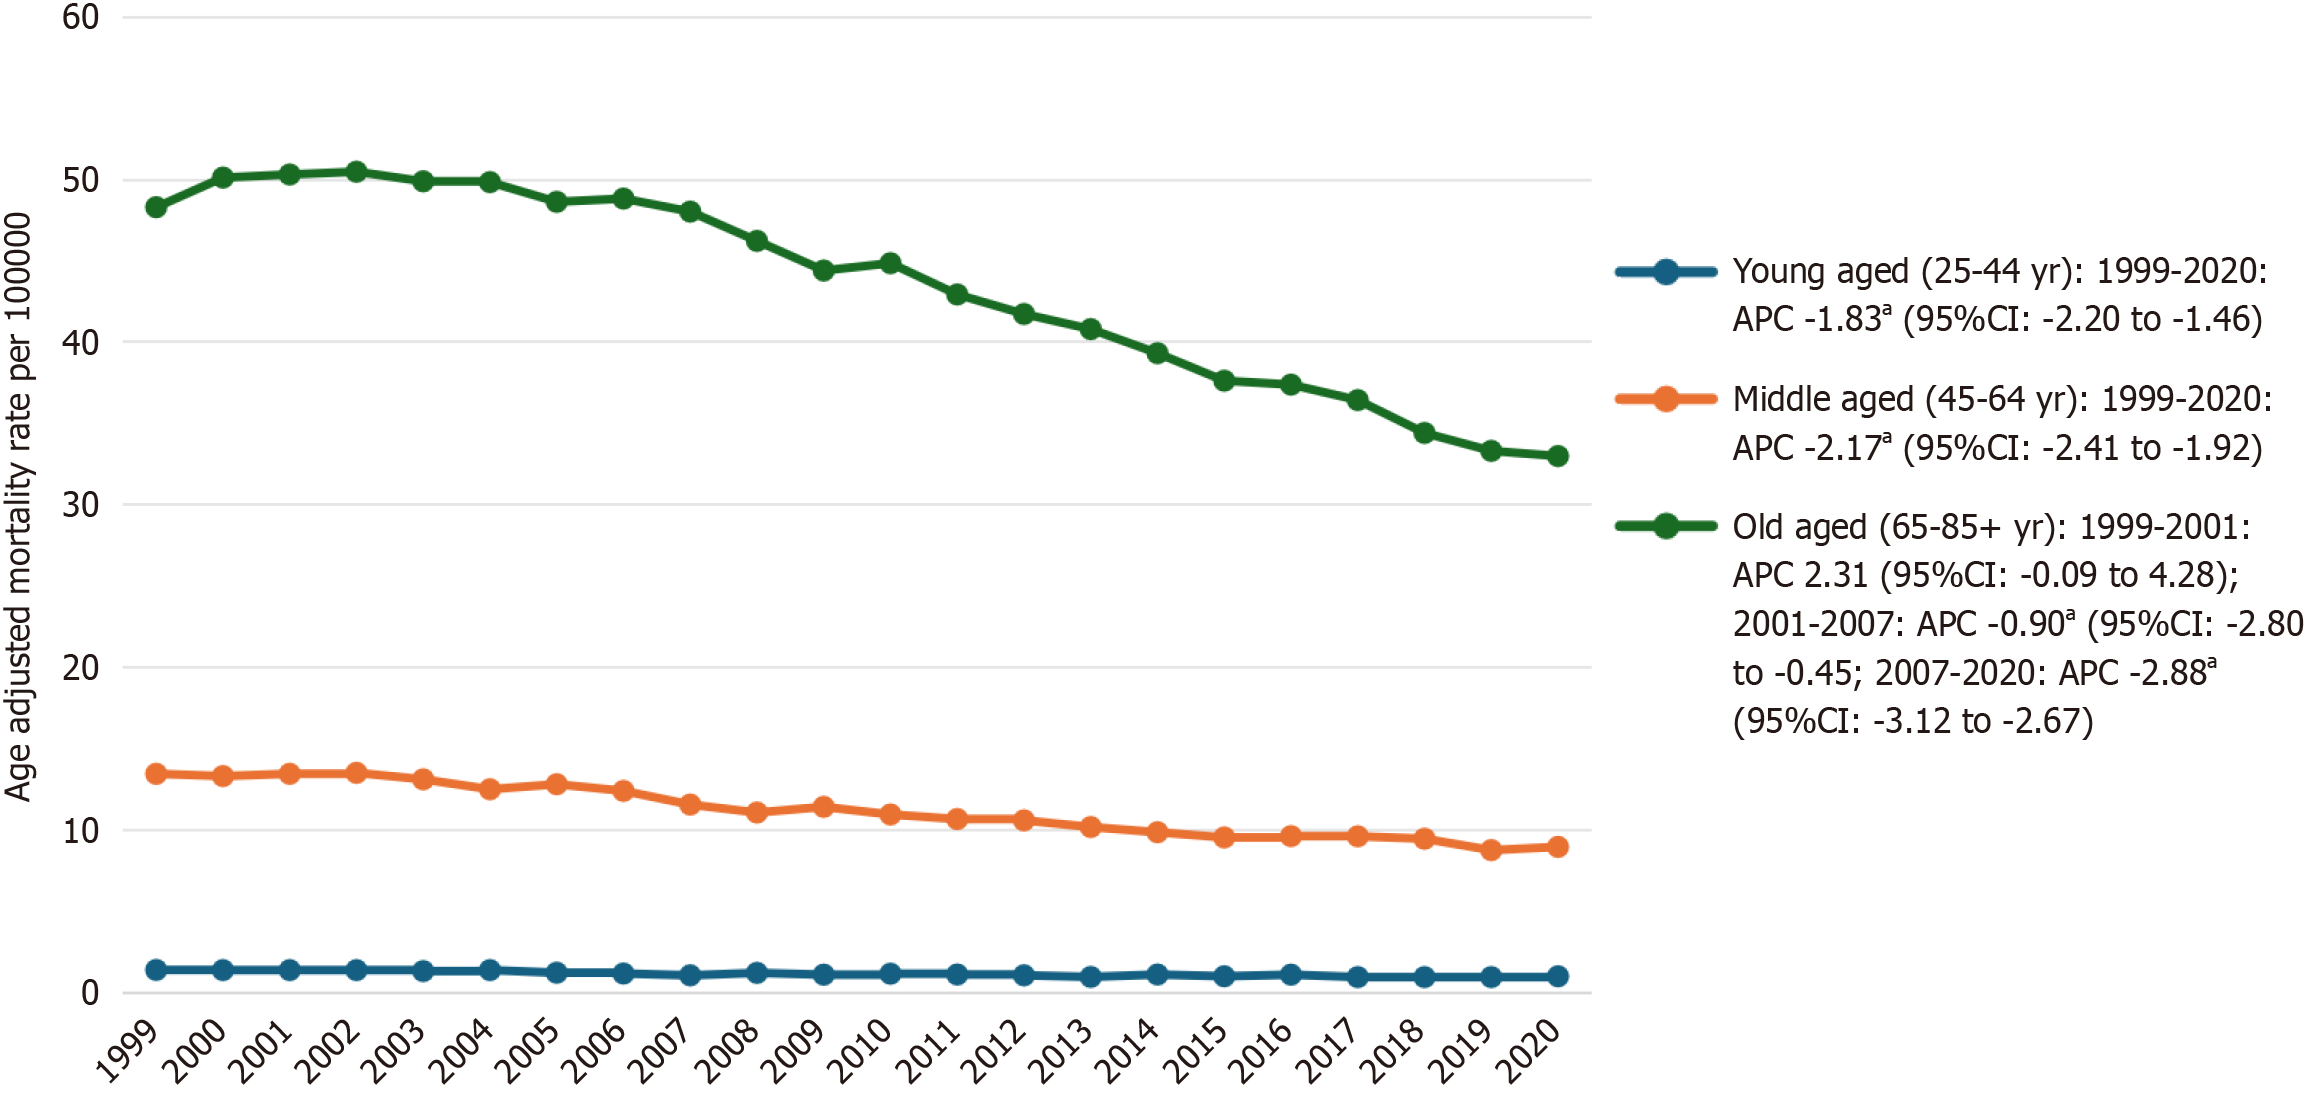
Figure 2 Ovarian carcinoma-related age-adjusted mortality rates per 1000000, stratified by age groups in the United States, 1999 to 2020.
aP value < 0.05, statistically significant annual percent change values. APC: Annual percent change; CI: Confidence interval.
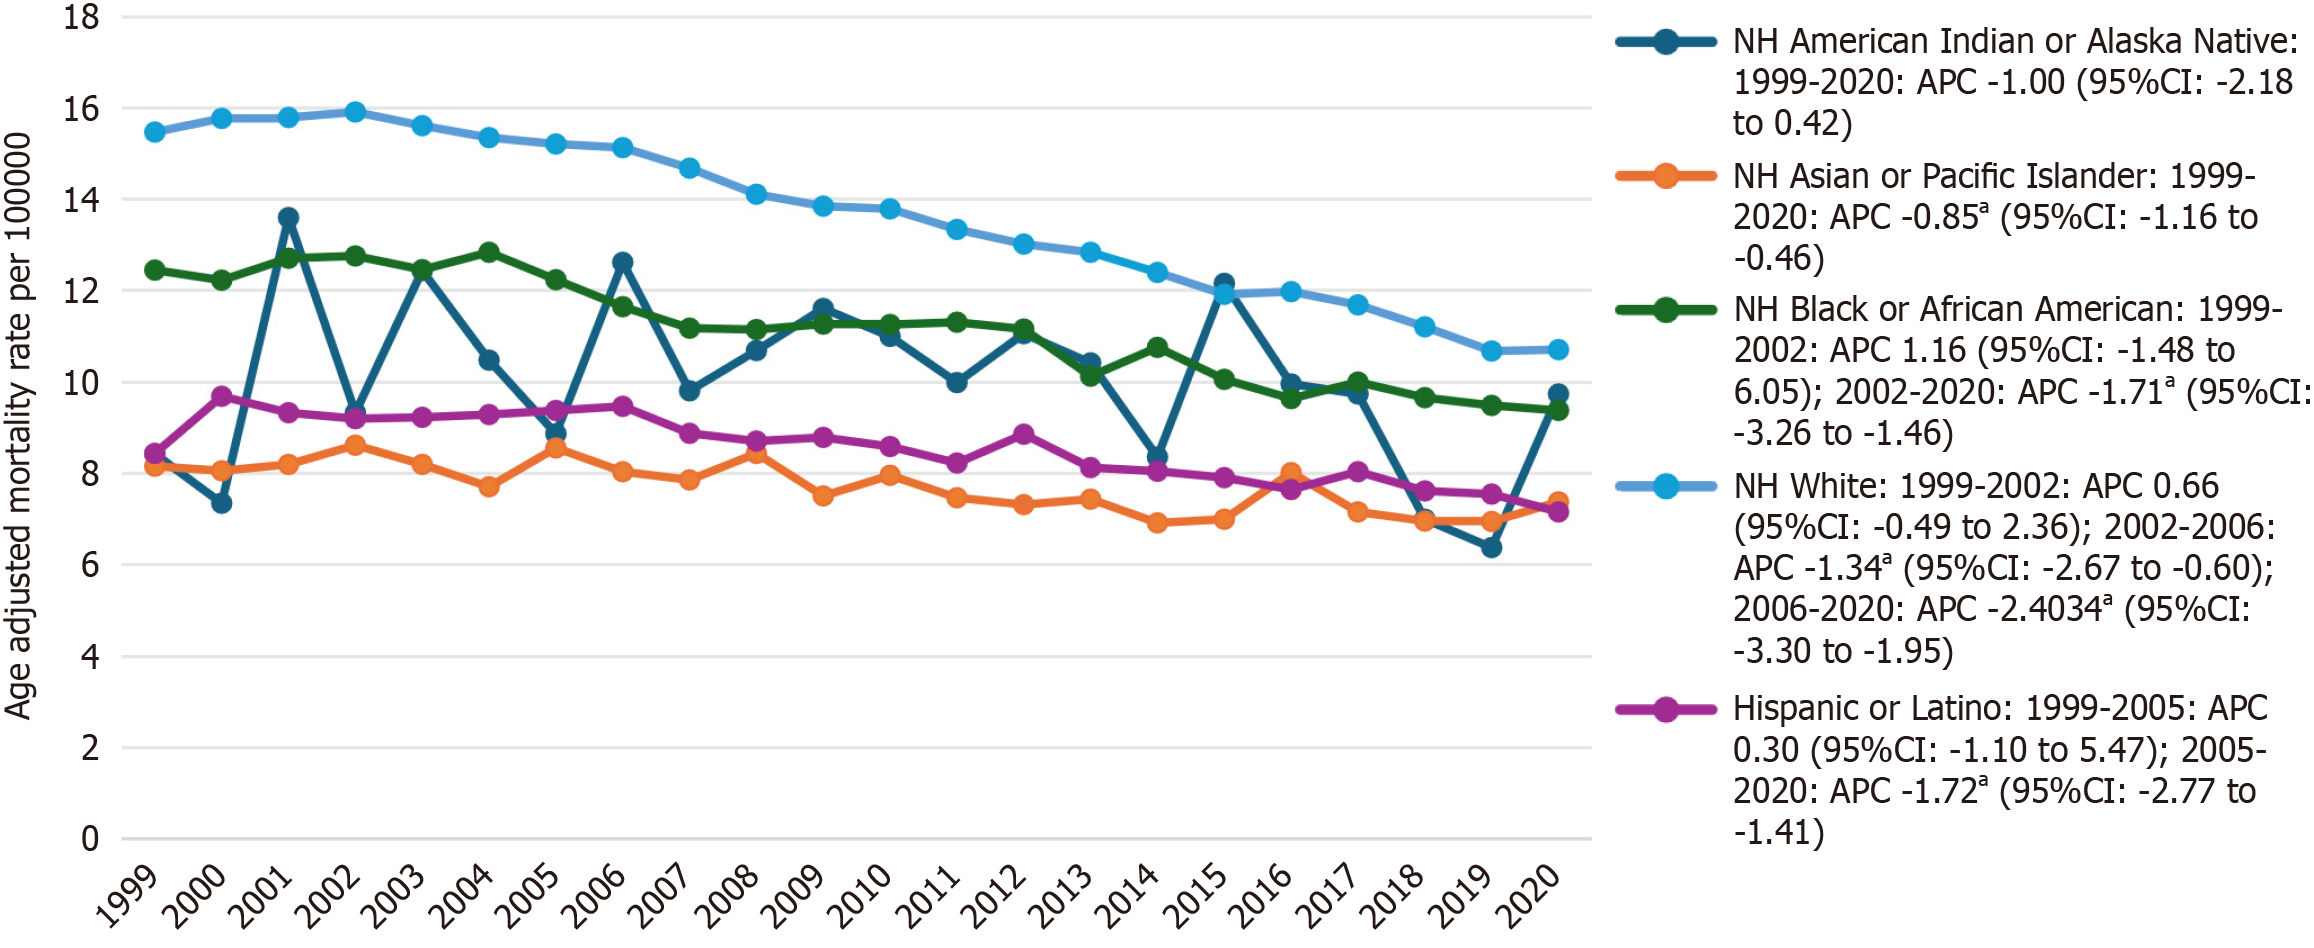
Figure 3 Ovarian carcinoma-related age-adjusted mortality rates per 100000, stratified by race in the United States, 1999 to 2020.
aP value < 0.05, statistically significant annual percent change values. NH: Non-Hispanic; APC: Annual percent change; CI: Confidence interval.
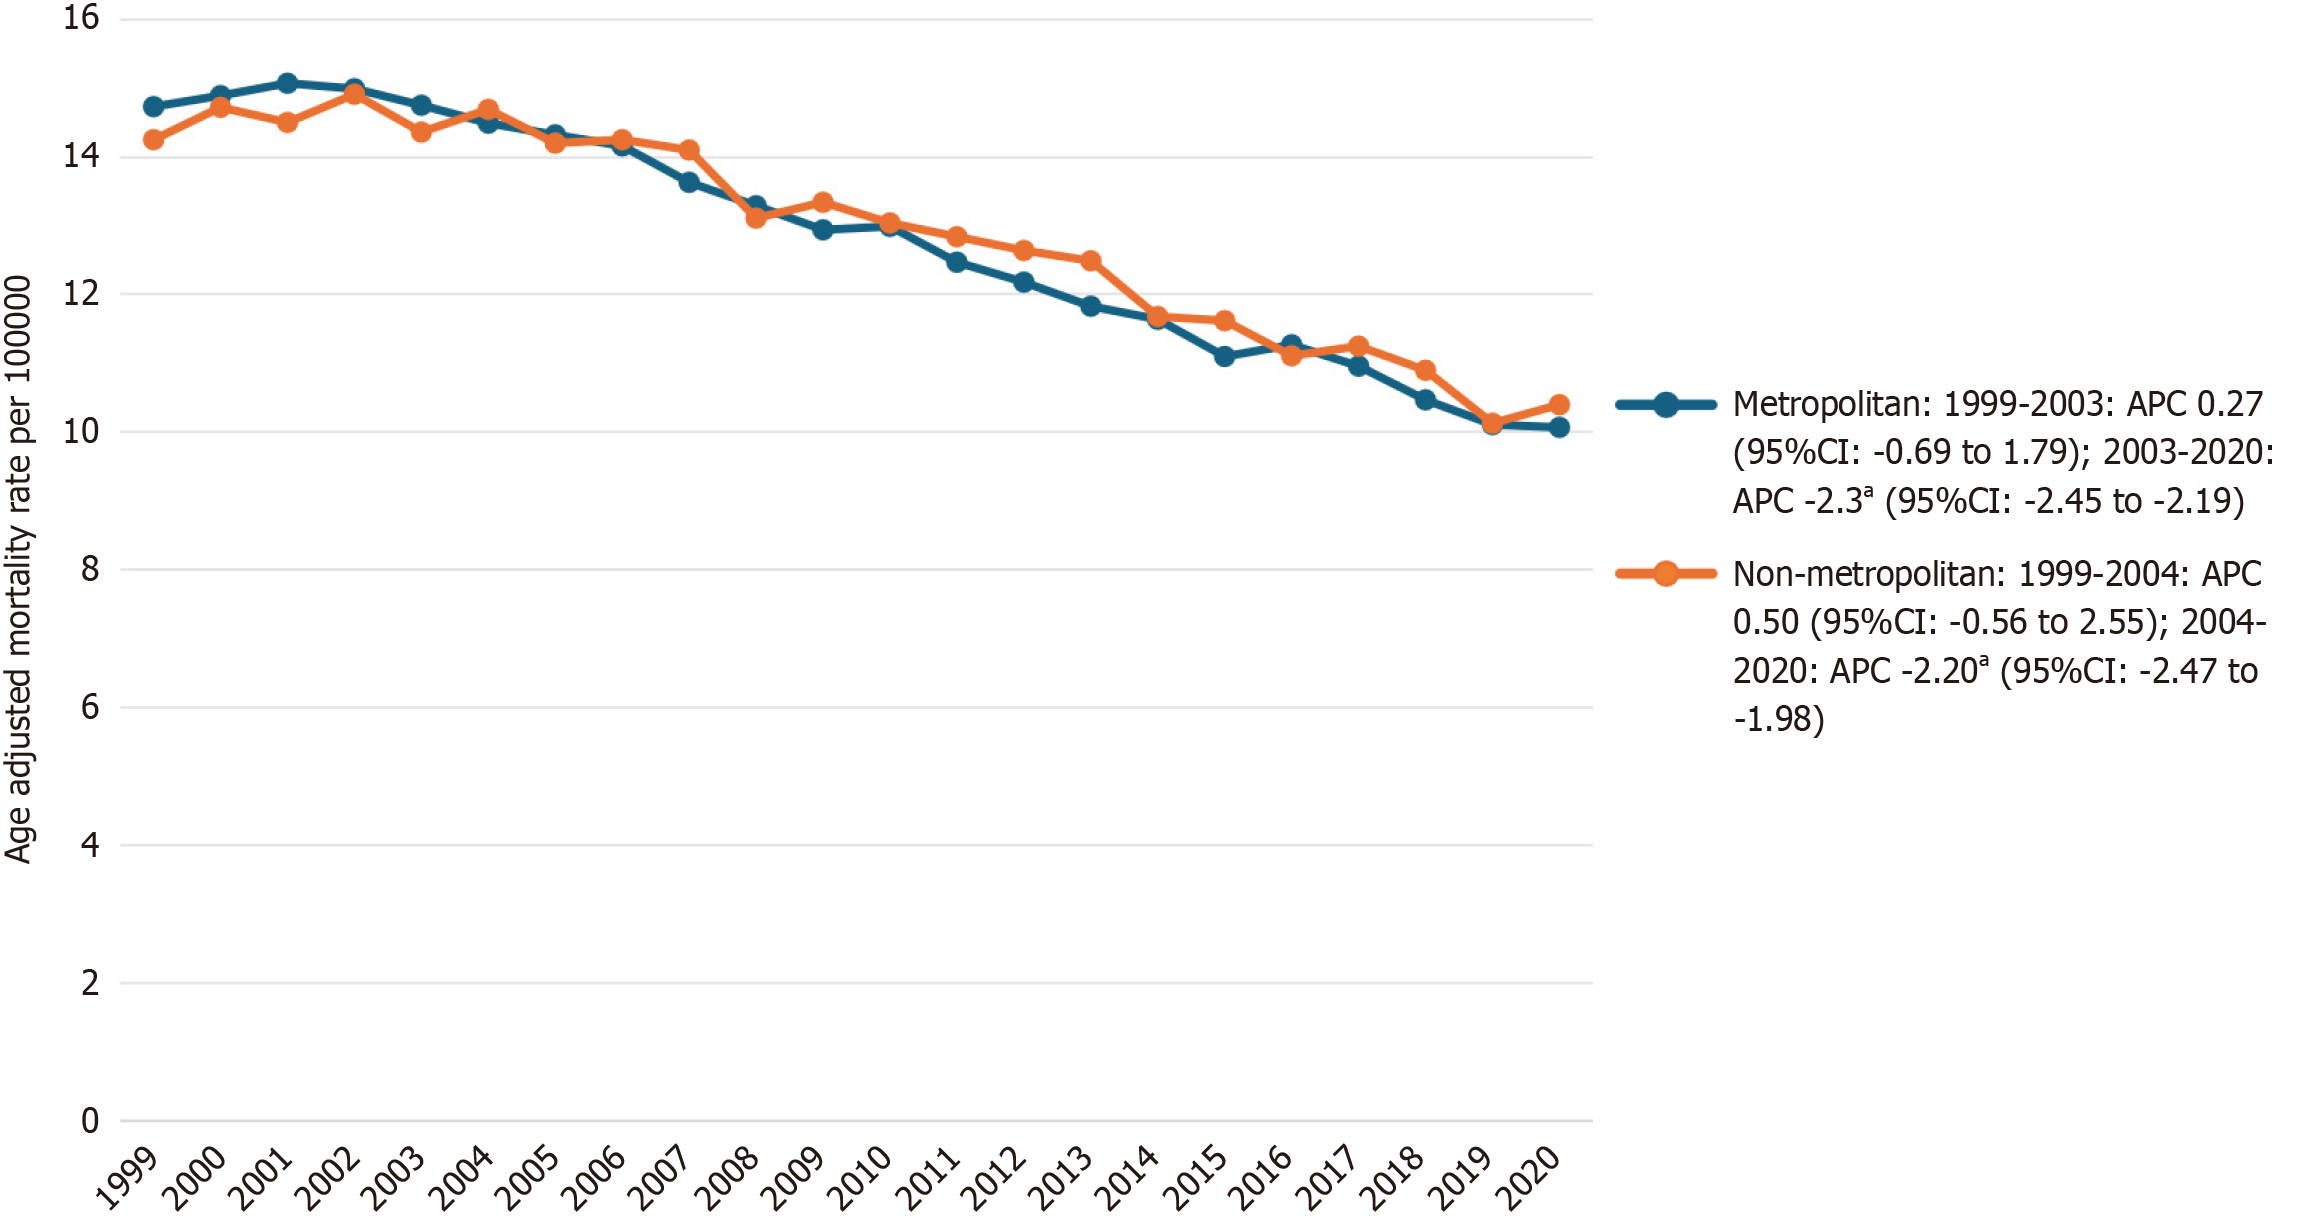
Figure 4 Ovarian carcinoma-related age-adjusted mortality rates per 1000000, stratified by urbanization group in the United States, 1999 to 2020.
aP value < 0.05, statistically significant annual percent change values. APC: Annual percent change; CI: Confidence interval.
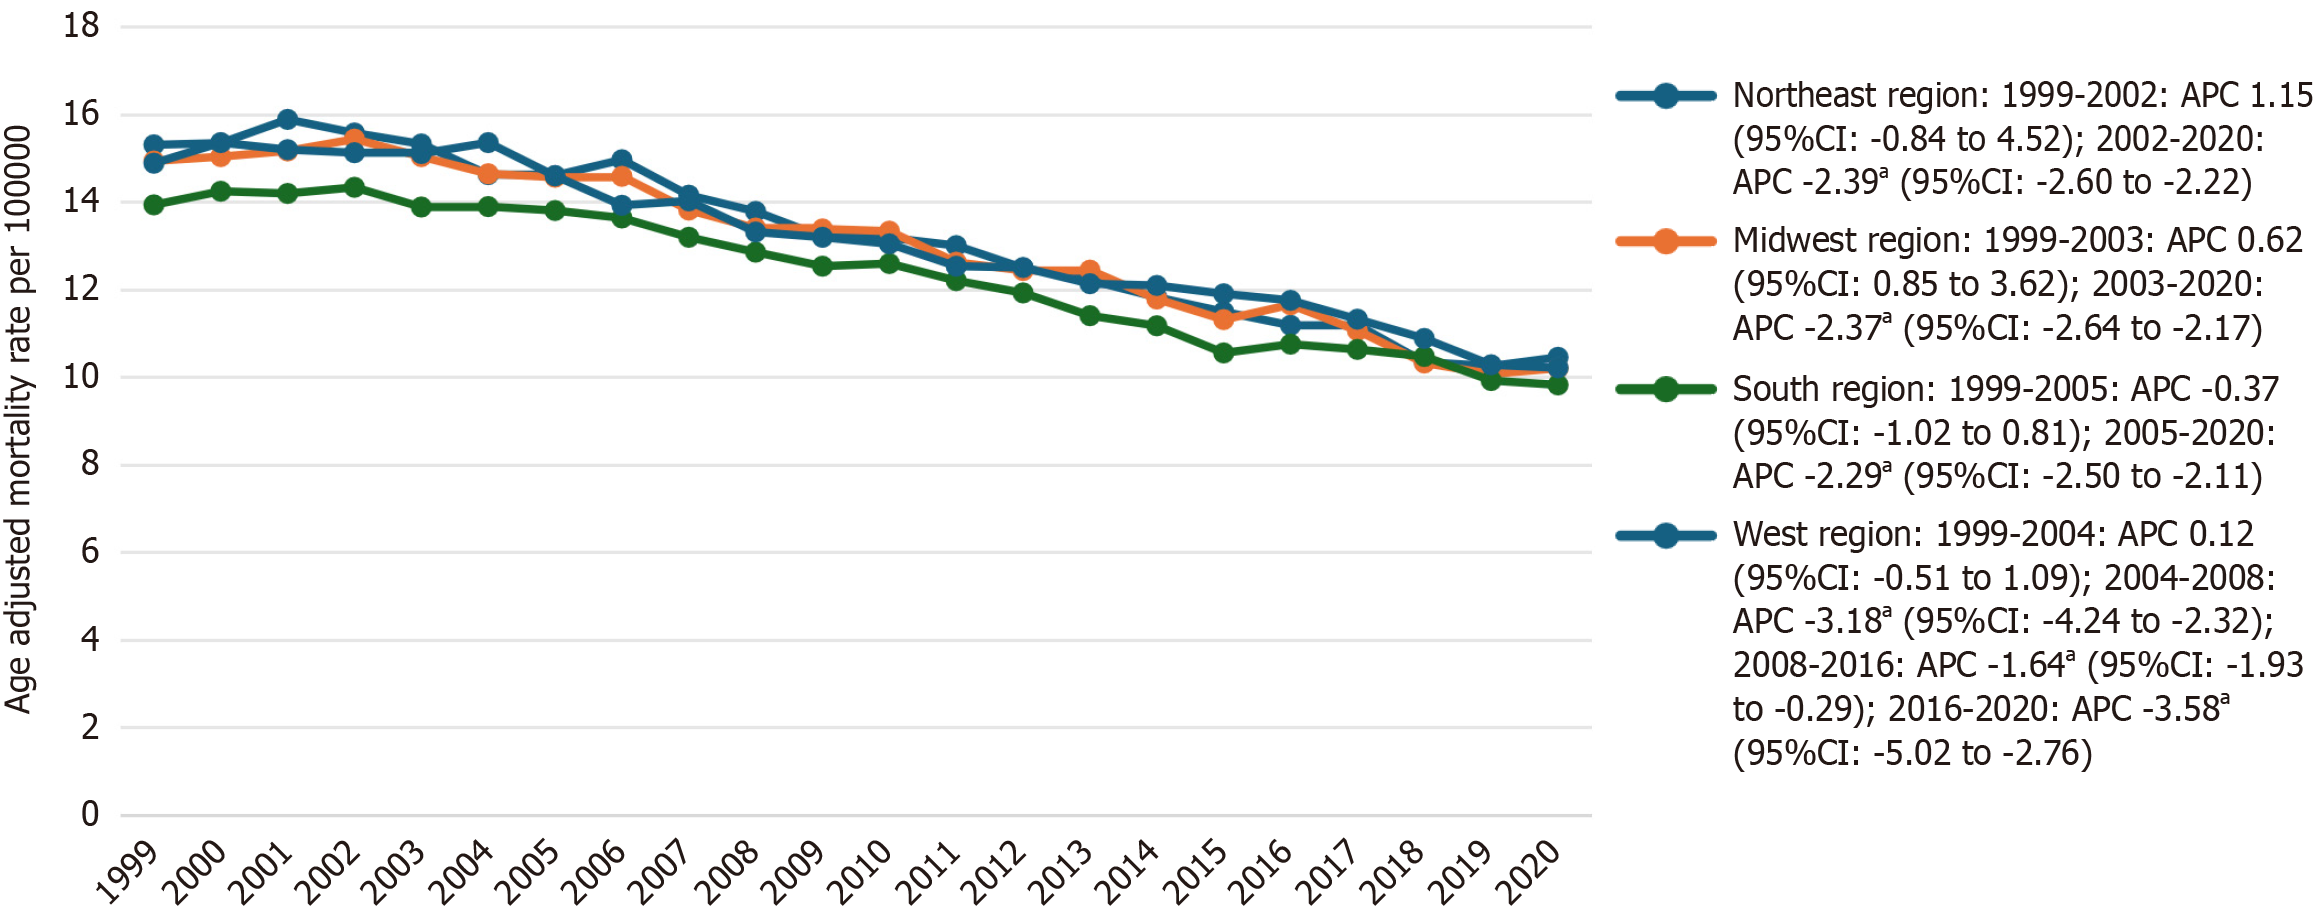
Figure 5 Ovarian carcinoma-related age-adjusted mortality rates per 100000, stratified by census regions, in the United States, 1999 to 2020.
aP value < 0.05, statistically significant annual percent change values. APC: Annual percent change; CI: Confidence interval.
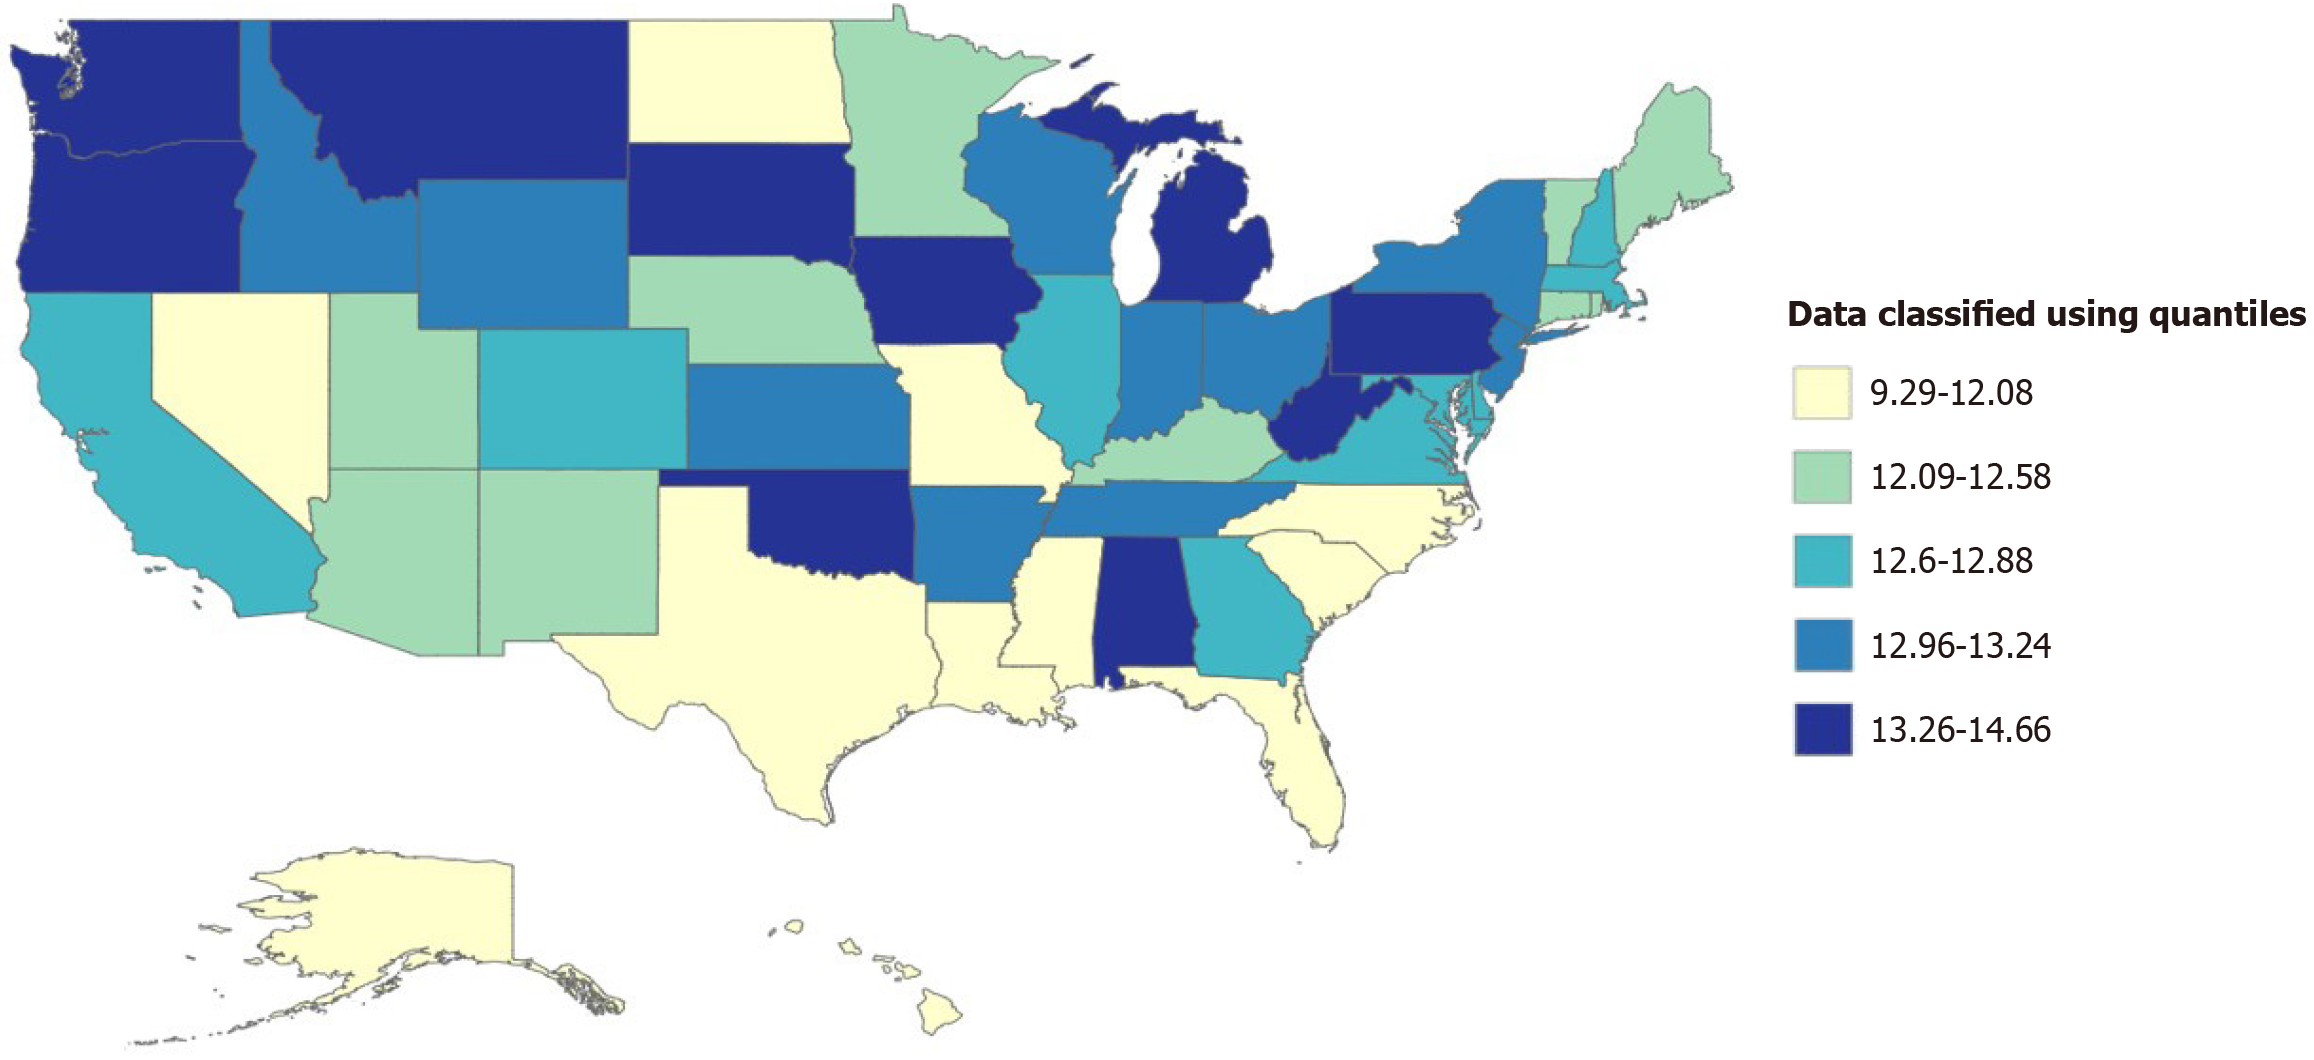
Figure 6 Ovarian carcinoma-related age-adjusted mortality rates per 100000, stratified by states, in the United States, 1999 to 2020.
- Citation: Razaq L, Dhali A, Maity R, Faisal AR, Hafeez AS, Zaman A, Humayun MA, Faizan M, Shahid M, Majeed M, Singh P. Demographic trends in mortality due to ovarian cancer in the United States, 1999-2020. World J Clin Oncol 2025; 16(6): 108393
- URL: https://www.wjgnet.com/2218-4333/full/v16/i6/108393.htm
- DOI: https://dx.doi.org/10.5306/wjco.v16.i6.108393


