Copyright
©The Author(s) 2025.
World J Clin Oncol. May 24, 2025; 16(5): 102747
Published online May 24, 2025. doi: 10.5306/wjco.v16.i5.102747
Published online May 24, 2025. doi: 10.5306/wjco.v16.i5.102747
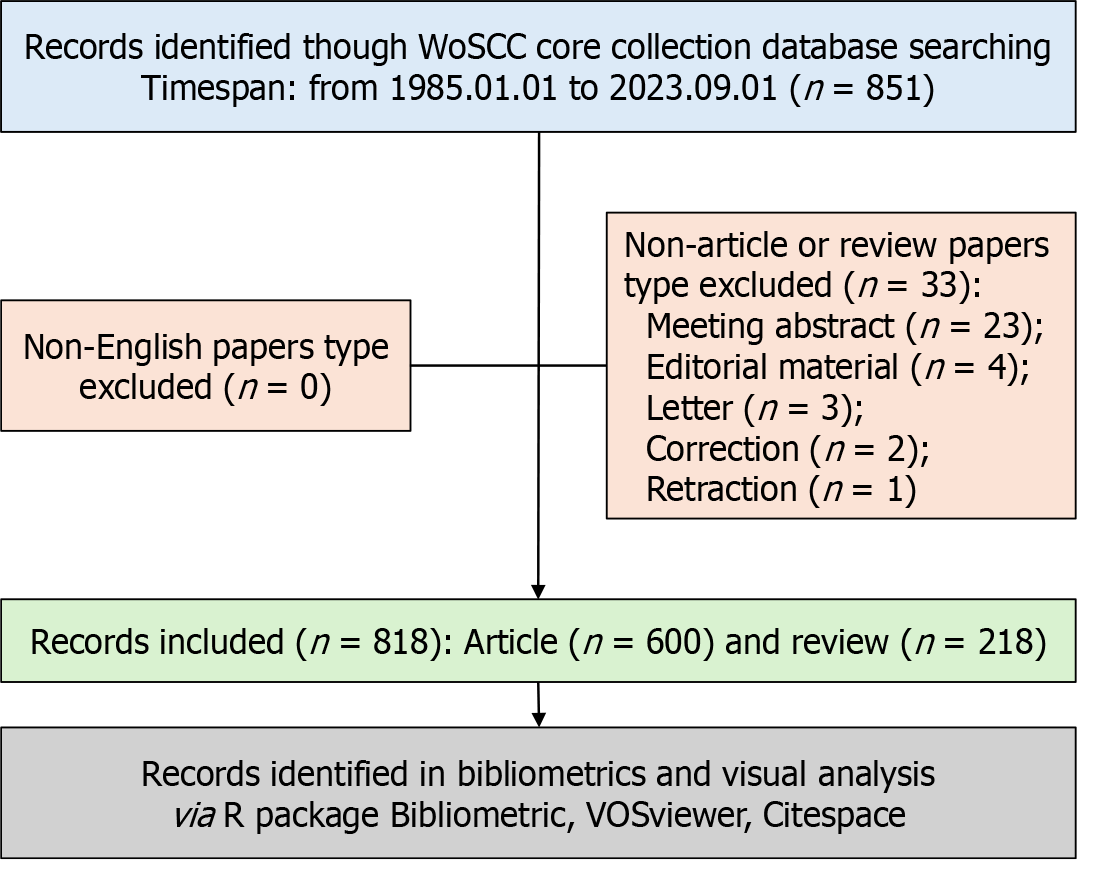
Figure 1 Flowchart depicting the search process employed.
WoSCC: Web of Science Core Collection.
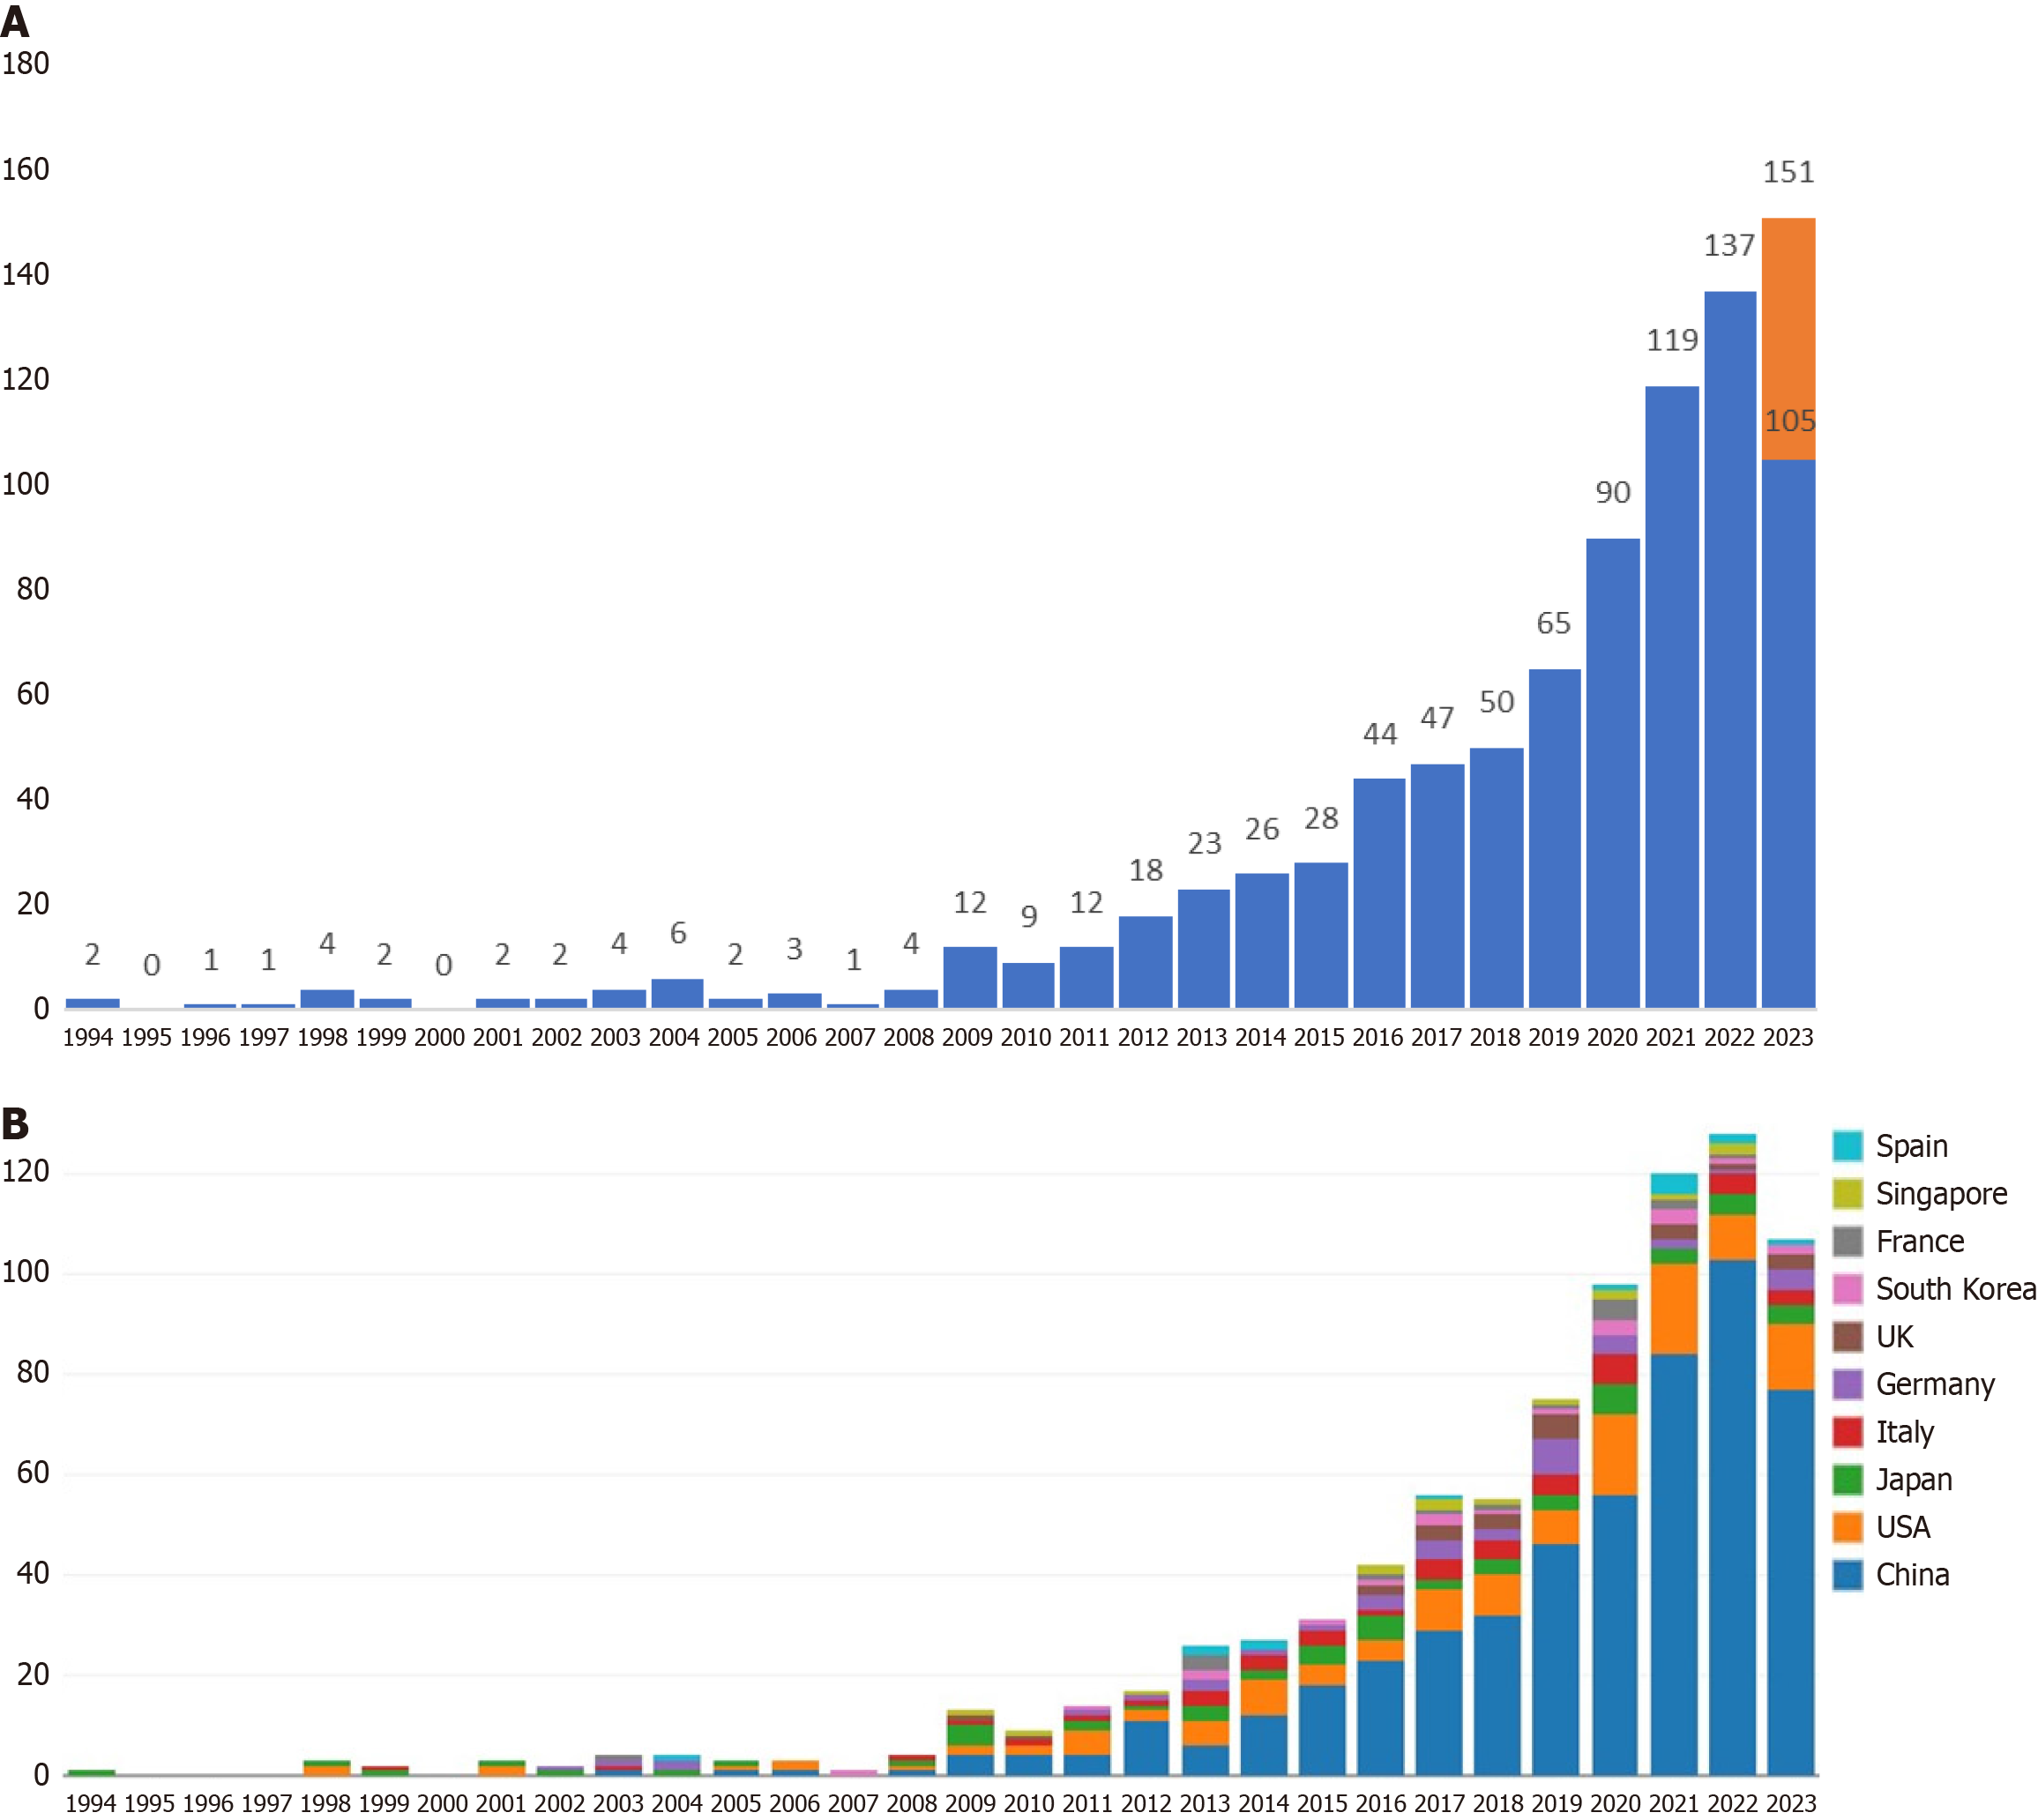
Figure 2 Bibliometric analysis conducted on publications.
A: Annual outputs of publications and growth forecast; B: Annual outputs of publications of the top 10 countries.
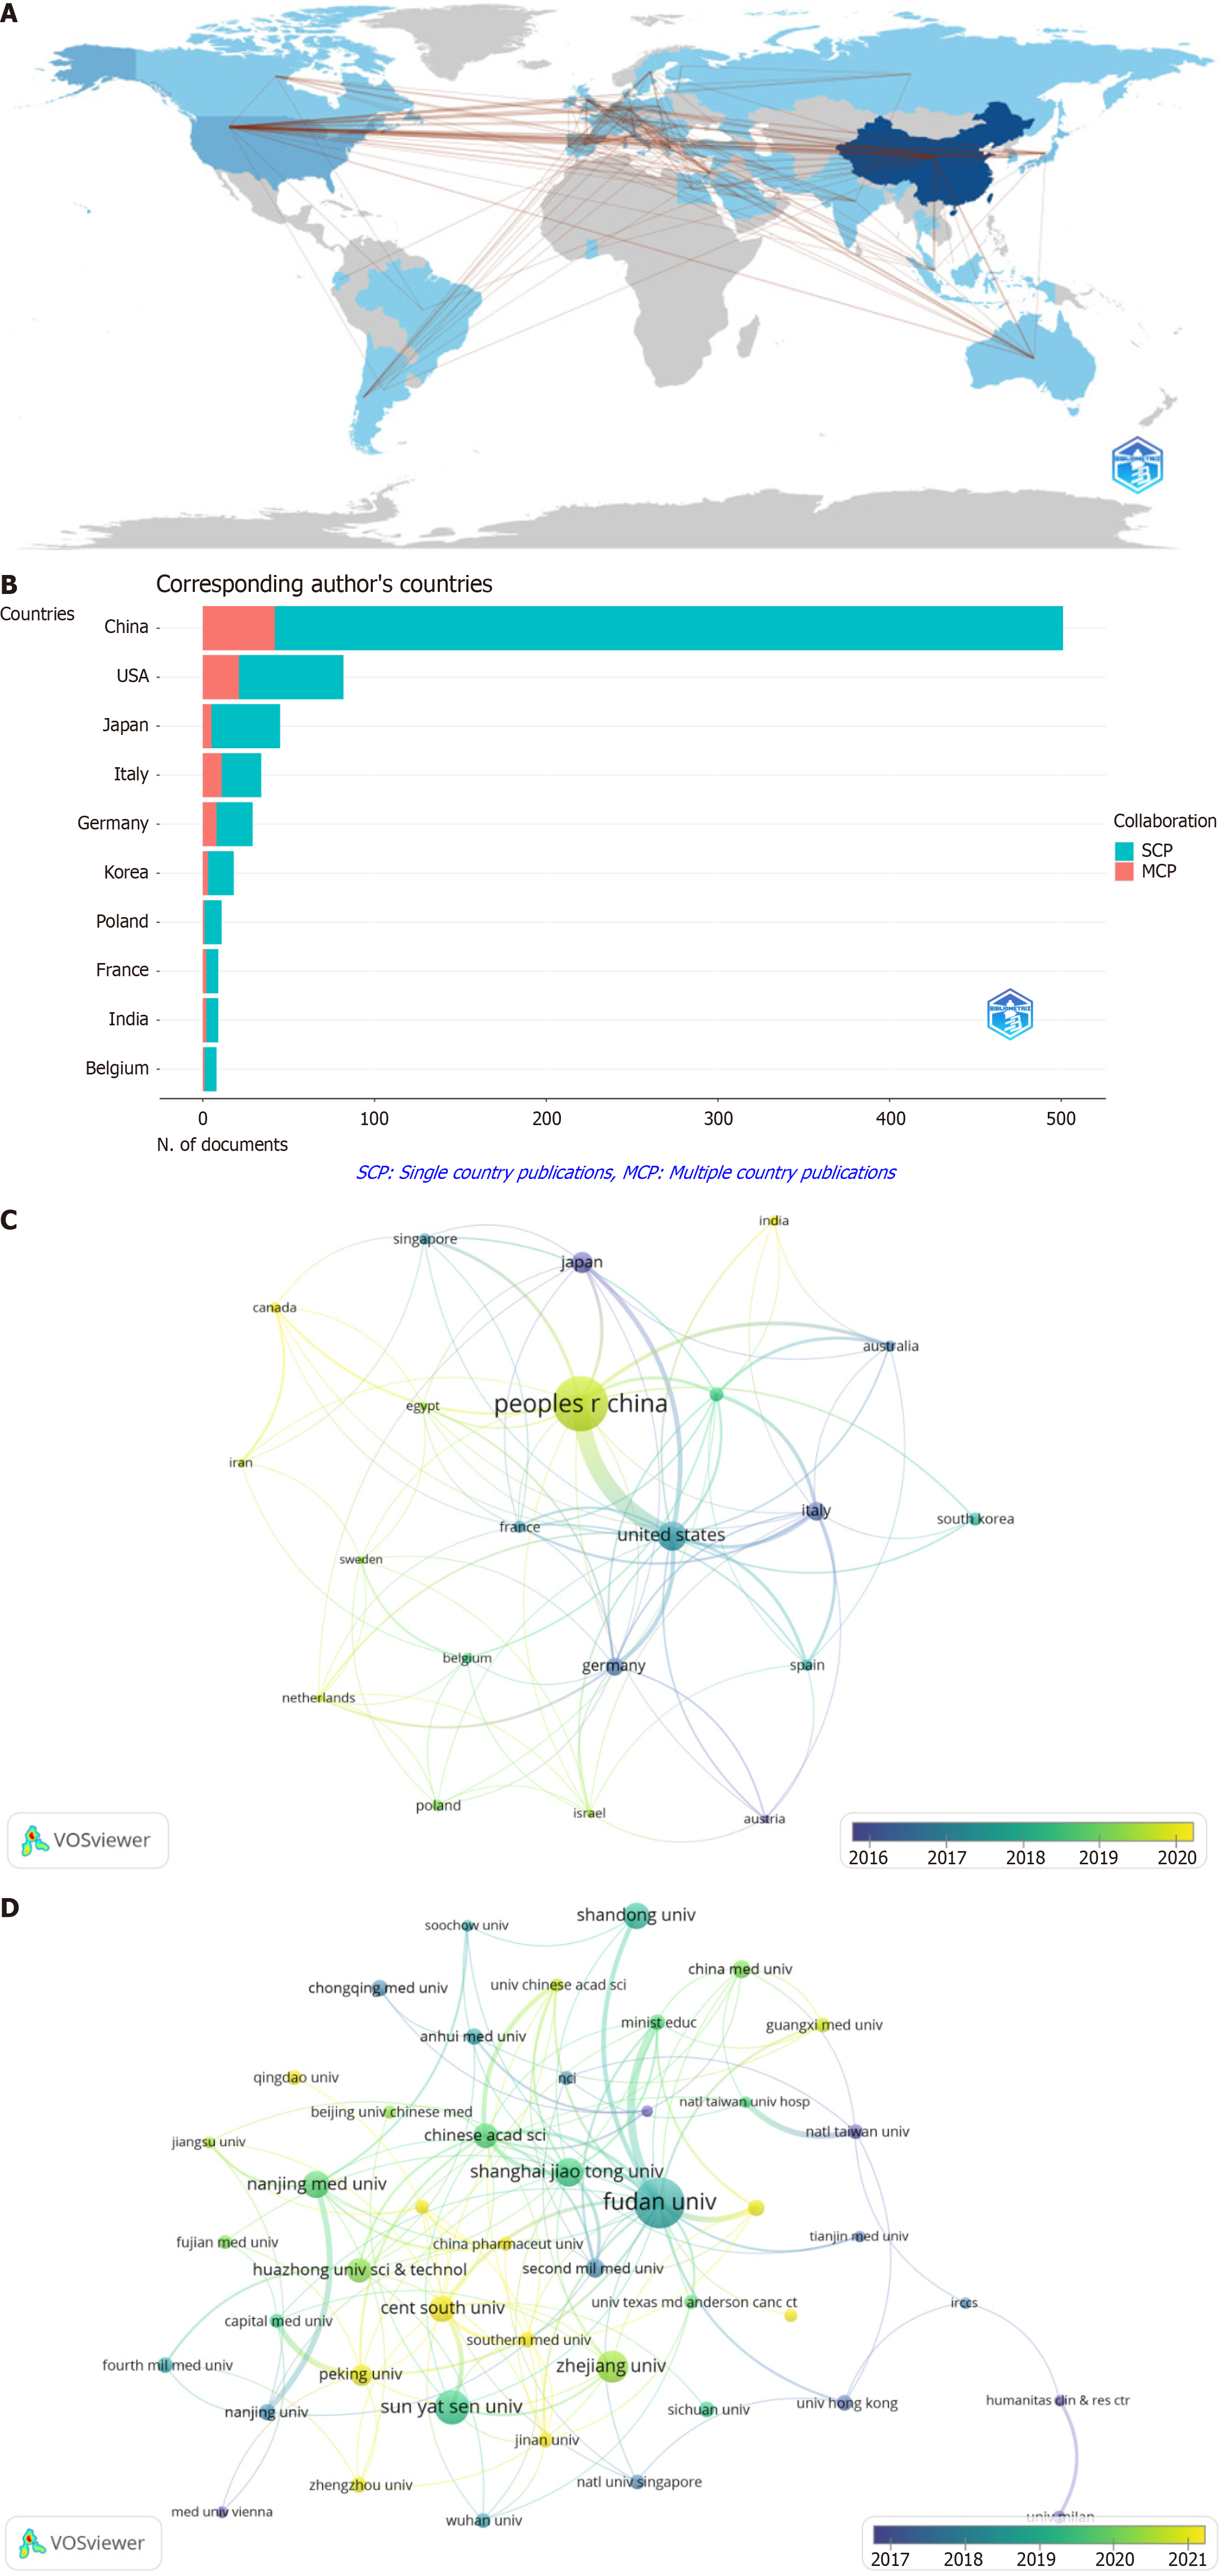
Figure 3 Bibliometric analysis conducted on countries/institutions.
A: Map of collaboration countries; B: Top ten countries with the highest number of corresponding authors; C: Co-authorship visualization among countries. Circles’ size and color represent outputs and the average year of publication, respectively; D: Co-authorship visualization among institutions. Circles’ size and color represent outputs and the average year of publication, respectively.
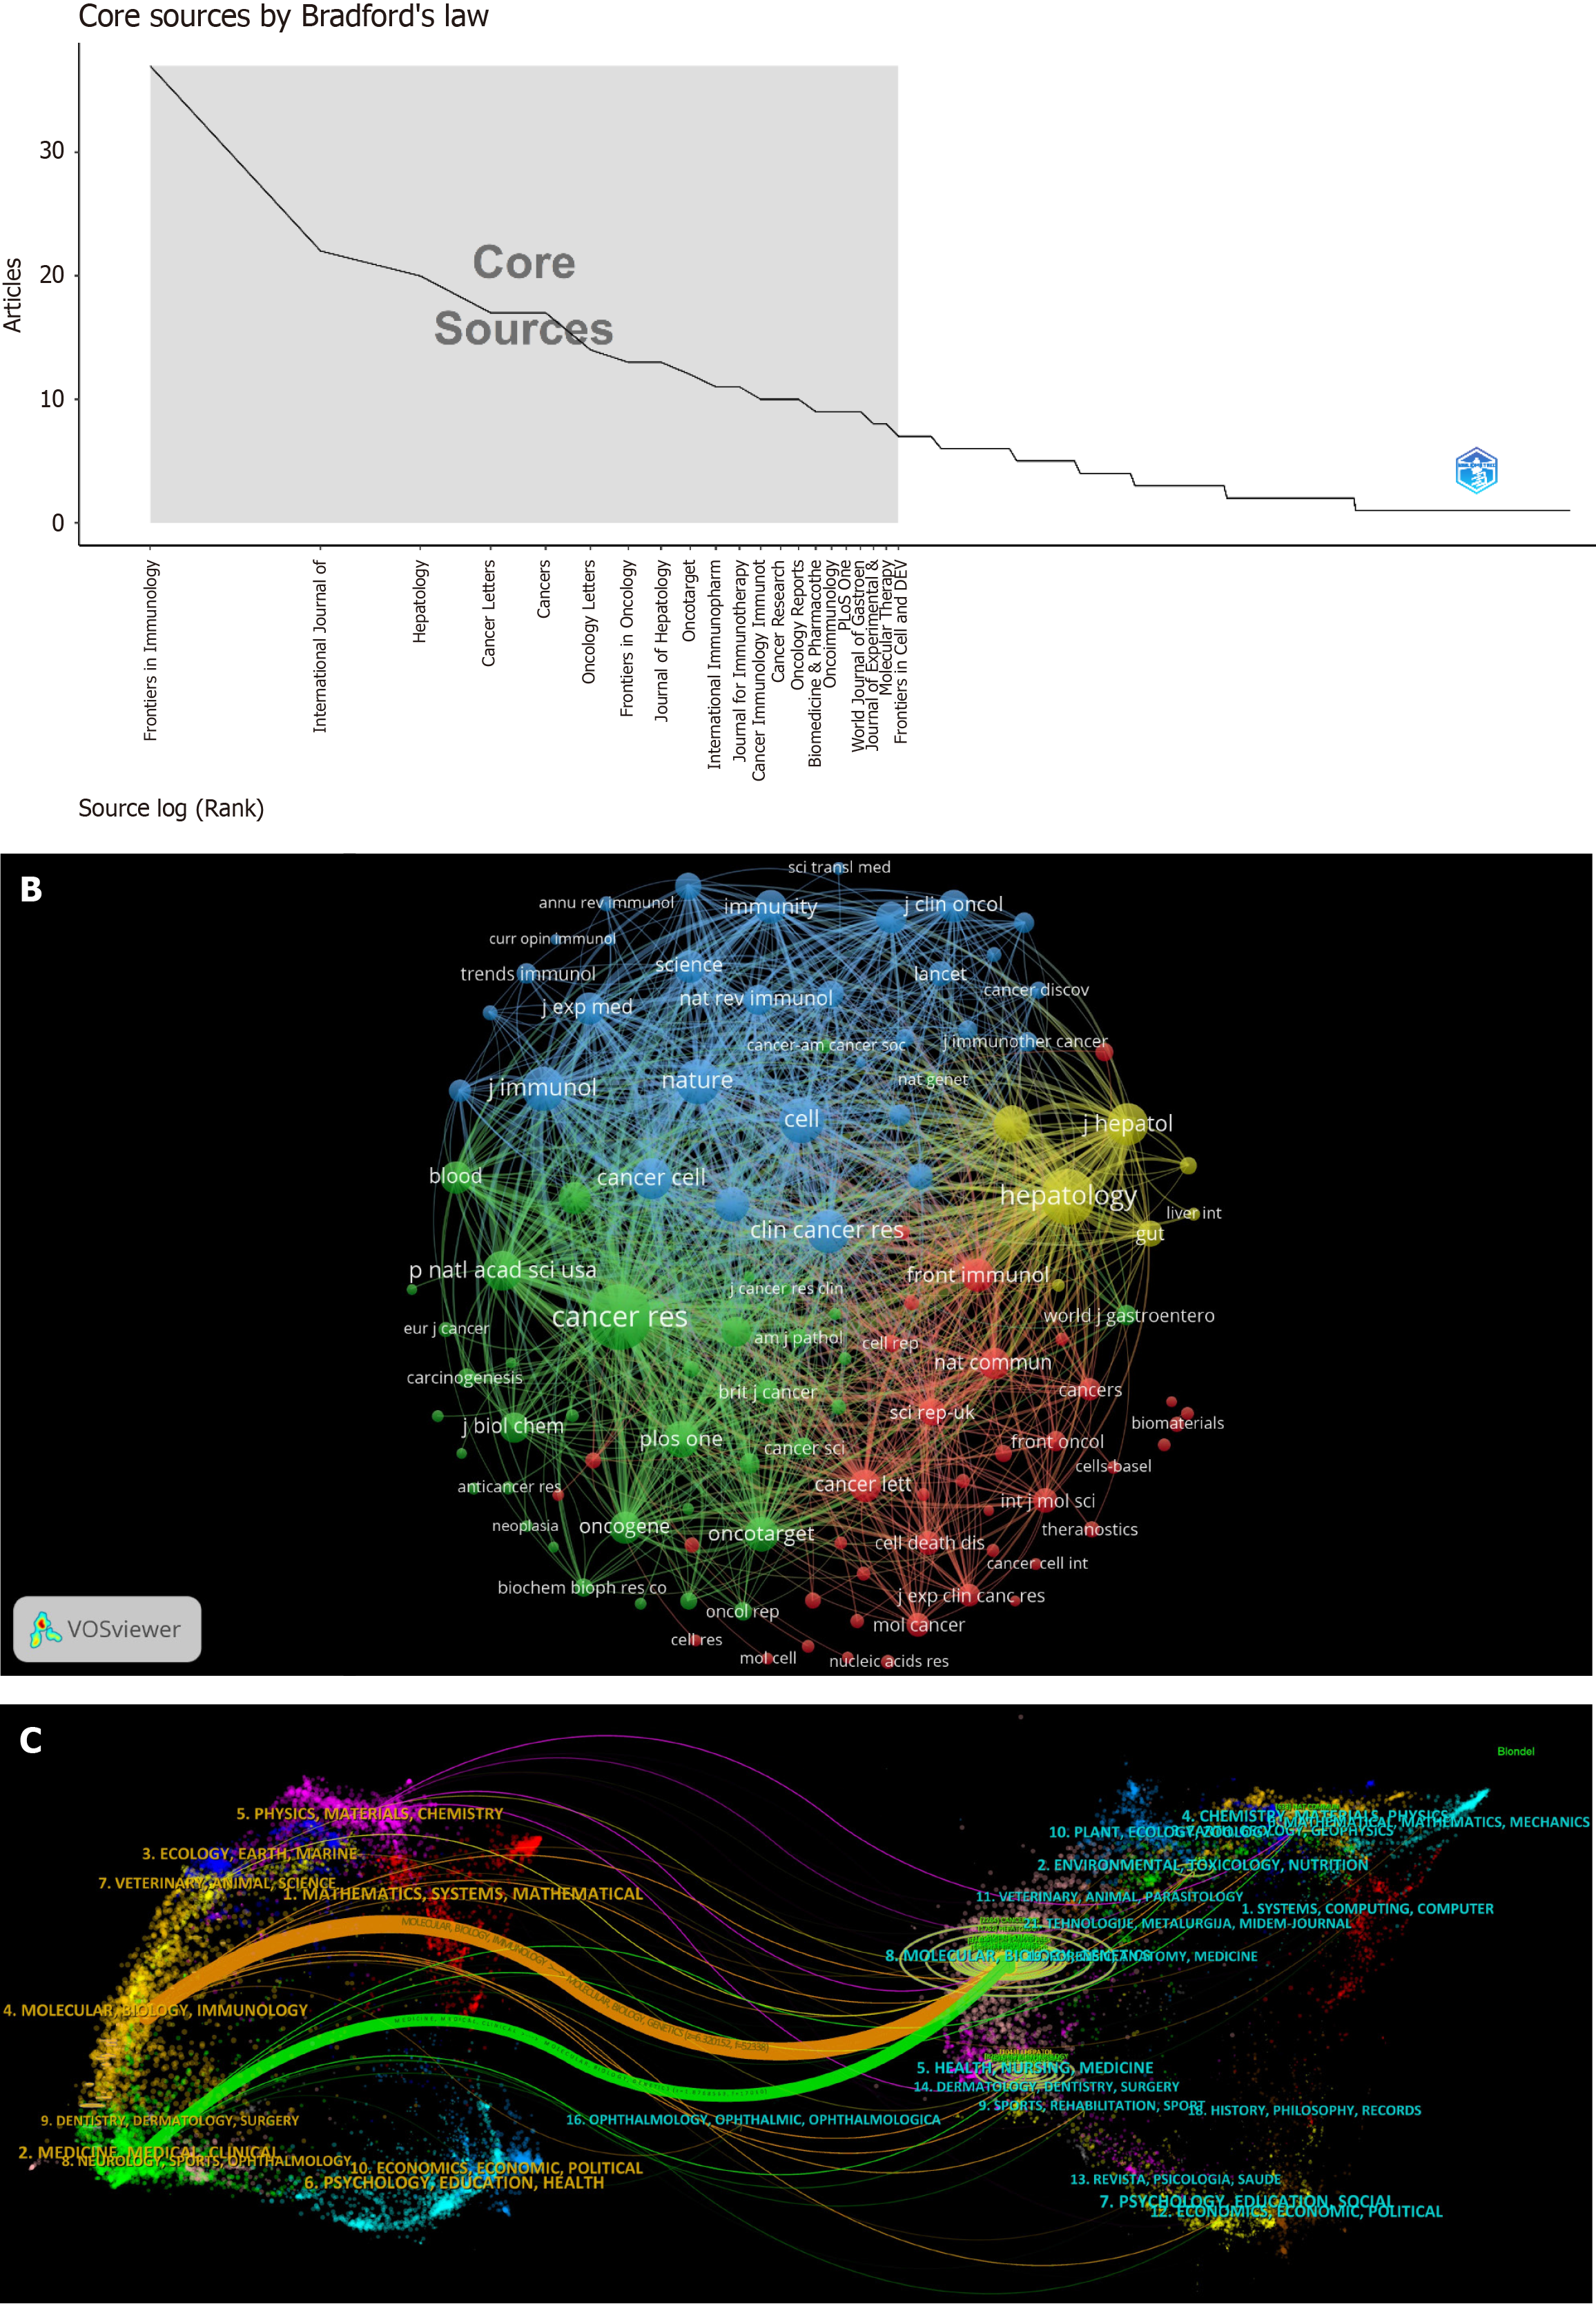
Figure 4 Bibliometric analysis conducted on journals.
A: Twenty core journals identified using Bradford’s law; B: Co-citation visualization among journals. Circles’ size and color correspond to citations and clusters, respectively; C: Dual-map overlay visualization of journals. Colored path indicates the cited relationship.
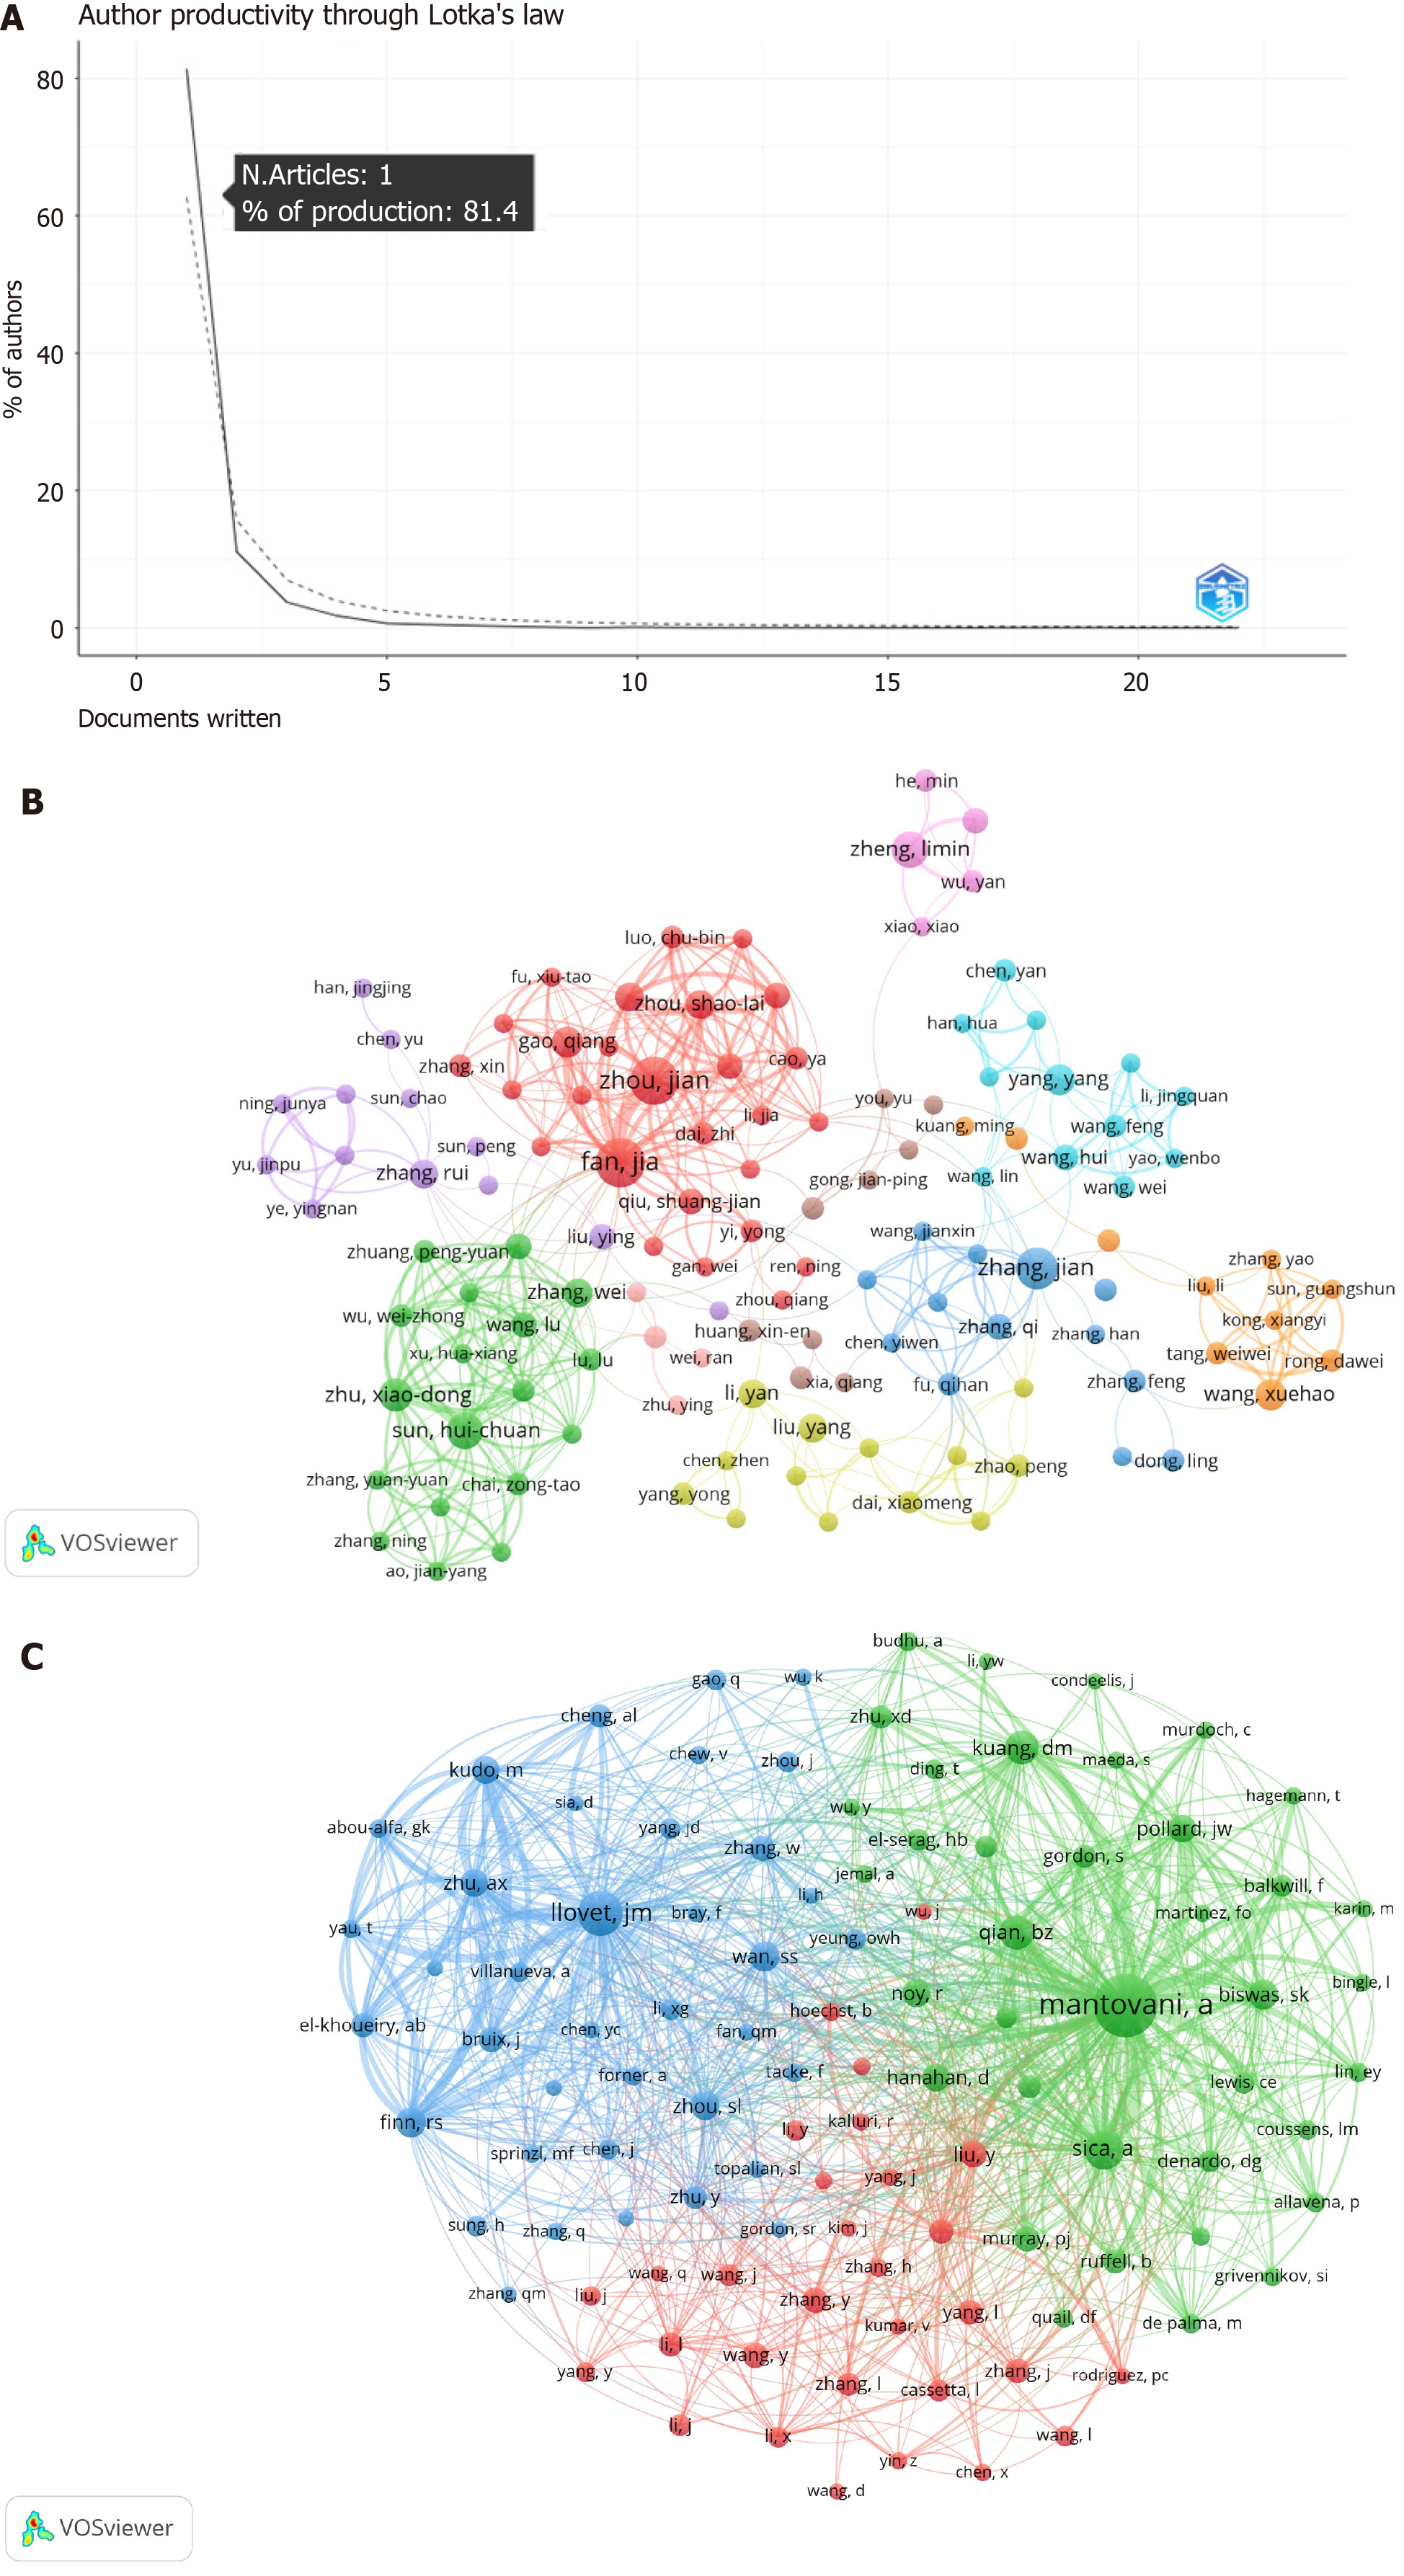
Figure 5 Bibliometric analysis conducted on authors.
A: Scientific productivity of authors based on Lotka’s law; B: Co-authorship visualization among authors. Circles’ size and color represent outputs and clusters, respectively; C: Co-citation visualization among authors. Circles’ size and color represent citations and clusters, respectively.
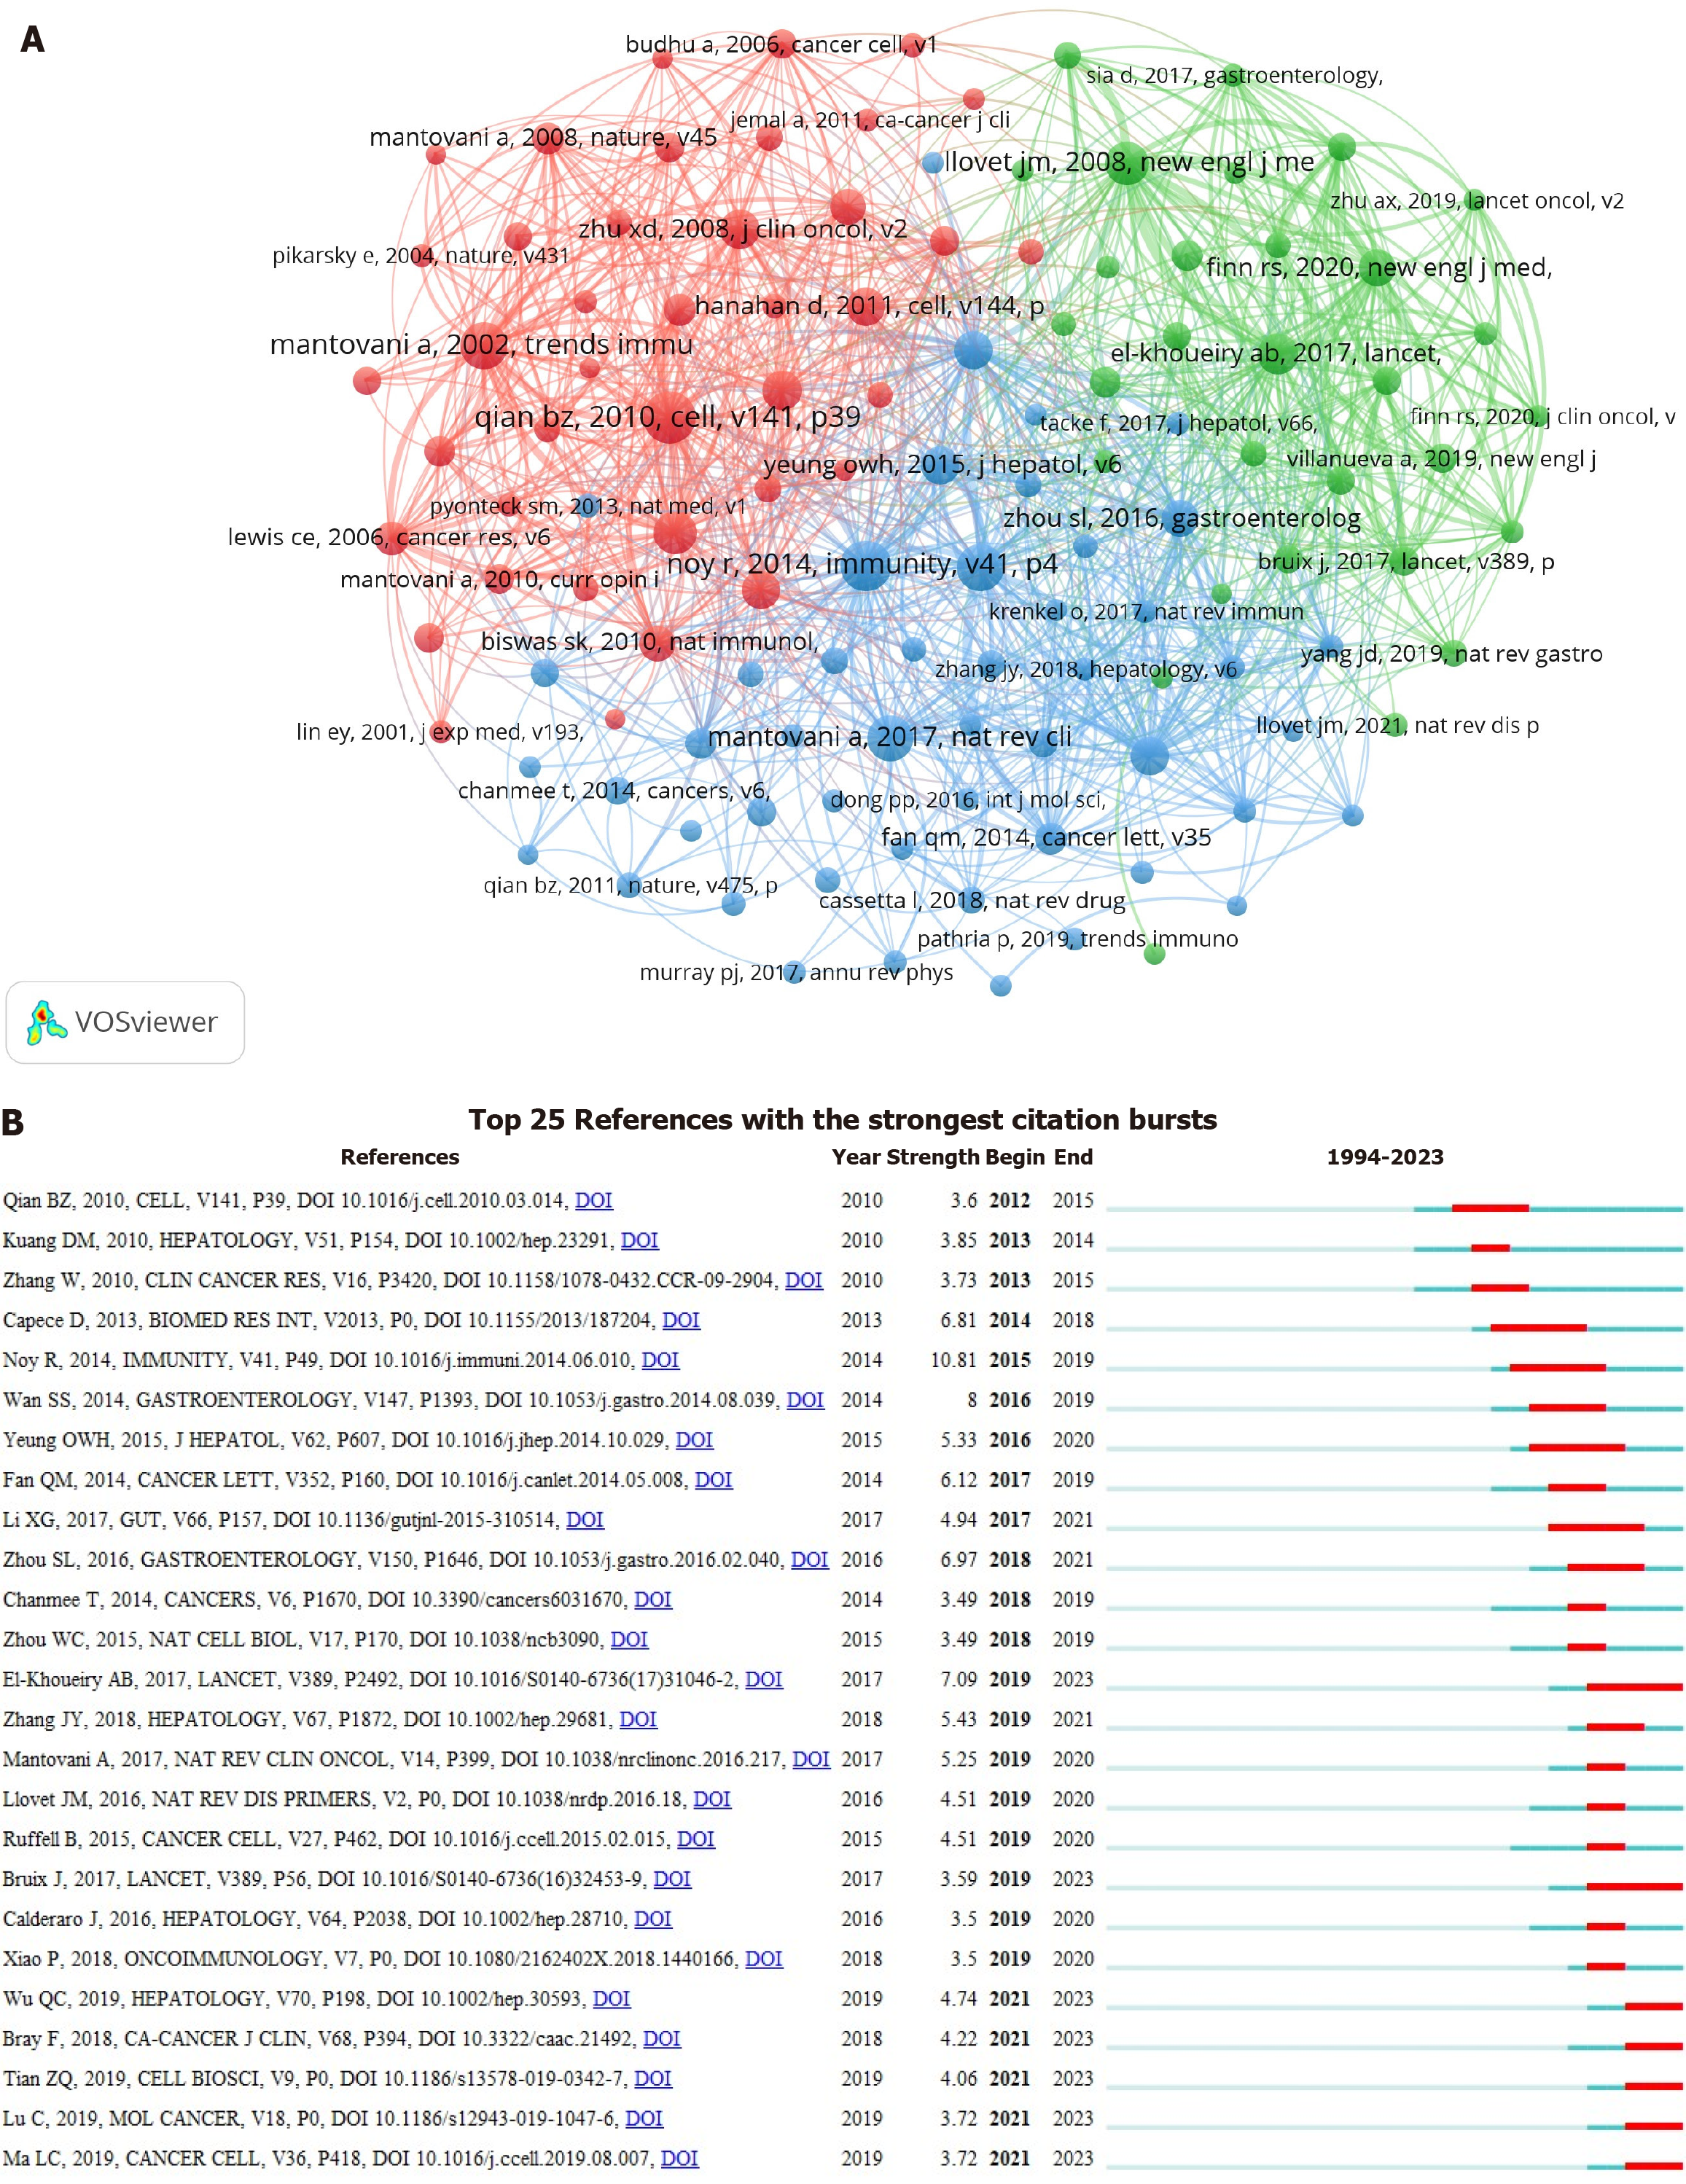
Figure 6 Bibliometric analysis on co-cited references.
A: Co-citation visualization among references. Circles’ size and color represent citations and clusters, respectively; B: Top 25 co-cited references with the strongest citation bursts.
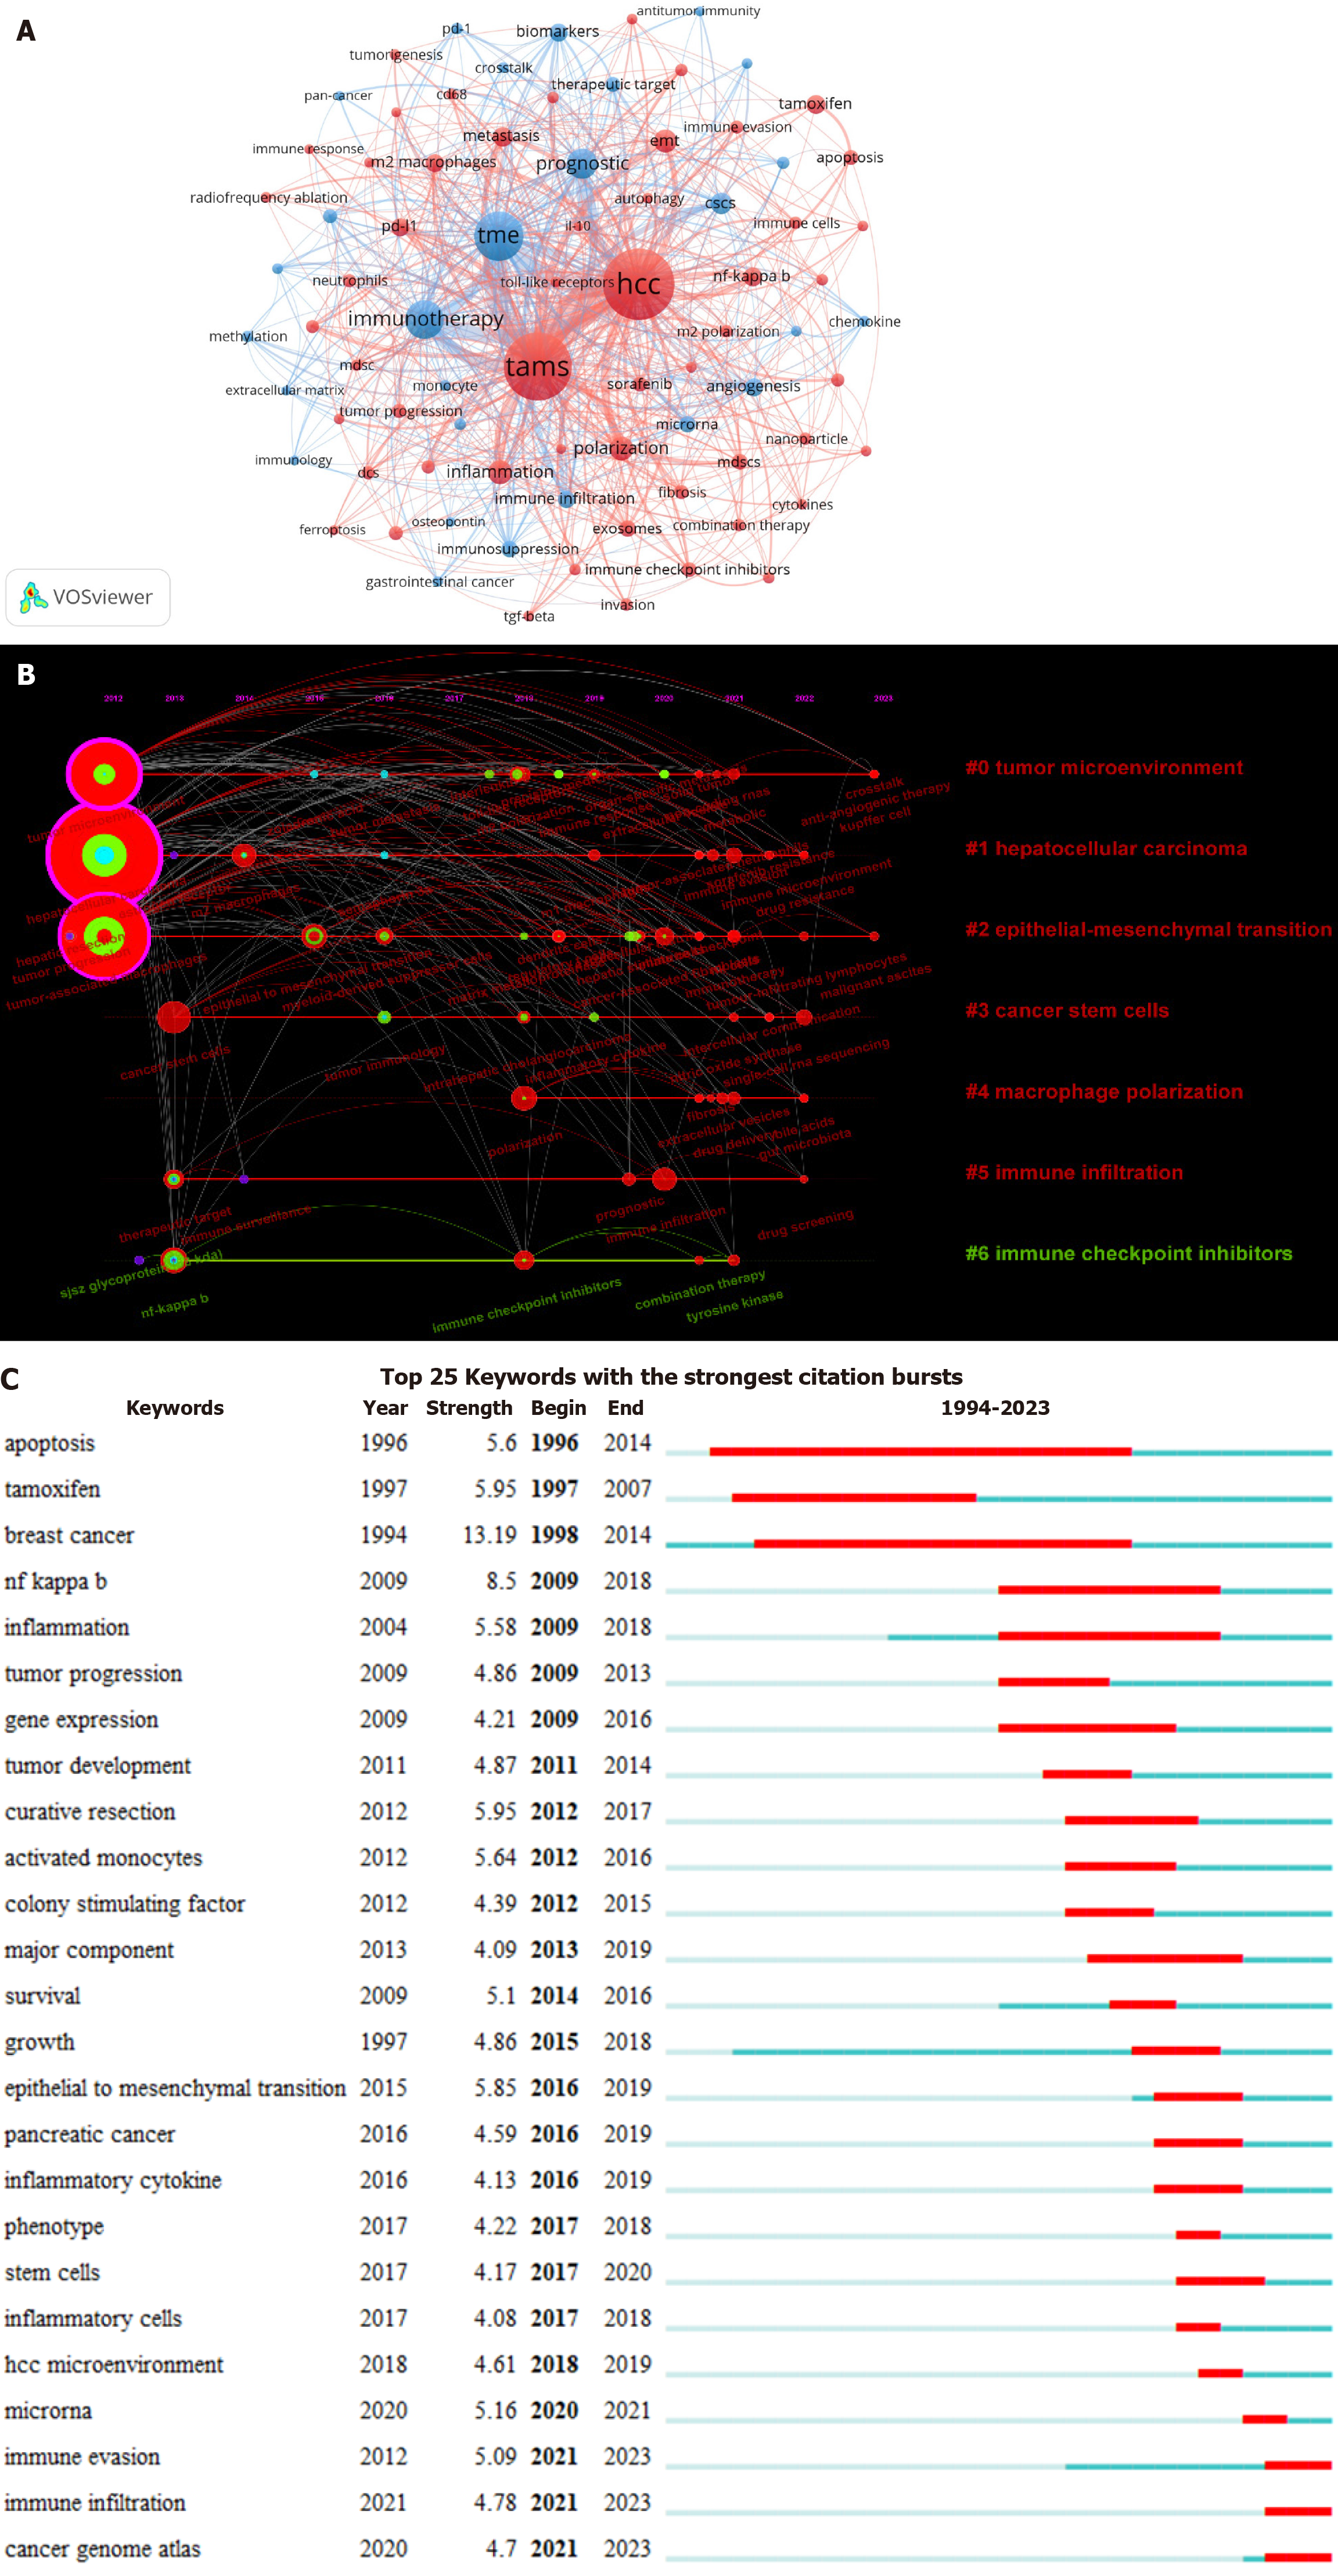
Figure 7 Bibliometric analysis on author keywords.
A: Co-occurrence visualization among author keywords. Circles’ size and color represent the frequency of occurrences and clusters, respectively; B: Timeline scope of co-citation analysis of author keywords. Nodes on the same timeline represent years; C: Top 25 author keywords with the strongest citation bursts. HCC: Hepatocellular carcinoma; TAMs: Tumor-associated macrophages; TME: Tumor microenvironment.
- Citation: Mo PL, Lin M, Gao BW, Zhang SB, Chen JP. Knowledge structure analysis and network visualization of tumor-associated macrophages in hepatocellular carcinoma research: A bibliometric mapping. World J Clin Oncol 2025; 16(5): 102747
- URL: https://www.wjgnet.com/2218-4333/full/v16/i5/102747.htm
- DOI: https://dx.doi.org/10.5306/wjco.v16.i5.102747


