Copyright
©The Author(s) 2025.
World J Clin Oncol. May 24, 2025; 16(5): 102747
Published online May 24, 2025. doi: 10.5306/wjco.v16.i5.102747
Published online May 24, 2025. doi: 10.5306/wjco.v16.i5.102747
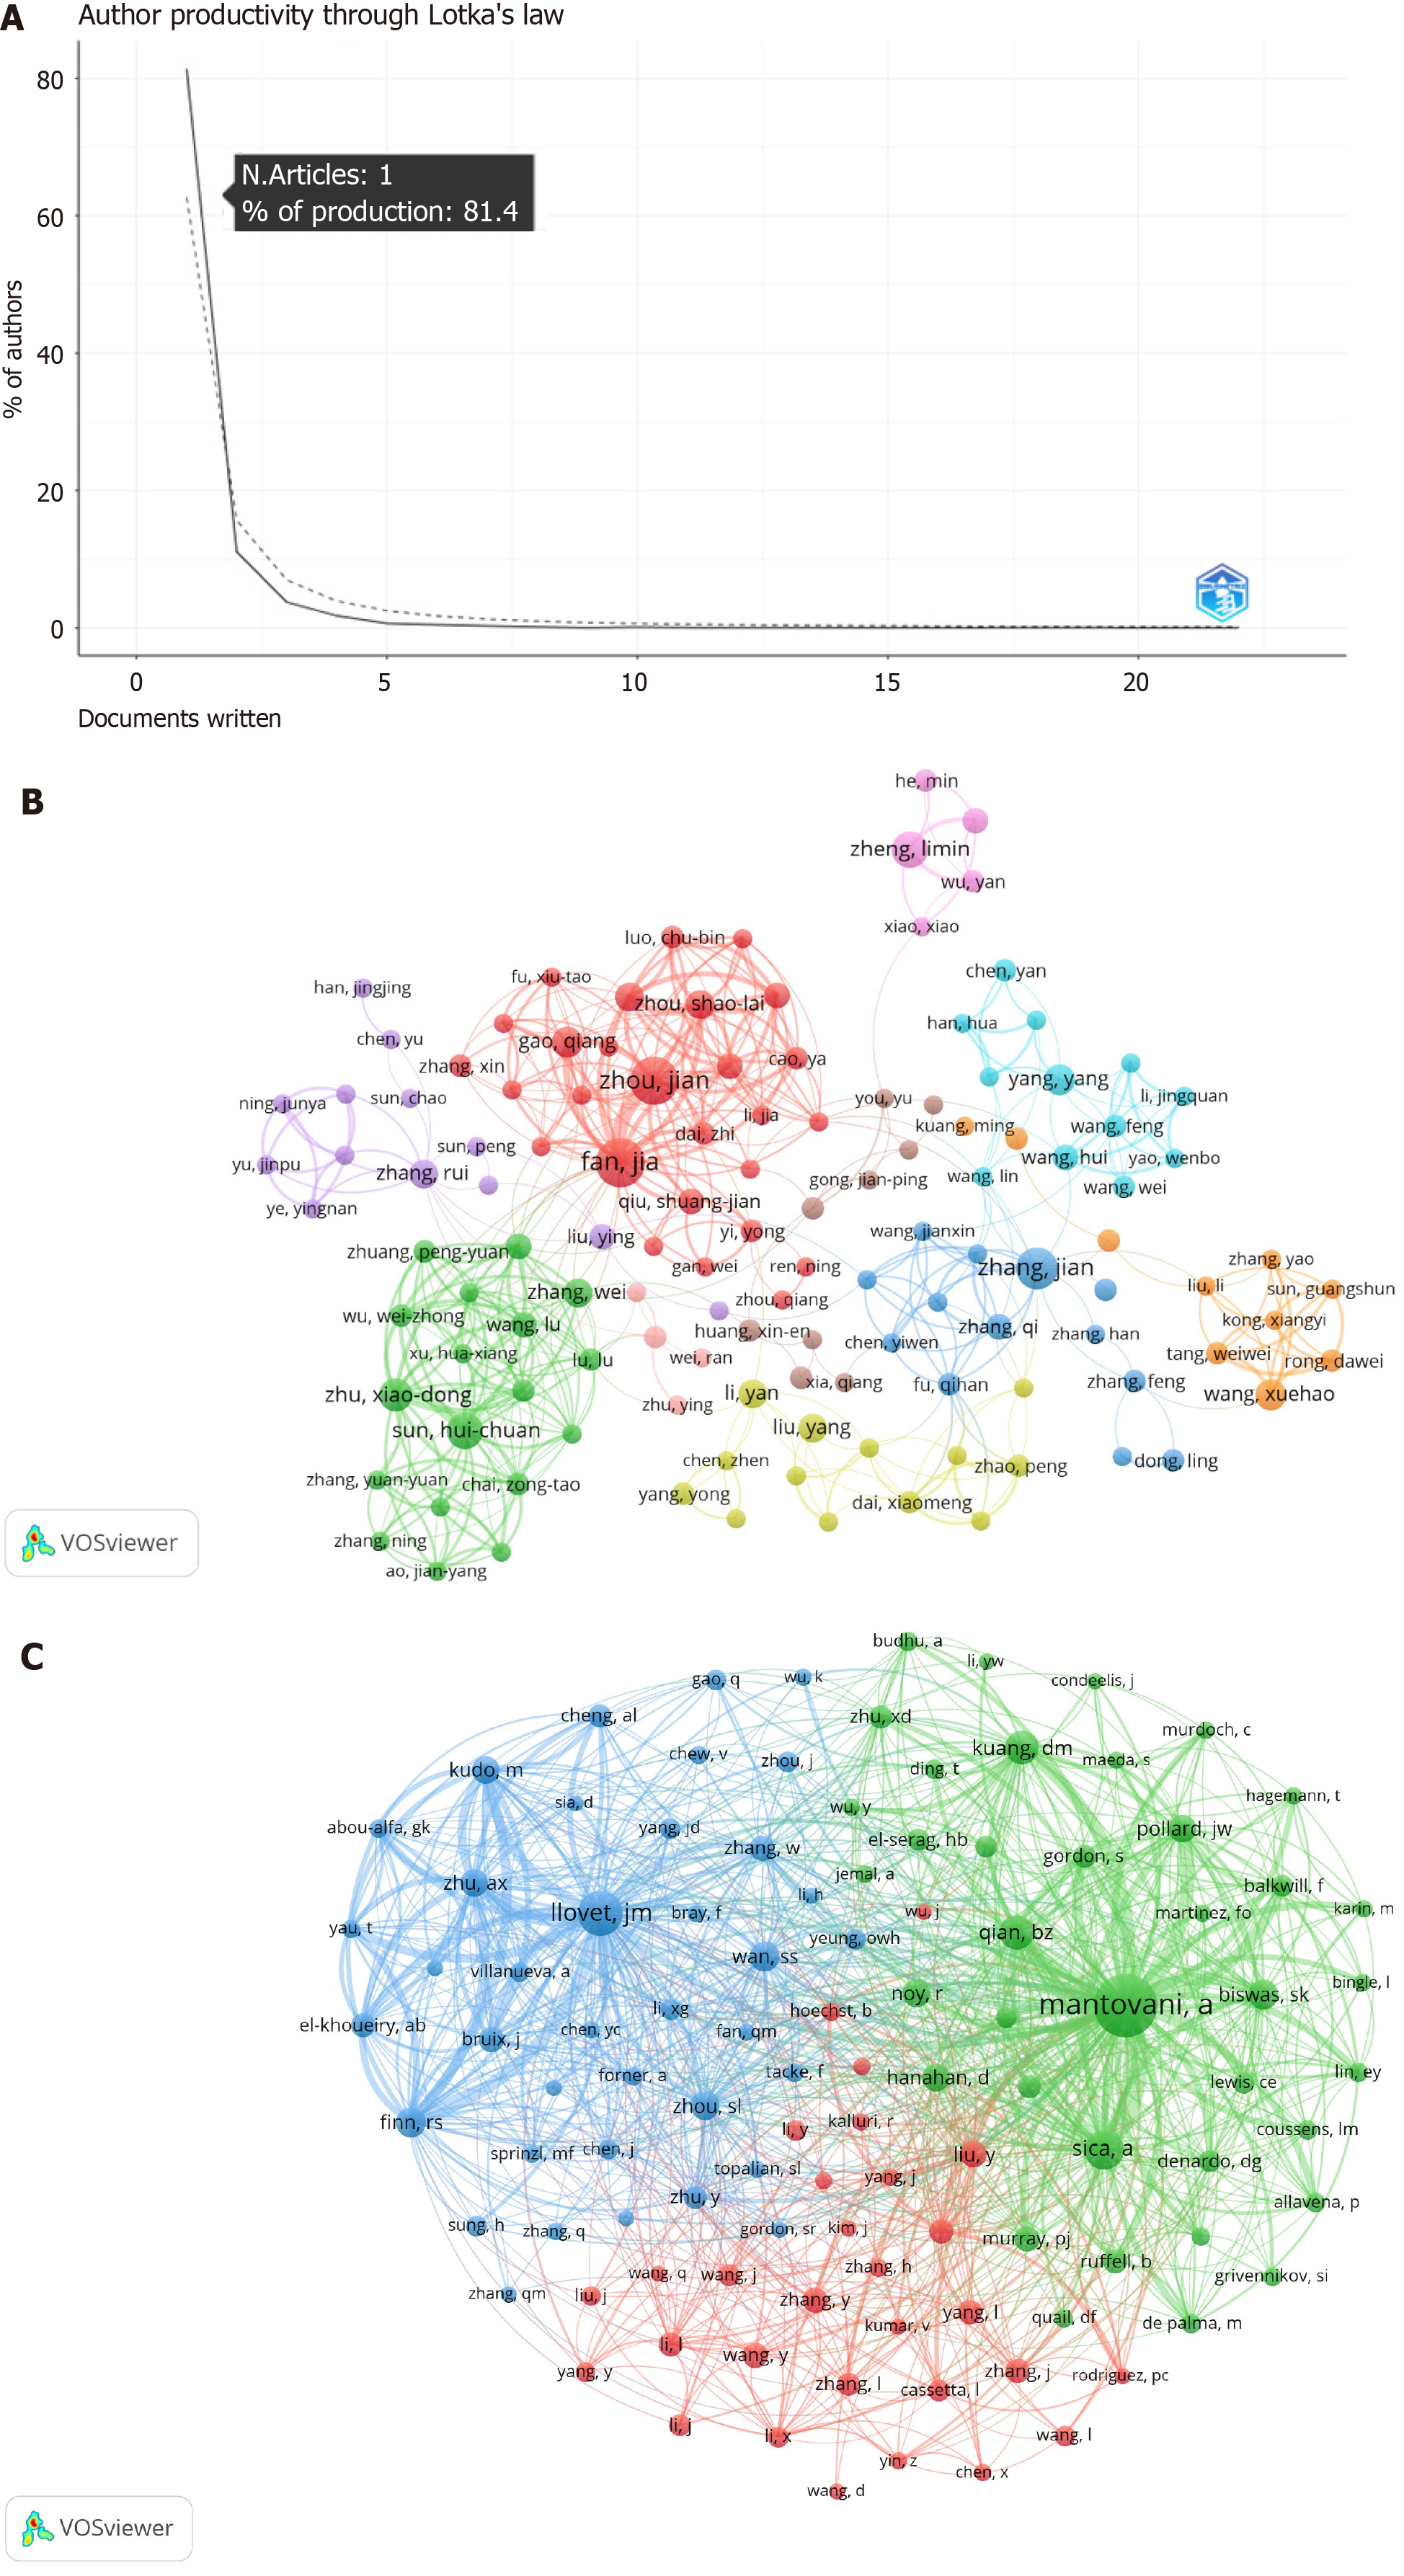
Figure 5 Bibliometric analysis conducted on authors.
A: Scientific productivity of authors based on Lotka’s law; B: Co-authorship visualization among authors. Circles’ size and color represent outputs and clusters, respectively; C: Co-citation visualization among authors. Circles’ size and color represent citations and clusters, respectively.
- Citation: Mo PL, Lin M, Gao BW, Zhang SB, Chen JP. Knowledge structure analysis and network visualization of tumor-associated macrophages in hepatocellular carcinoma research: A bibliometric mapping. World J Clin Oncol 2025; 16(5): 102747
- URL: https://www.wjgnet.com/2218-4333/full/v16/i5/102747.htm
- DOI: https://dx.doi.org/10.5306/wjco.v16.i5.102747


