Copyright
©The Author(s) 2024.
World J Clin Oncol. May 24, 2024; 15(5): 653-663
Published online May 24, 2024. doi: 10.5306/wjco.v15.i5.653
Published online May 24, 2024. doi: 10.5306/wjco.v15.i5.653
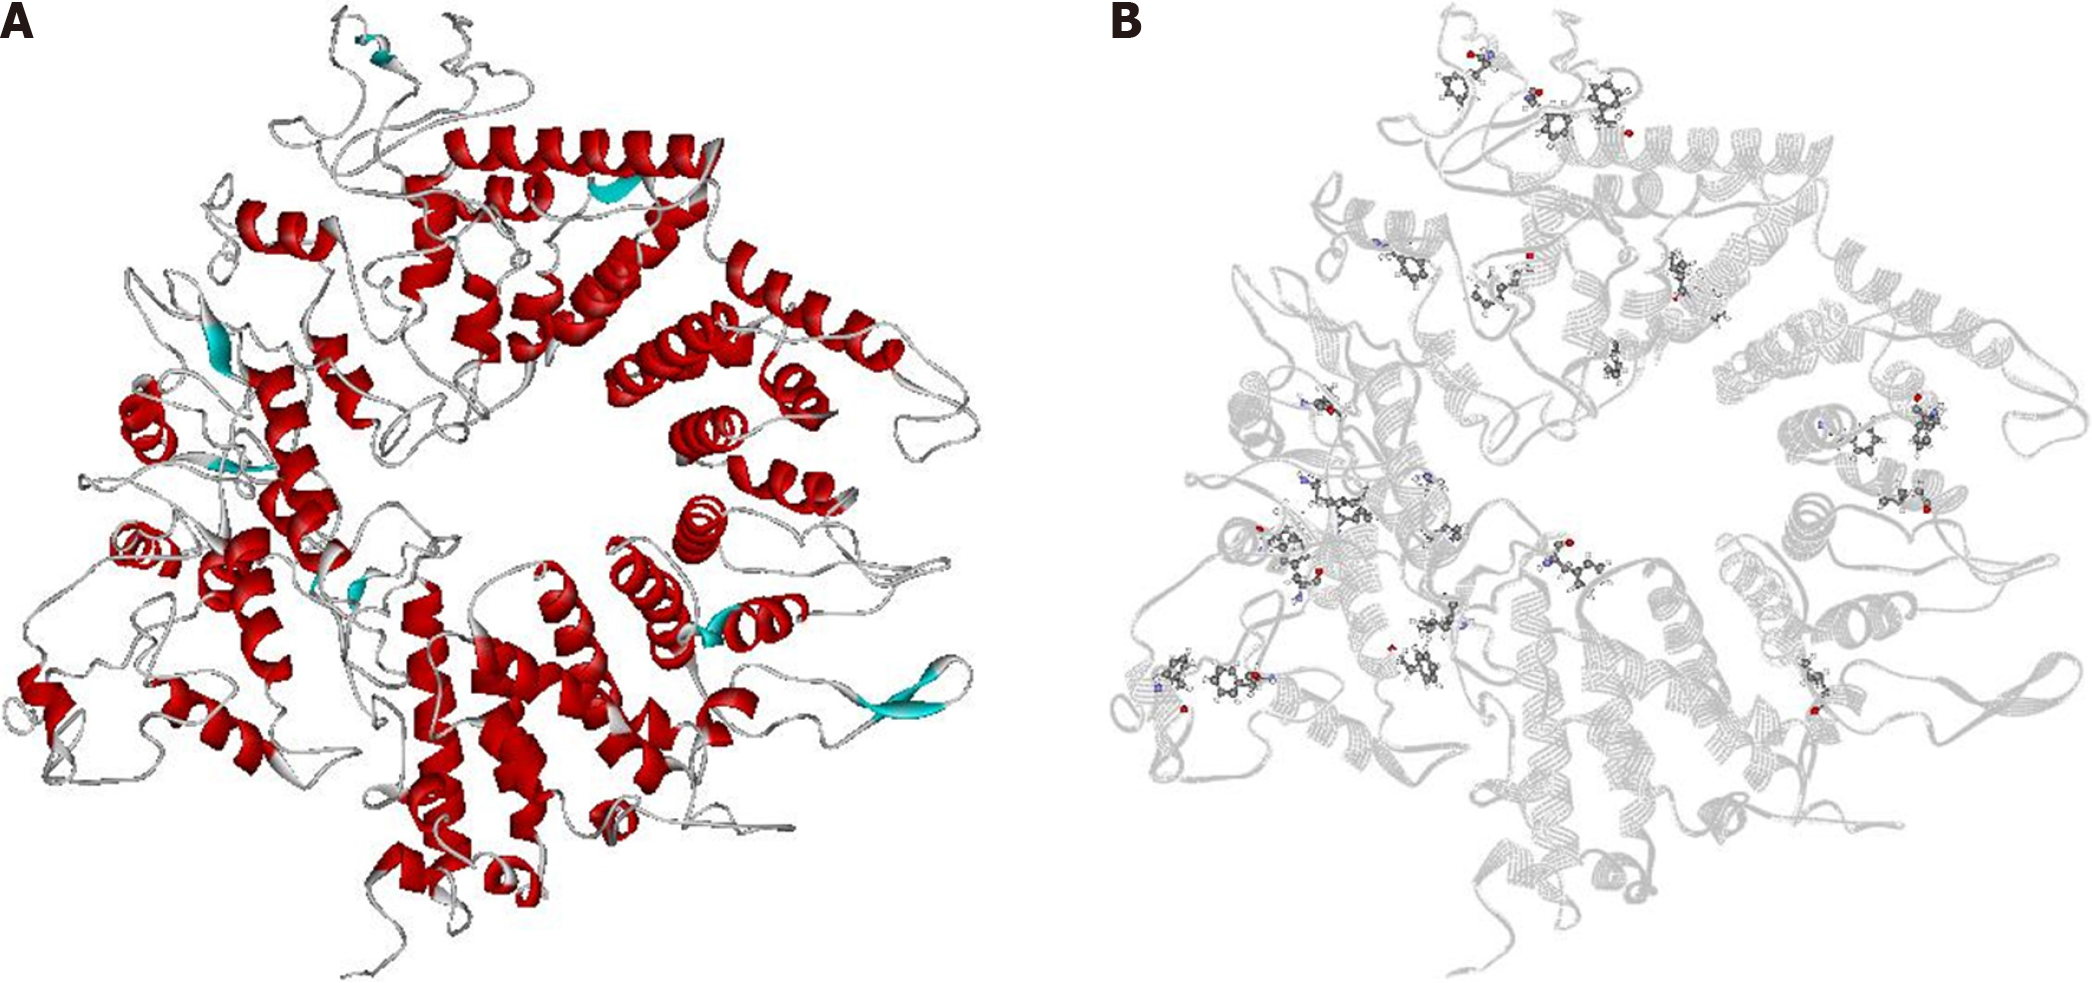
Figure 1 Three-dimensional structure model of Helicobacter pylori's CagA and predicted binding sites in silico.
A: CagA structure model. Blue: β-sheets; red: α-helices; gray: loops; B: CagA structure model in gray flat ribbon with predicted binding sites (residues) highlighted in ball and stick format.
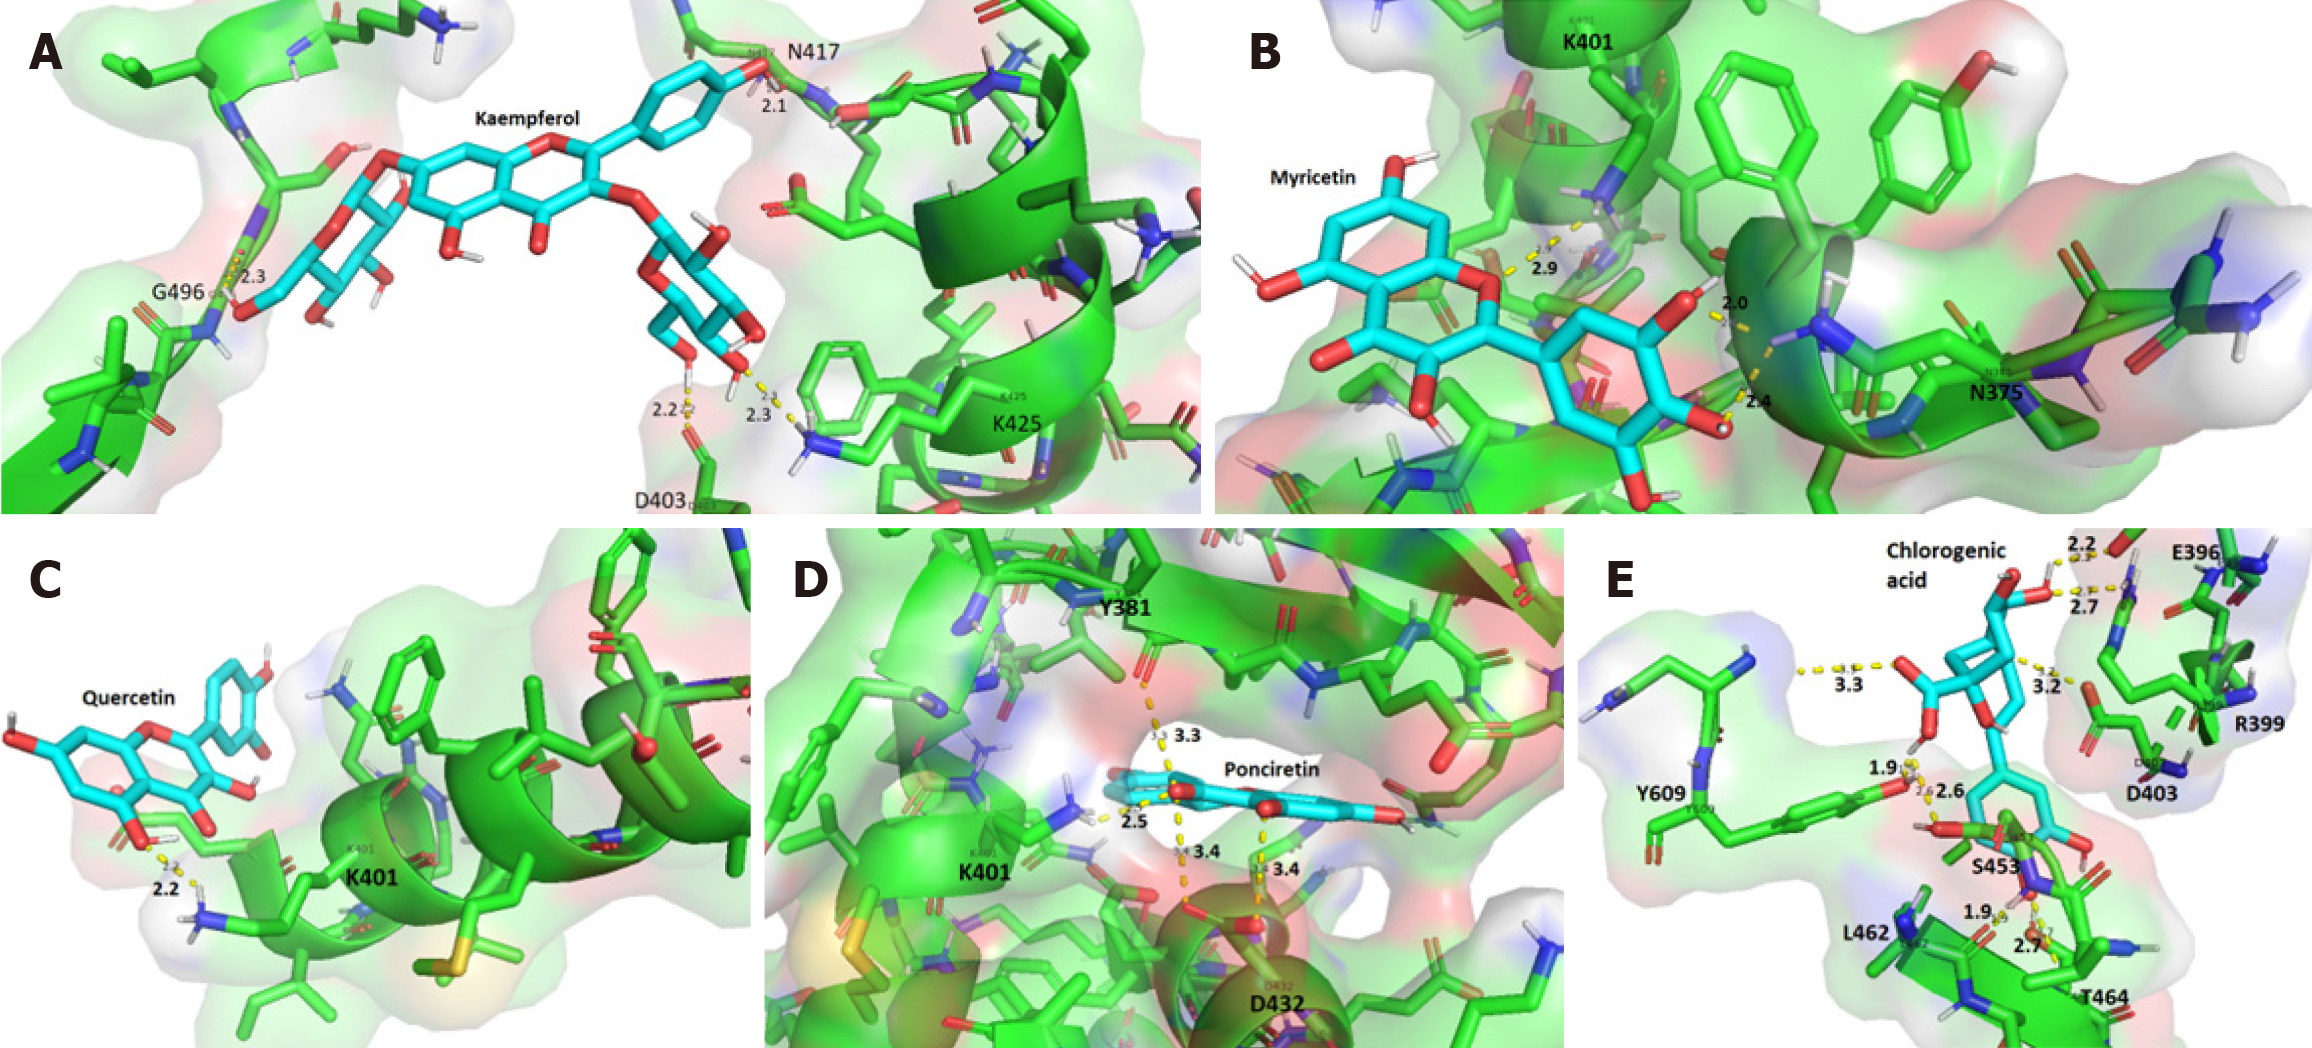
Figure 2 Interaction of phenolic compounds with amino acid residues in the central region of the CagA oncoprotein.
A: Cag/kaempferol complex; B: Cag/myricetin complex; C: CagA/quercetin complex; D: CagA/ponciretin complex; E: CagA/chlorogenic acid complex. Residues are represented by their one-letter code and position in the primary sequence. Chemical bonds are depicted by dashed lines, and the bond length is measured in Angstroms (Å). Only a subset of the chemical bonds are showed in the figure.
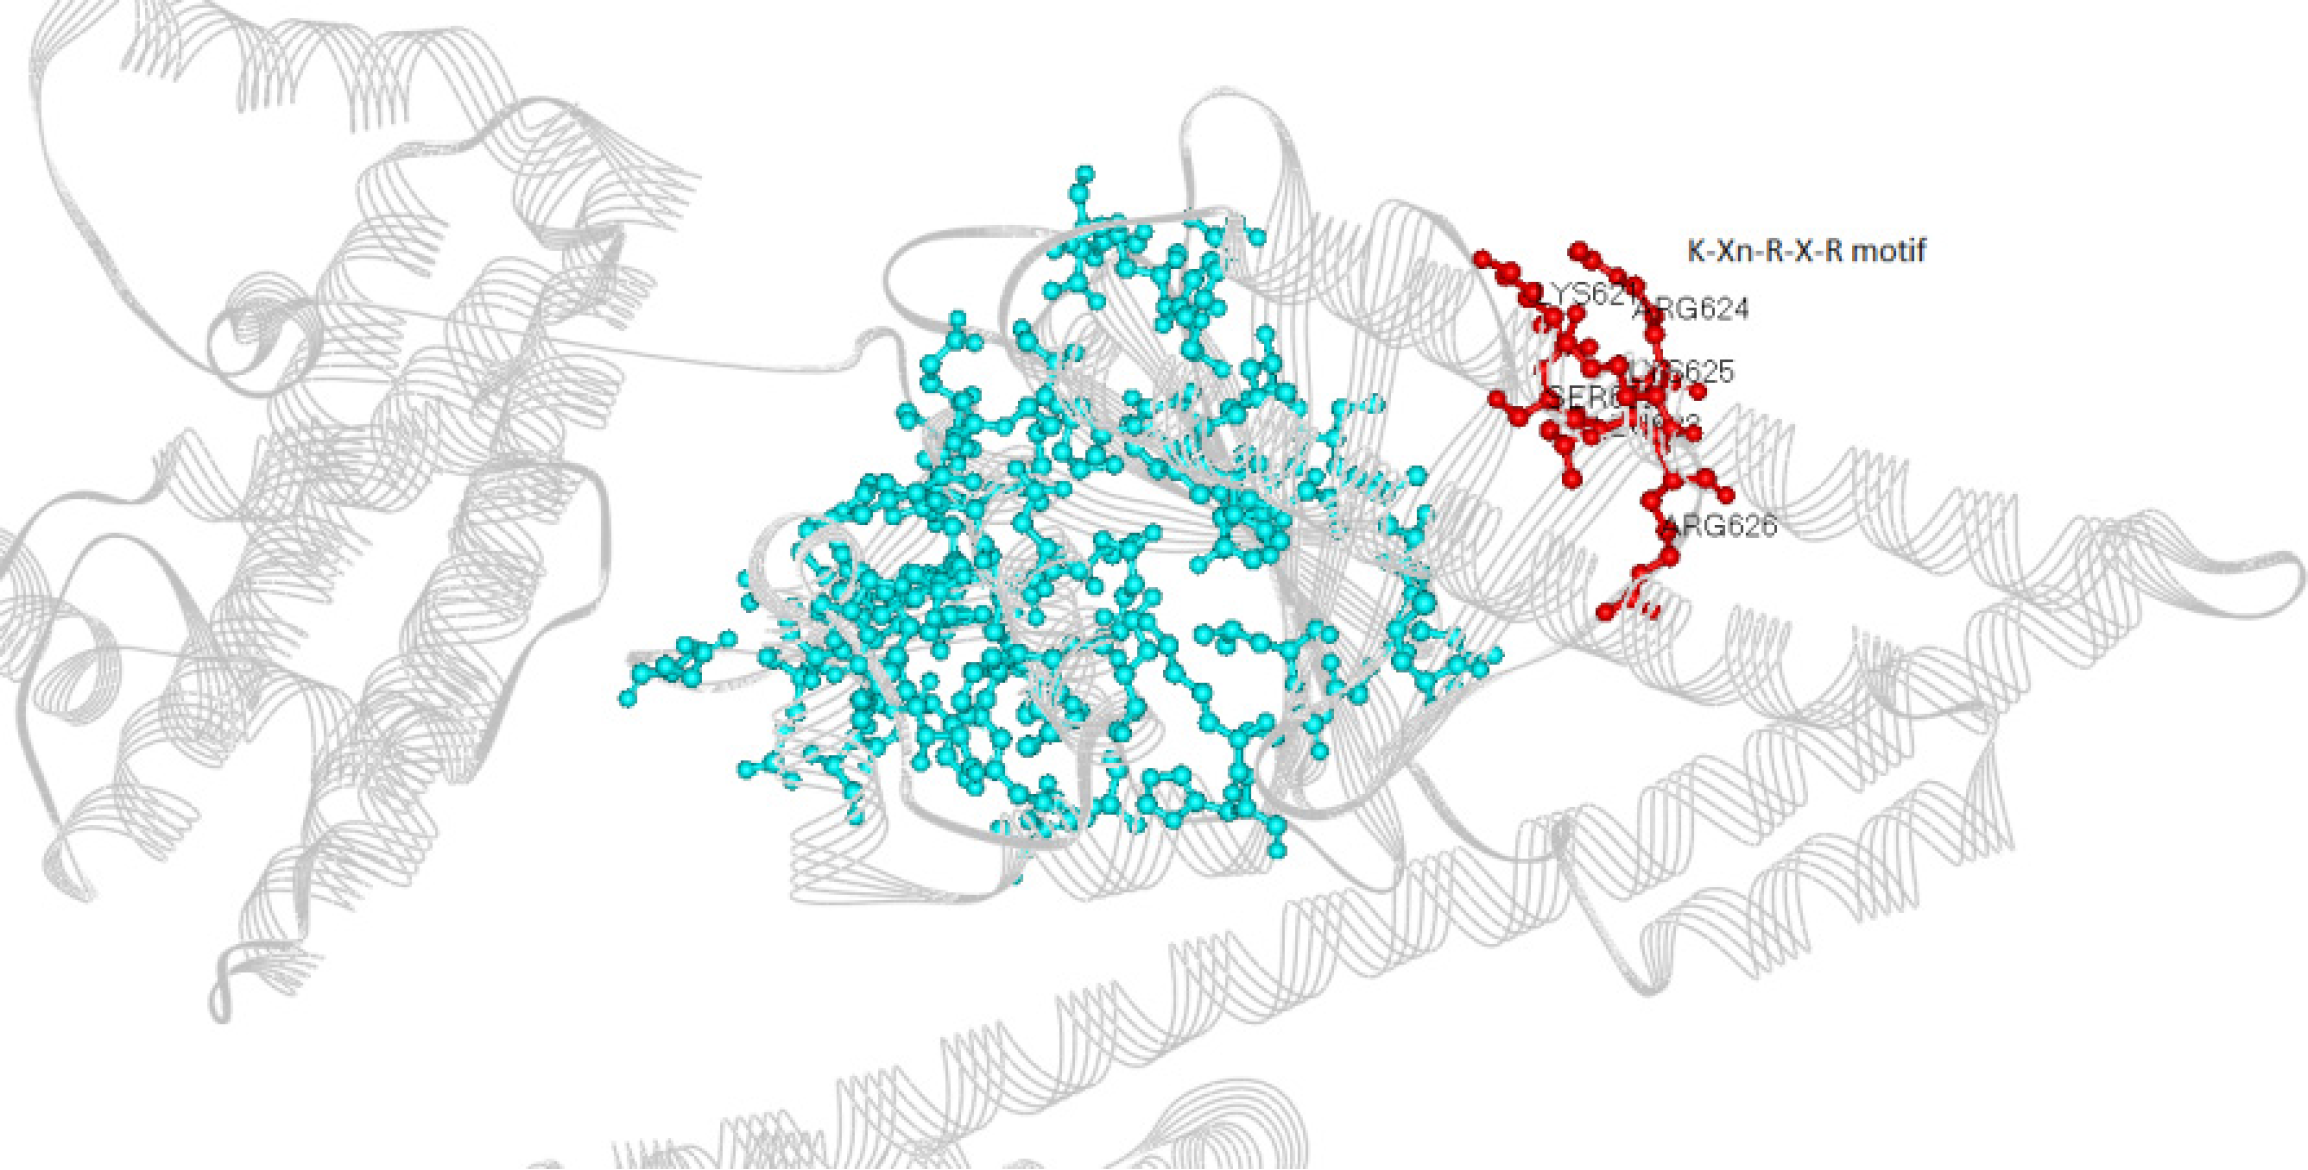
Figure 3 Localization of the K-Xn-R-X-R membrane-binding motif (621-626) and all the amino acid residues that have bound to phenolic compounds in silico.
Red: Residues of the K-Xn-R-X-R motif. Blue: Residues that have bound to phenolic compounds.
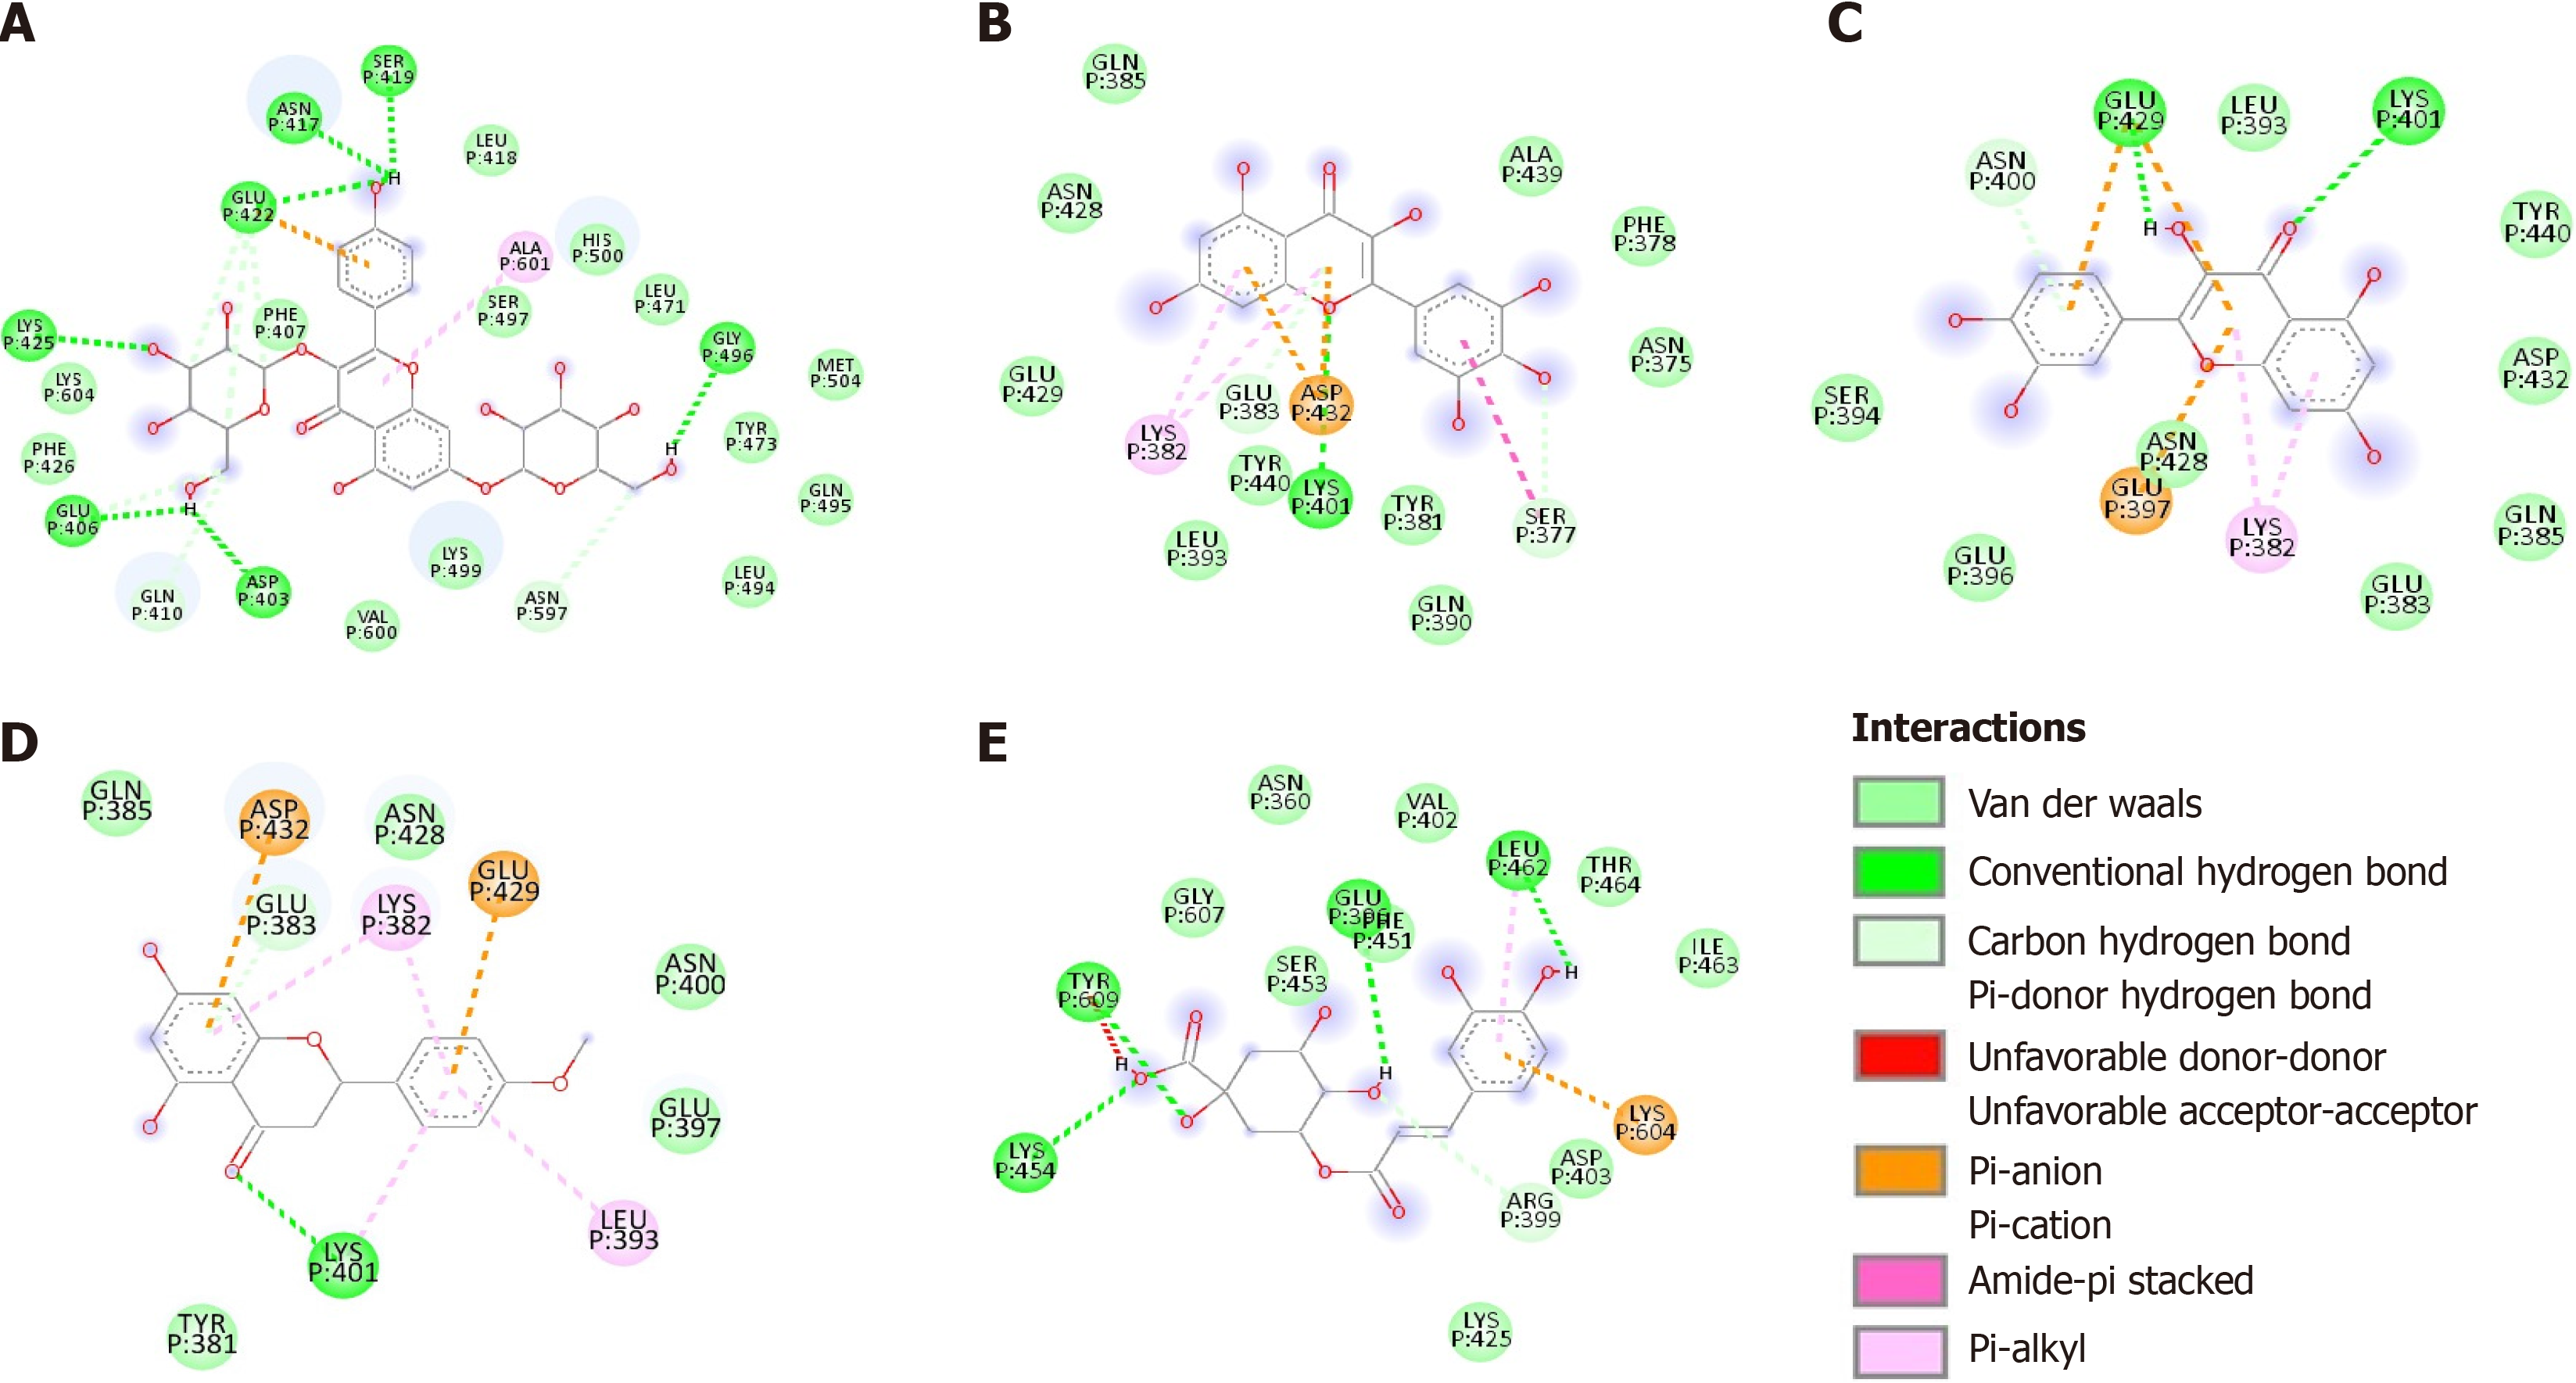
Figure 4 Two-dimensional diagram of the chemical bonds between phenolic compounds and the CagA oncoprotein.
A: Cag/kaempferol complex; B: Cag/myricetin complex; C: CagA/quercetin complex; D: CagA/ponciretin complex; E: CagA/chlorogenic acid complex. Residues are represented by three-letter codes and their positions in the primary sequence. Chemical bonds are depicted with dashed lines, except for van der Waals interactions. The internal legend indicates the type of chemical bond.
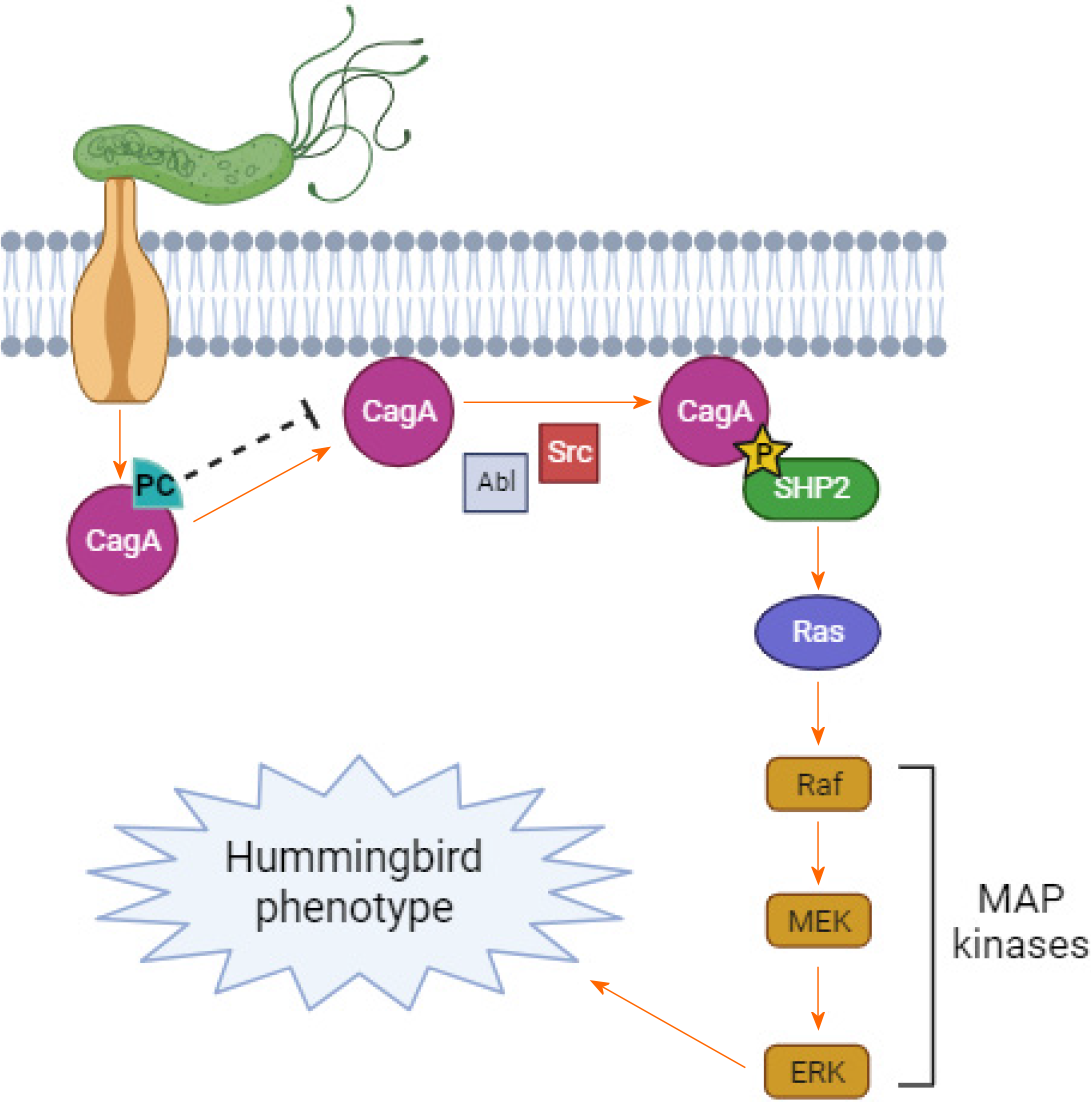
Figure 5 Proposed action of phenolic compounds on the CagA oncoprotein and the gastric epithelial cell signaling pathway.
PC: Phenolic compounds.
- Citation: Vieira RV, Peiter GC, de Melo FF, Zarpelon-Schutz AC, Teixeira KN. In silico prospective analysis of the medicinal plants activity on the CagA oncoprotein from Helicobacter pylori. World J Clin Oncol 2024; 15(5): 653-663
- URL: https://www.wjgnet.com/2218-4333/full/v15/i5/653.htm
- DOI: https://dx.doi.org/10.5306/wjco.v15.i5.653


