Copyright
©The Author(s) 2024.
World J Clin Oncol. Mar 24, 2024; 15(3): 391-410
Published online Mar 24, 2024. doi: 10.5306/wjco.v15.i3.391
Published online Mar 24, 2024. doi: 10.5306/wjco.v15.i3.391
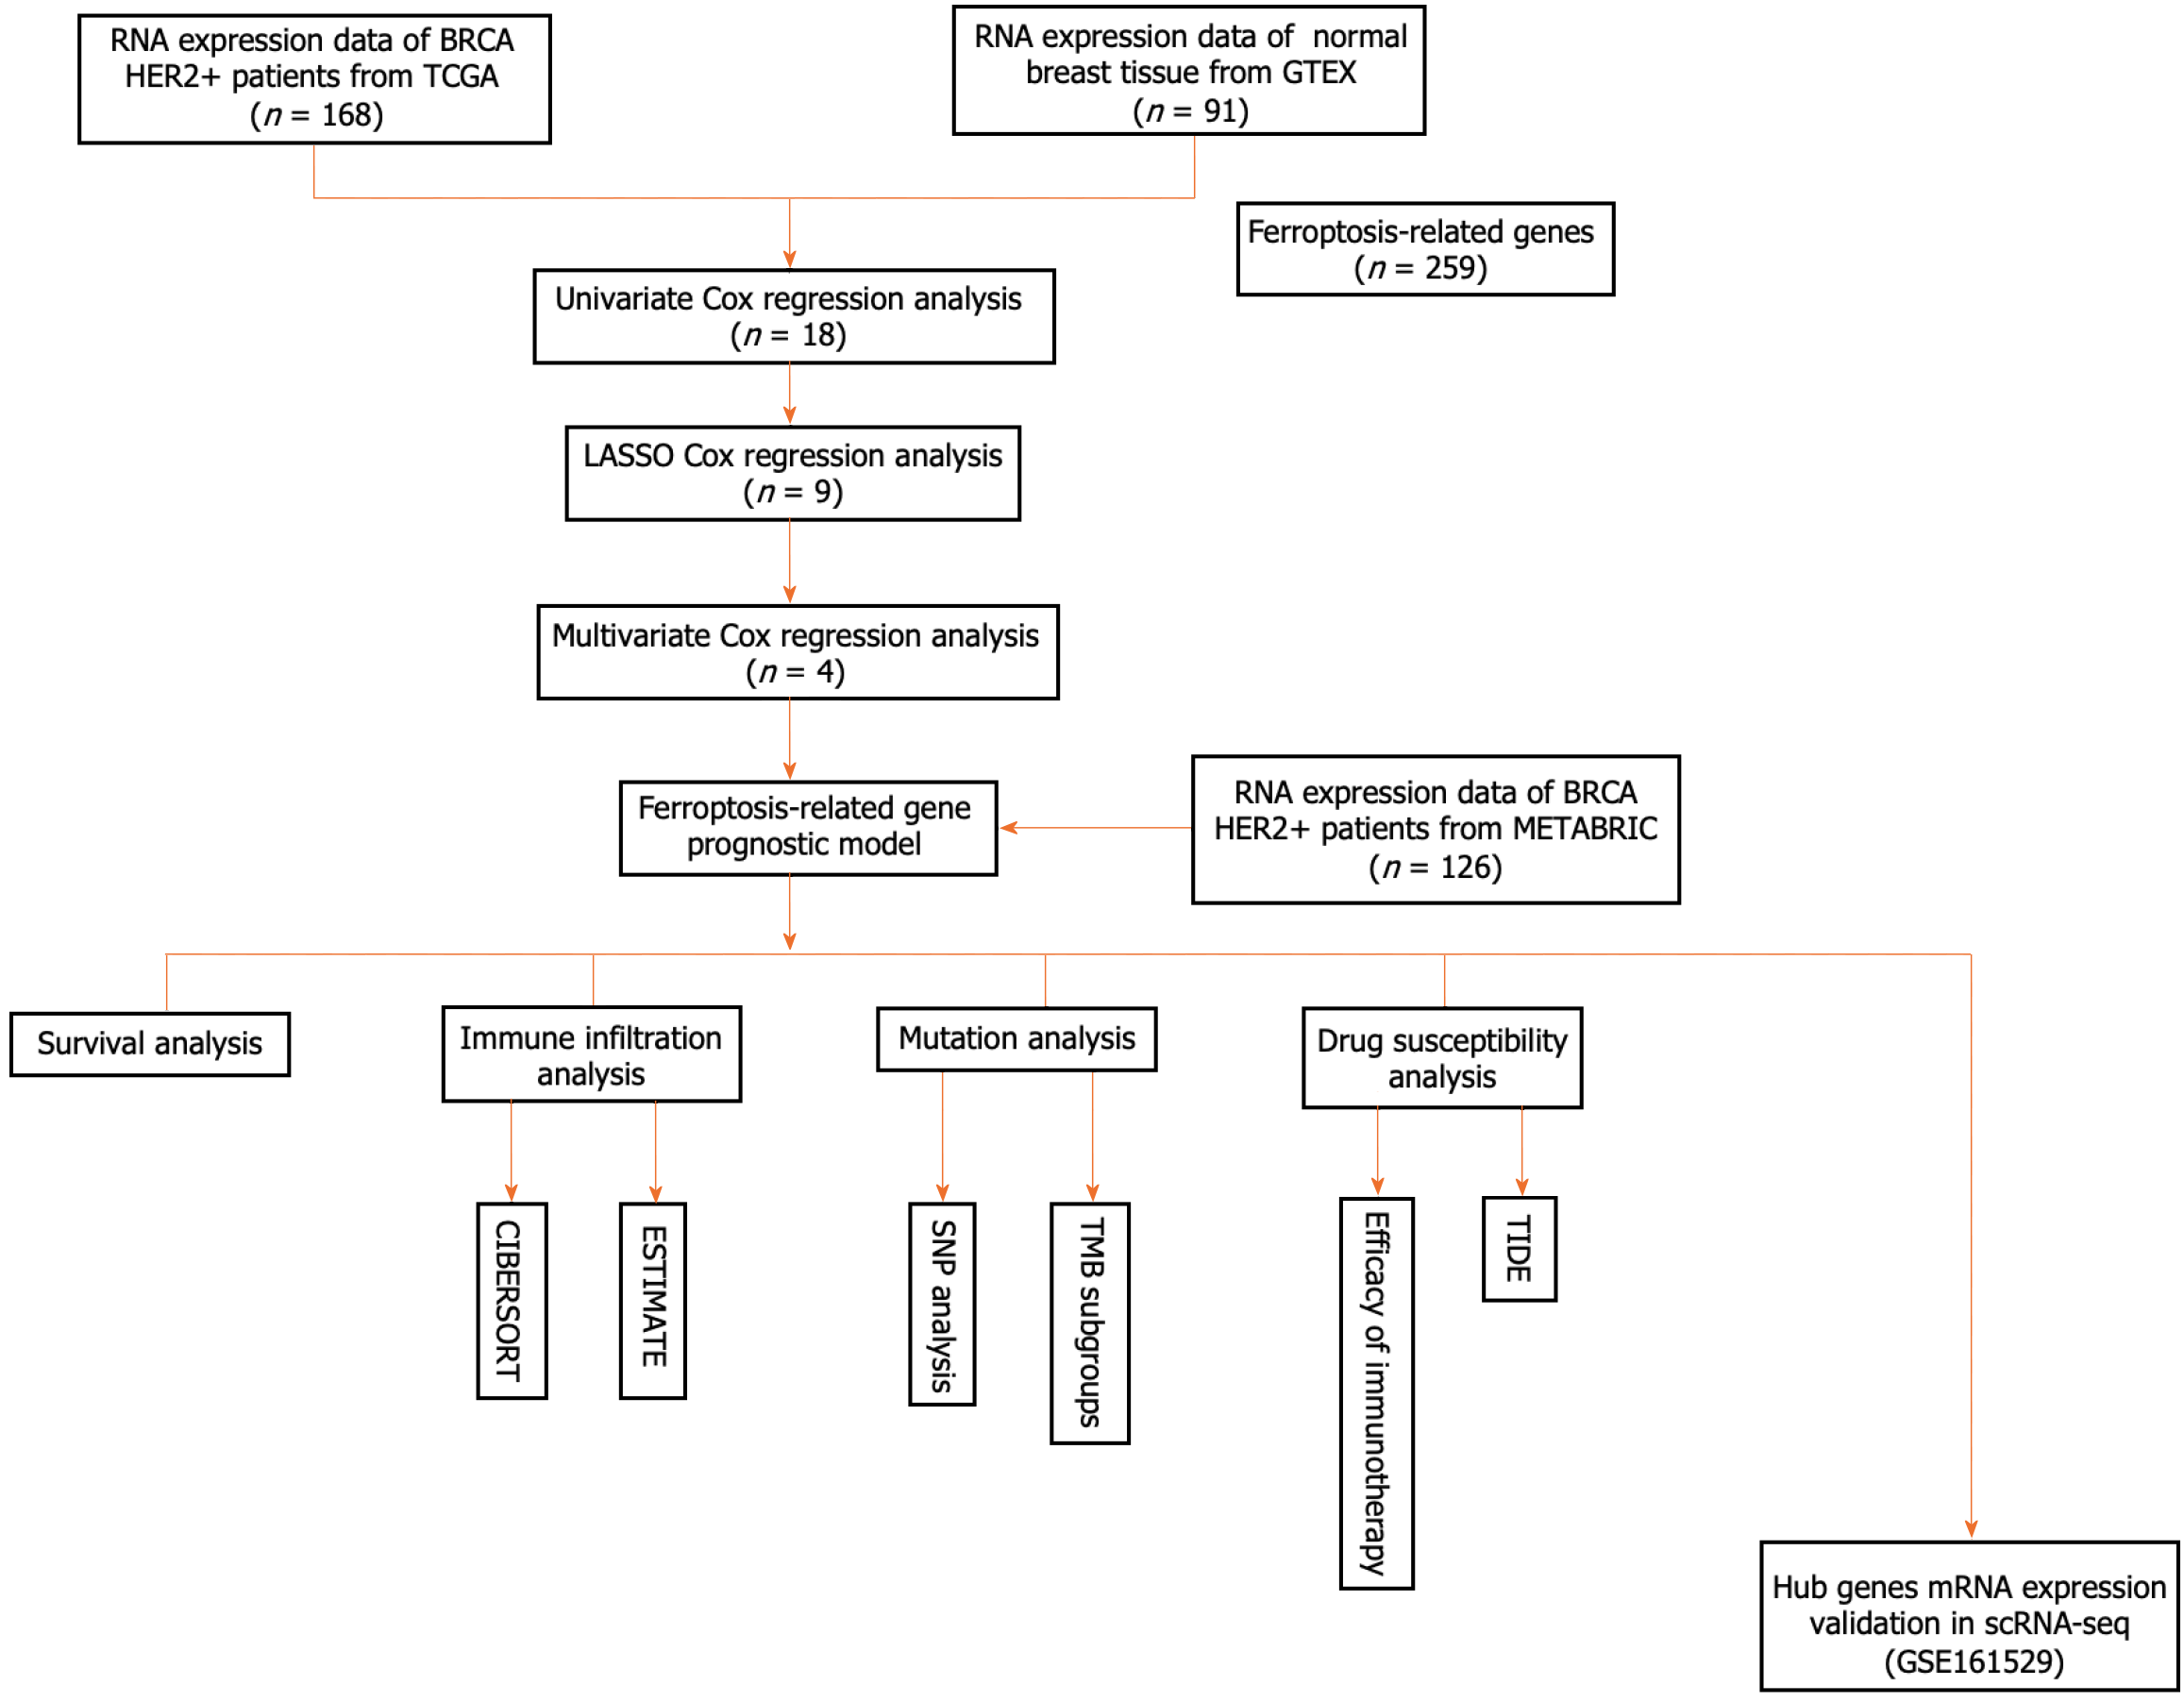
Figure 1 Flowchart for collecting and analyzing data from TCGA and METABRIC databases.
scRNA-seq: Single-cell RNA sequencing; TMB: Tumor mutation burden.
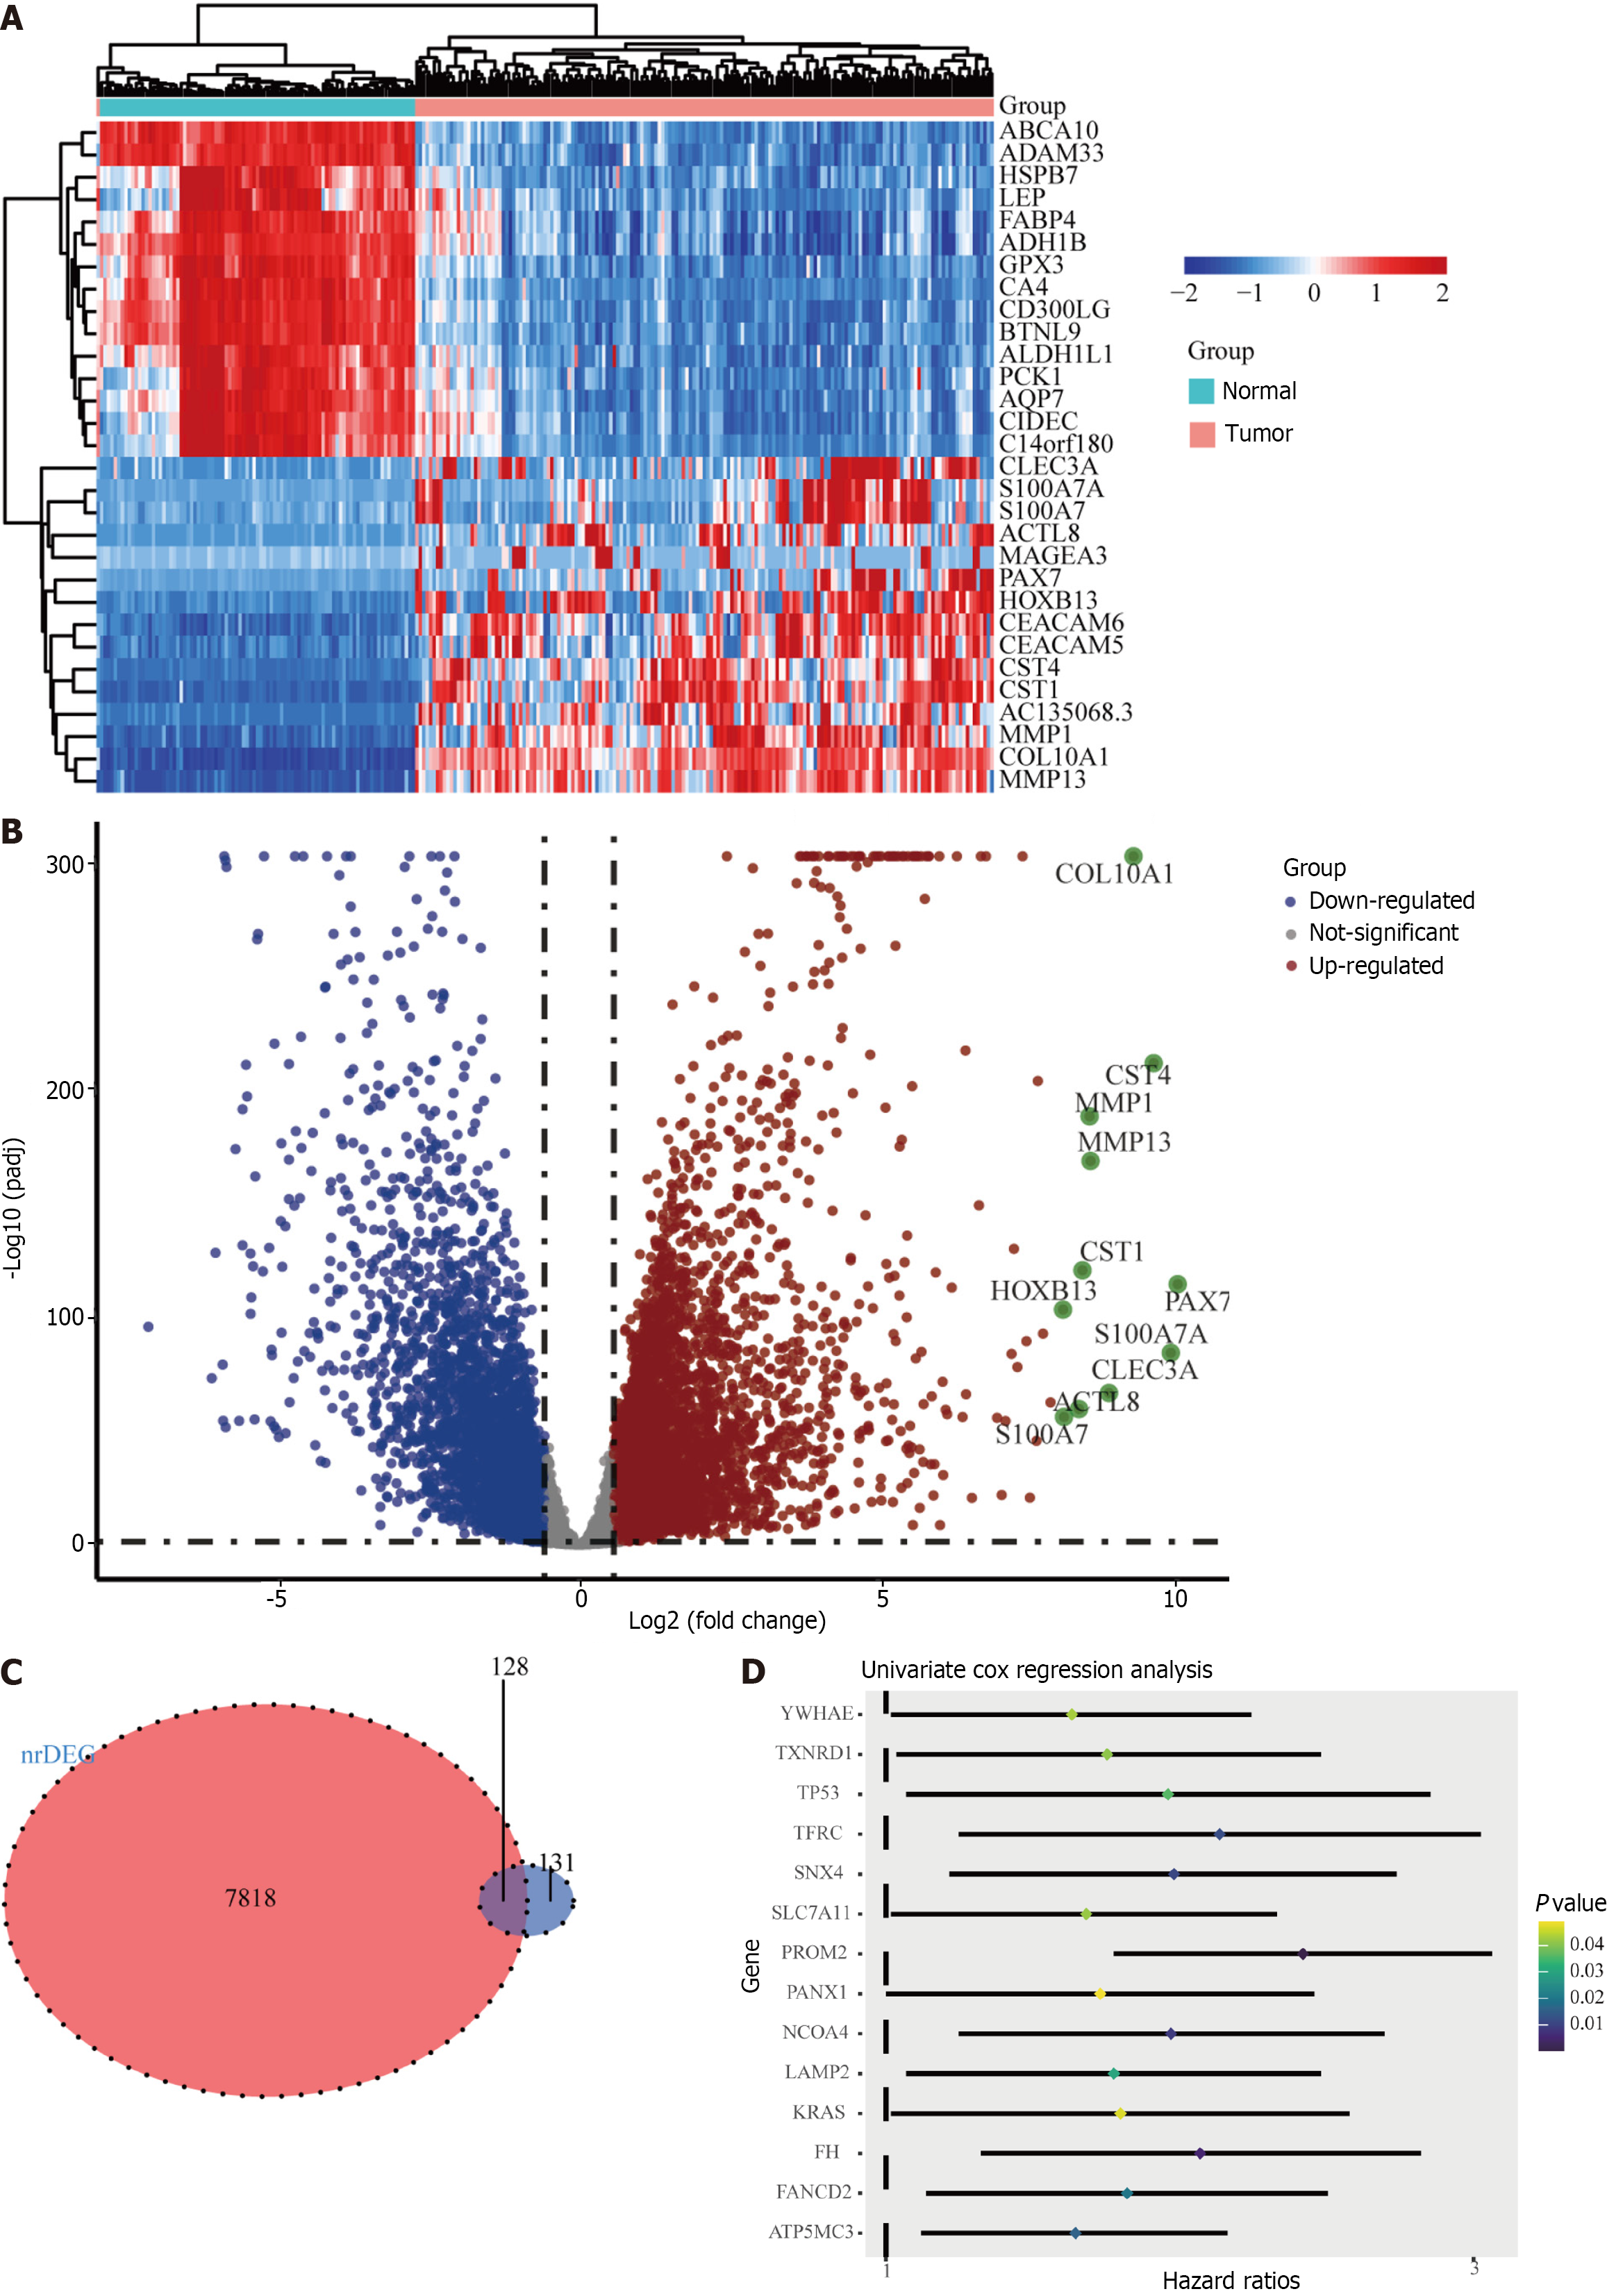
Figure 2 Identification of candidate genes associated with ferroptosis in the TCGA cohort.
A: Heatmap of candidate gene expression differences between tumor and normal tissues; B: Volcano map showing up-regulated and down-regulated genes; C: A Venn diagram to identify differentially expressed genes associated with ferroptosis between tumor and normal tissues; D: Forest plot showing univariate Cox regression analysis results of correlation between candidate gene expression and overall survival.
Figure 3 Prognostic analysis of four ferroptosis-related gene signature models in the TCGA cohort.
A: The optimal lambda resulted in nine nonzero coefficients; B: The partial likelihood deviation curve was plotted vs lambda; C: Risk curves were plotted in the TCGA cohort; D: Kaplan–Meier curves for the overall survival of patients in the high-risk and low-risk groups in the TCGA cohort; E: The area under the curves of time-dependent receiver operating characteristic curves verified the prognostic performance of the risk score in the TCGA cohort; F: T-SNE analysis of the TCGA cohort. OS: Overall survival.
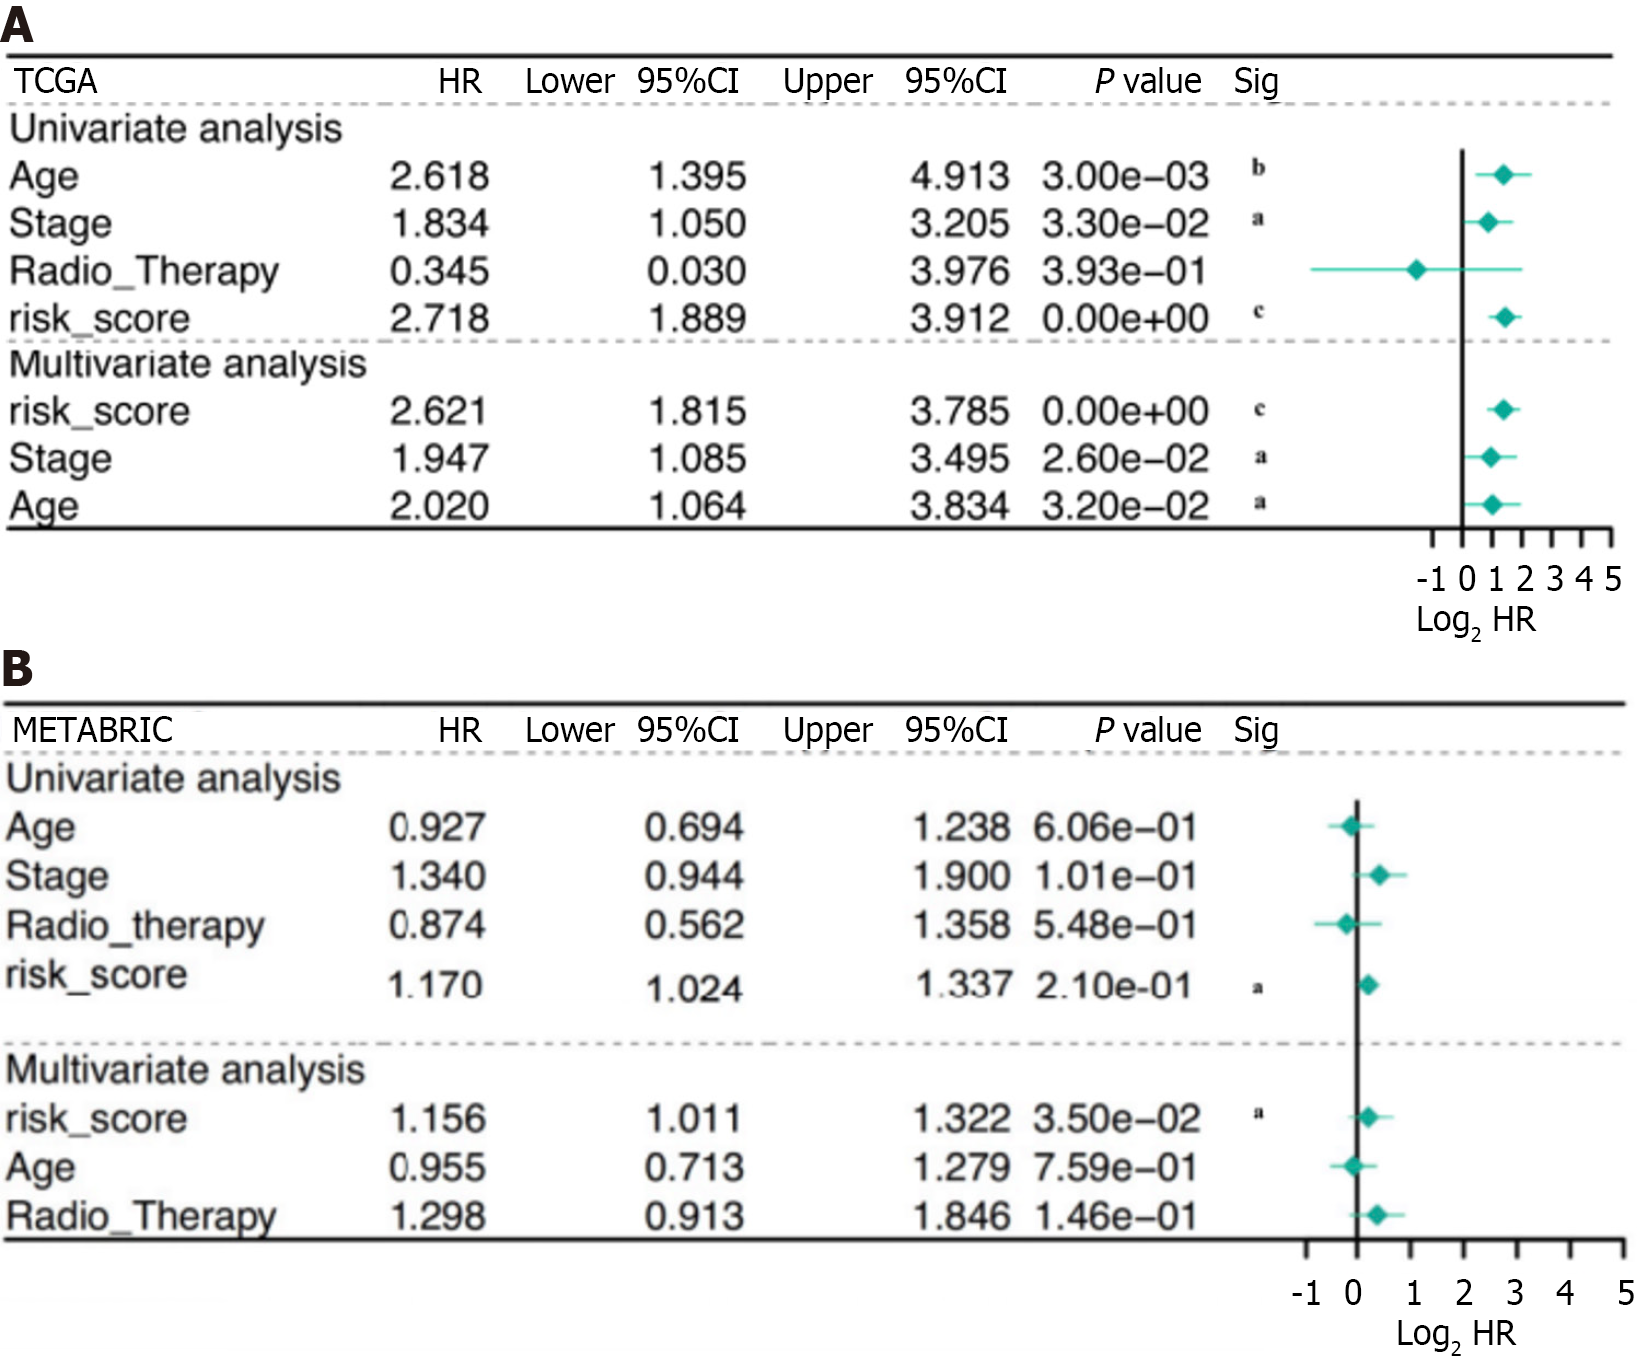
Figure 4 Results of univariate and multivariate Cox regression analyses.
A: Results of the univariate and multivariate Cox analyses of overall survival (OS) in the TCGA derivation cohort; B: Results of univariate and multivariate Cox analyses of OS in the METABRIC derivation cohort. aP < 0.05, bP < 0.01, cP < 0.001. HR: Hazard ratio.
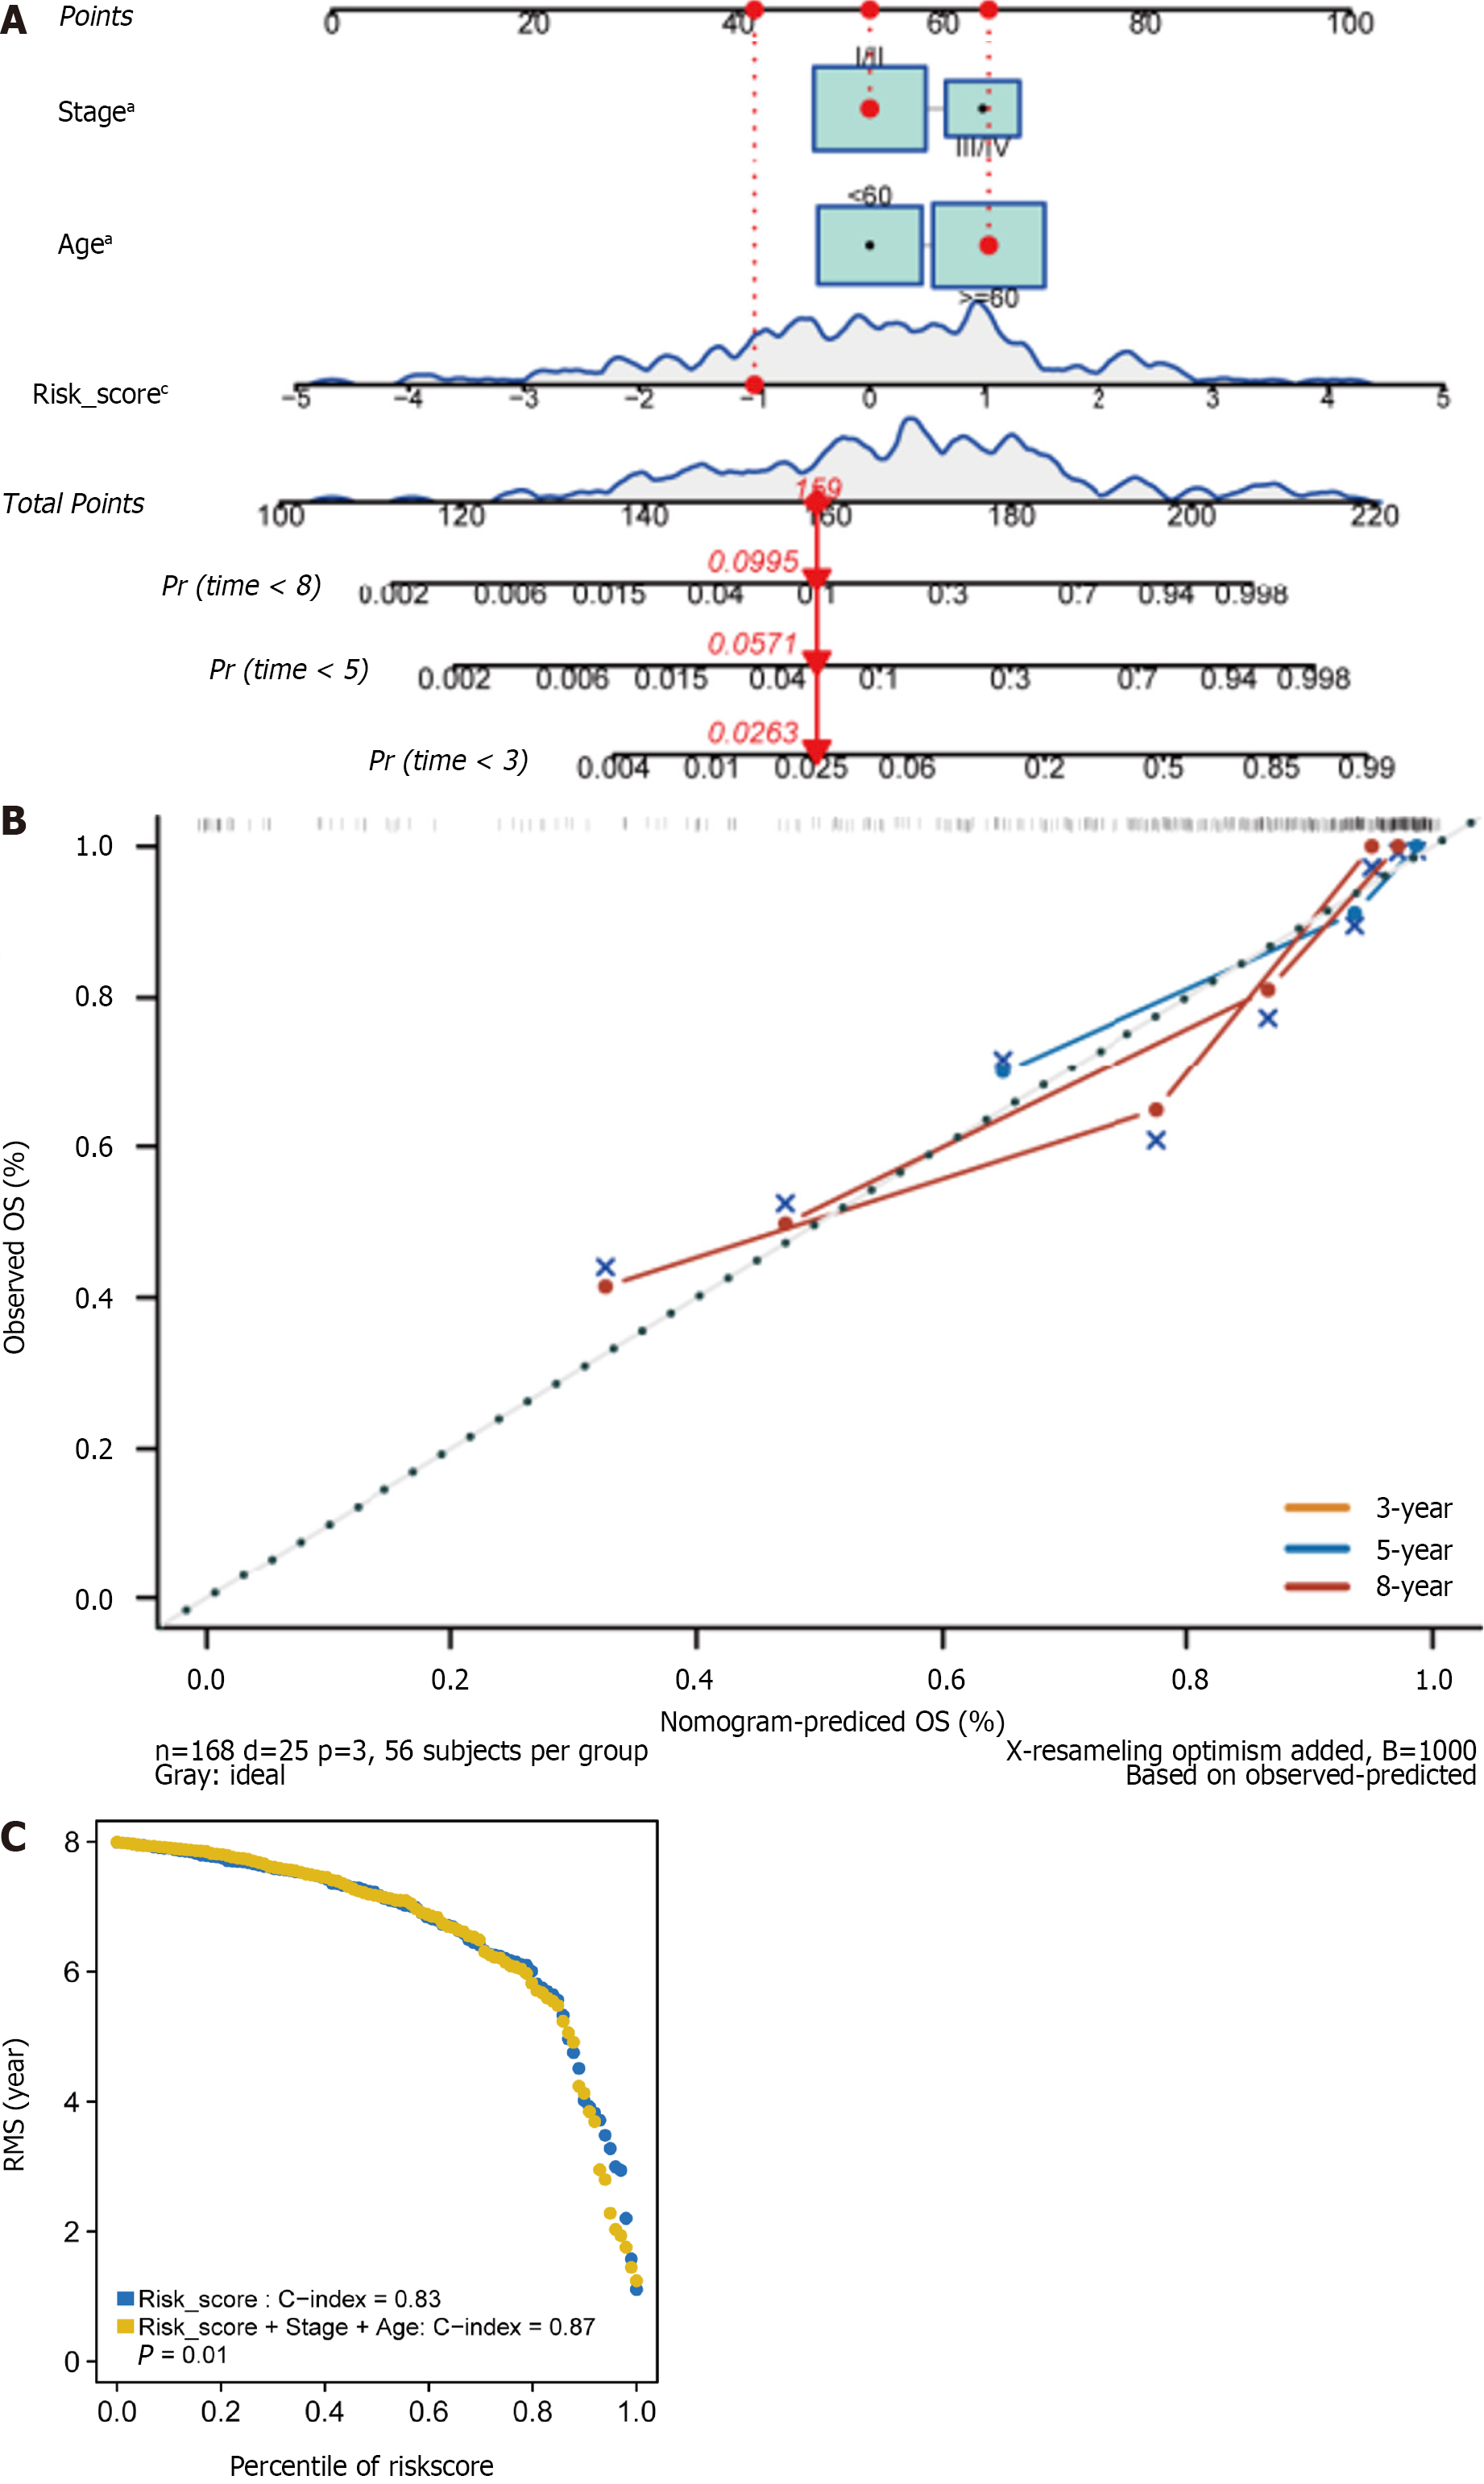
Figure 5 The four ferroptosis-related prognostic gene signature models for predicting 3-, 5-, and 8-year overall survival in HER2+ breast cancer patients.
A: Independent risk factors were used to build a risk estimation nomogram to predict the probability of overall survival in HER2+ breast cancer patients; B: Calibration plots for 3-, 5-, and 8-year survival probabilities in the TCGA cohort; C: Restricted mean survival time Curve in the TCGA cohort. aP < 0.05, bP < 0.01, cP < 0.001. OS: Overall survival; RMS time: Restricted mean survival time.
Figure 6 The immune-related analysis of the four ferroptosis-related prognostic gene signature models in HER2+ breast cancer.
A: The Immune cells infiltration of differential risk groups in TCGA; B: Heatmaps represent the correlation between immune cells and prognostic genes; C-E: The immune, stromal, and estimate scores were significantly distinct statistically between low- and high-risk subgroups; F: Expression of immune cell pathways in low- and high-risk subgroups; G:The seven well-known immune checkpoint genes were differentially expressed between low- and high-risk subgroups; H: Correlation chord diagram of 7 immune checkpoints. aP < 0.05, bP < 0.01, cP < 0.001.
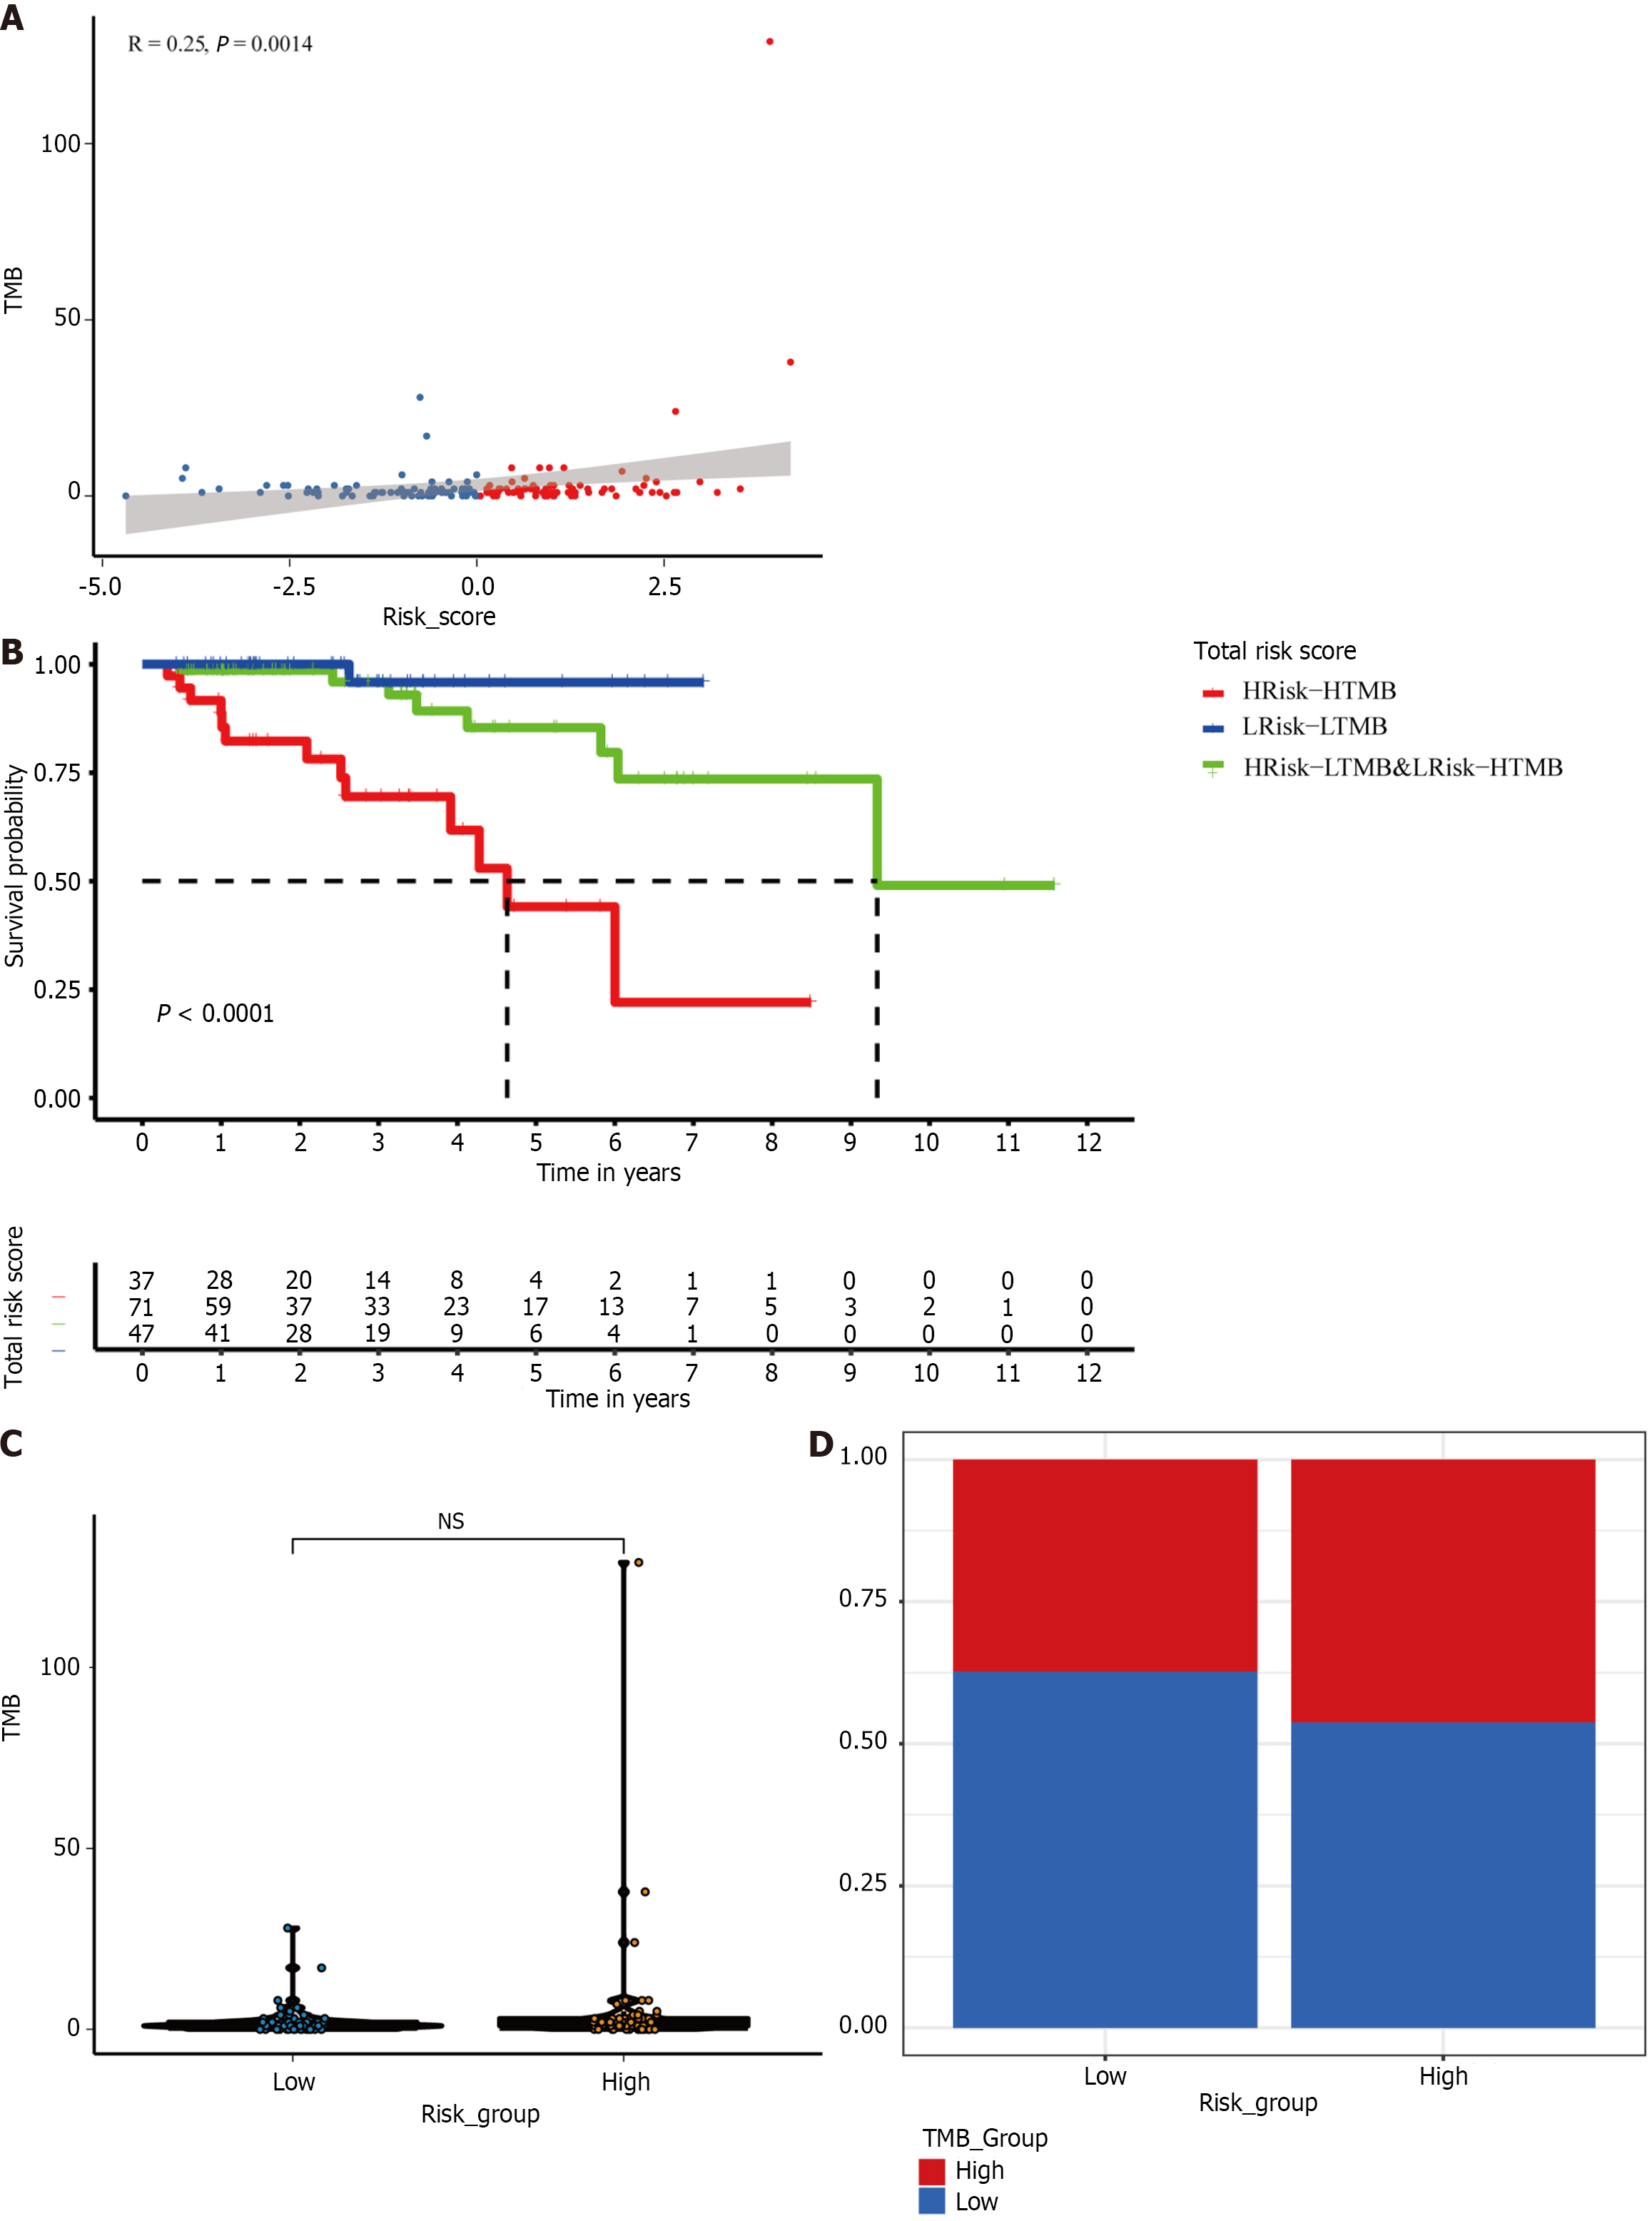
Figure 7 The mutation profile of different subgroups in the TCGA cohort.
A: Relationship between tumor mutation burden (TMB) and risk scores; B: Relationship between TMB groups and risk groups; C: TMB in low- and high-risk subgroups; D: Kaplan–Meier survival analysis of a new subset in a cohort of HER2+ breast cancer patients combined with the risk group and TMB. TMB: Tumor mutation burden; NS: Not significant; BC: Breast cancer.
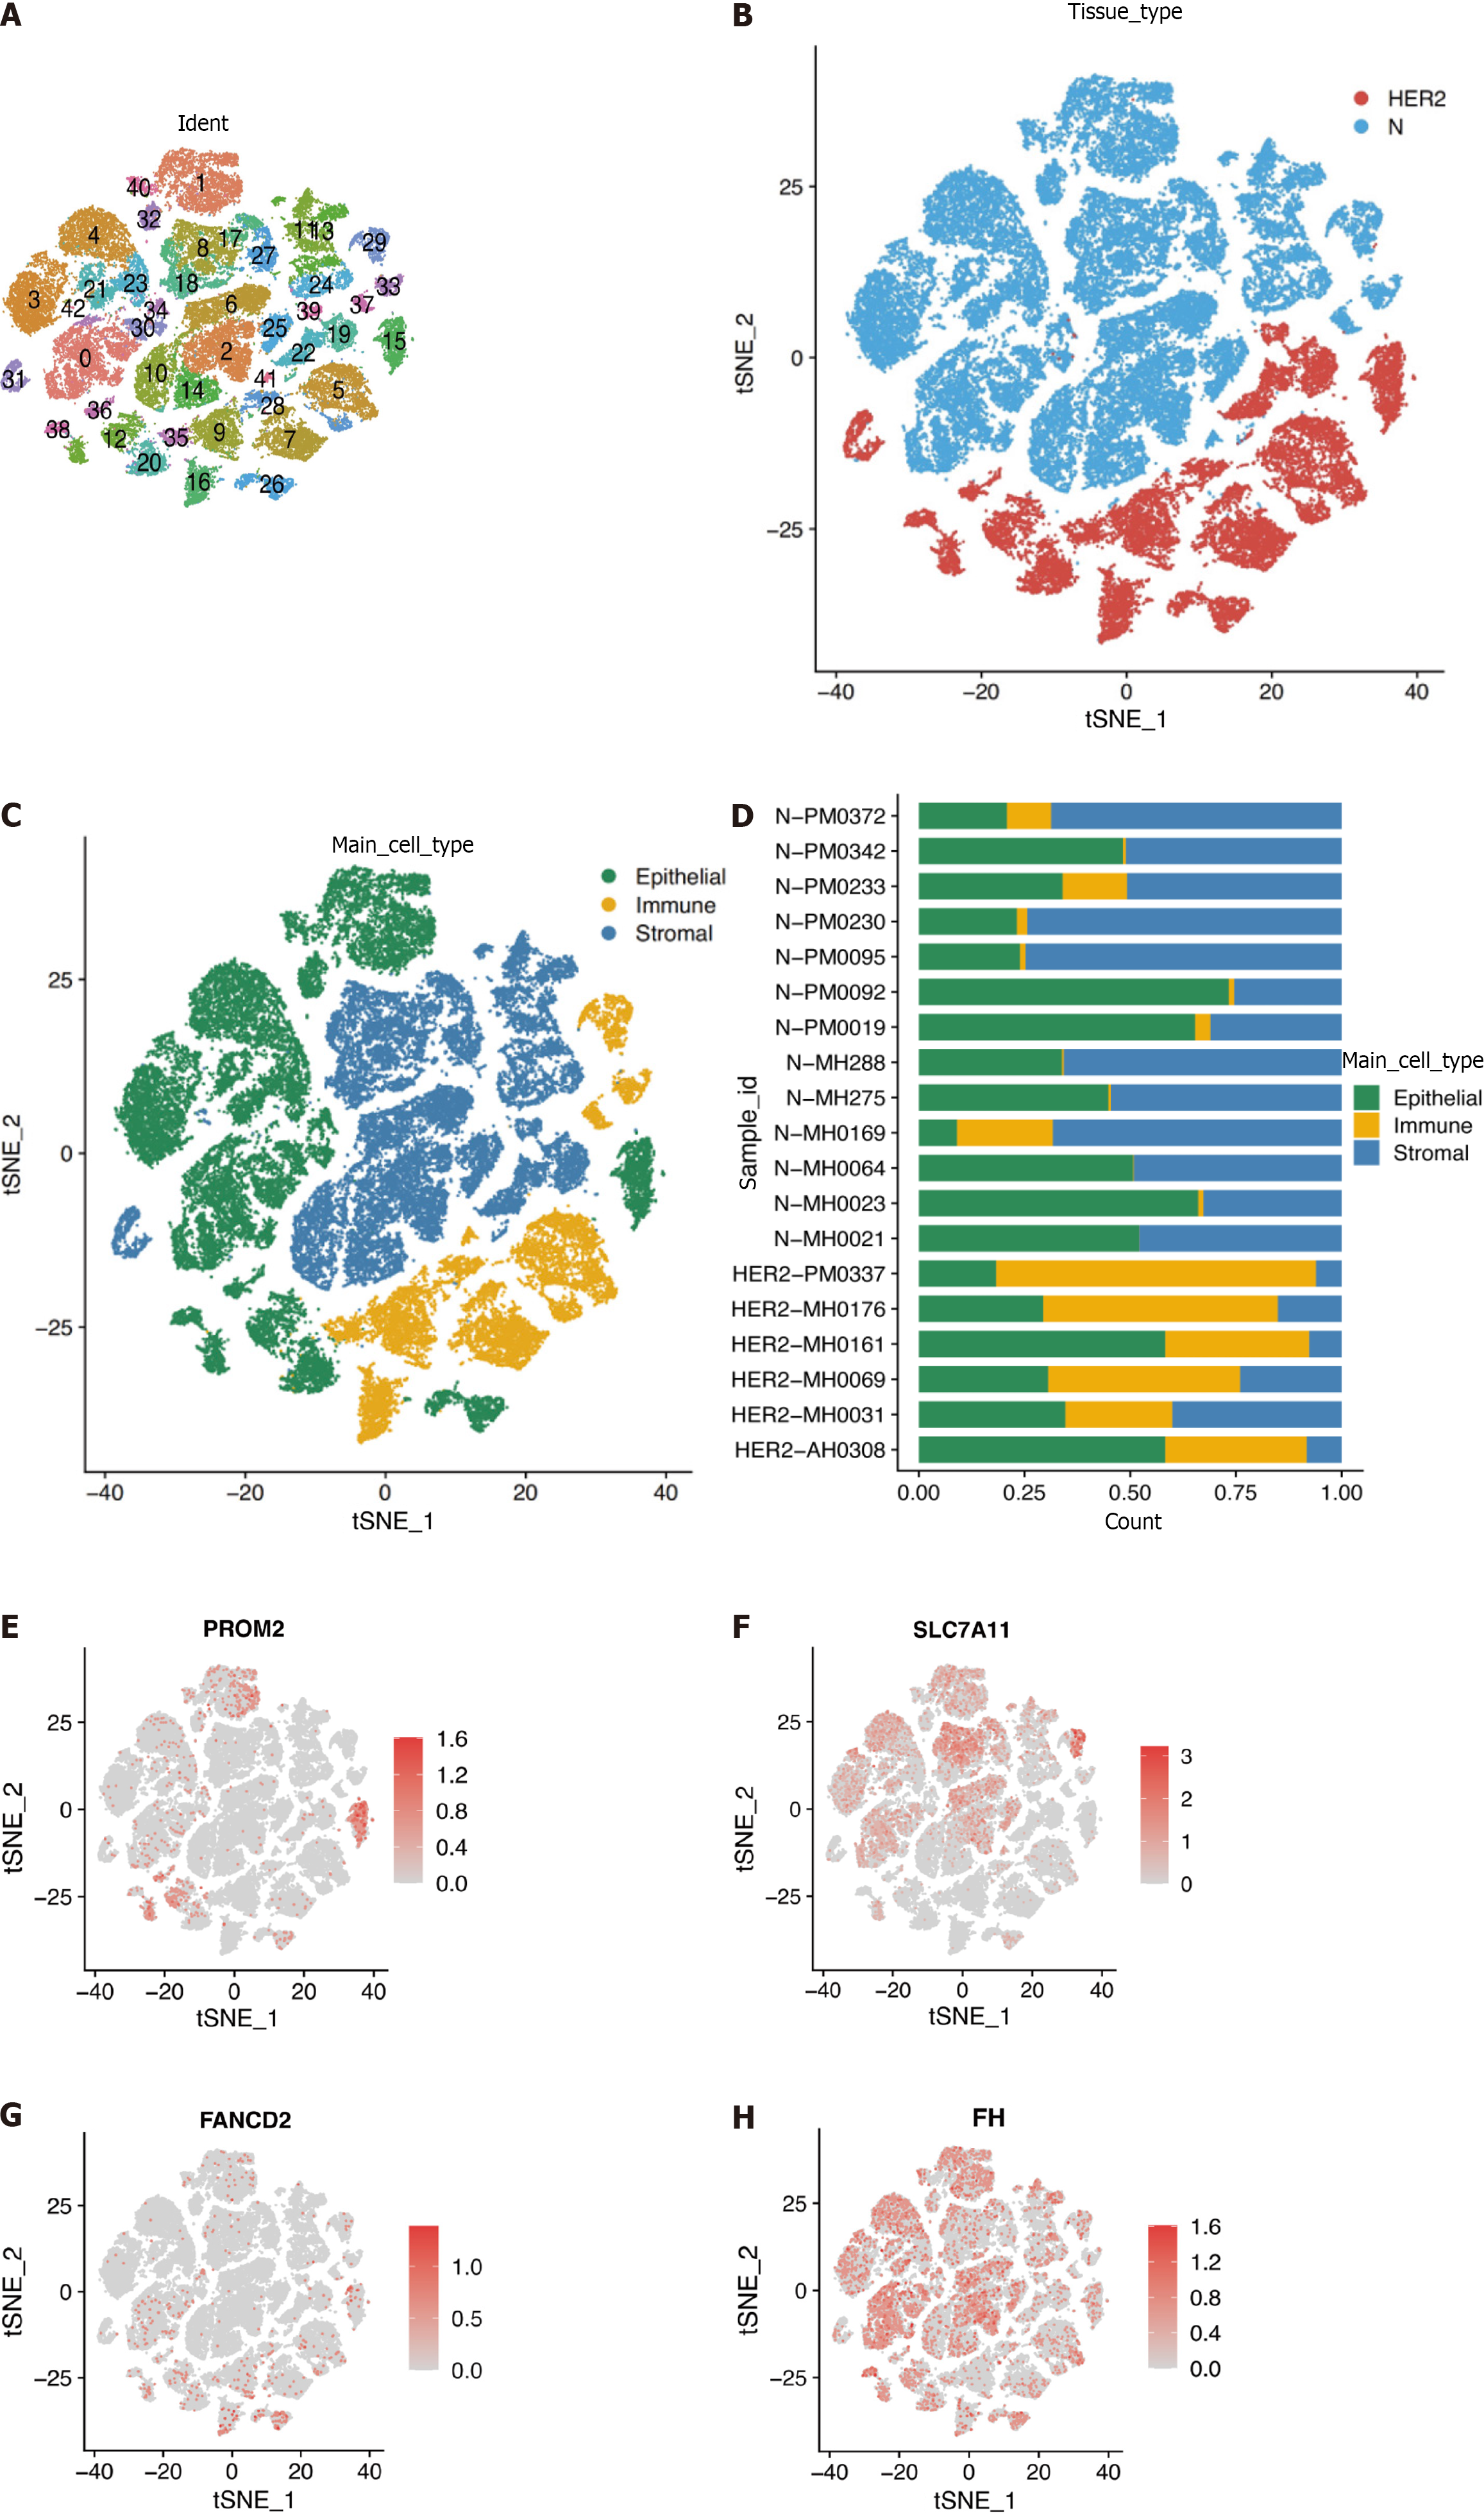
Figure 8 Overview of single cells from tumor samples and standard samples.
A: Umap of 42 cell clusters; B: Umap of two different types of samples; C: Marker genes identified cell types; D: Proportion of cell types in patients' and normal people's samples; E-H: Expression of essential marker genes.
- Citation: Shi JY, Che X, Wen R, Hou SJ, Xi YJ, Feng YQ, Wang LX, Liu SJ, Lv WH, Zhang YF. Ferroptosis biomarkers predict tumor mutation burden's impact on prognosis in HER2-positive breast cancer. World J Clin Oncol 2024; 15(3): 391-410
- URL: https://www.wjgnet.com/2218-4333/full/v15/i3/391.htm
- DOI: https://dx.doi.org/10.5306/wjco.v15.i3.391


