Copyright
©The Author(s) 2024.
World J Clin Oncol. Jan 24, 2024; 15(1): 115-129
Published online Jan 24, 2024. doi: 10.5306/wjco.v15.i1.115
Published online Jan 24, 2024. doi: 10.5306/wjco.v15.i1.115
Figure 1 Identification of hub targets and the Kyoto Encyclopedia of Genes and Genomes pathways.
A: Venn diagram illustrating overlap of targets between GSE16558 and GSE116294 datasets; B: Target protein–protein interaction (PPI) network; C: Top 15 hub genes identified using CytoHubba plugin; D: Two primary clusters of PPI scored using themolecular complex detection plugin; E: Ranking of top 10 hub genes within PPI network; F: The Kyoto Encyclopedia of Genes and Genomes pathway enrichment analysis; G: Gene Set Enrichment Analysis of nuclear factor -κB signaling pathway. NK: Nuclear factor.
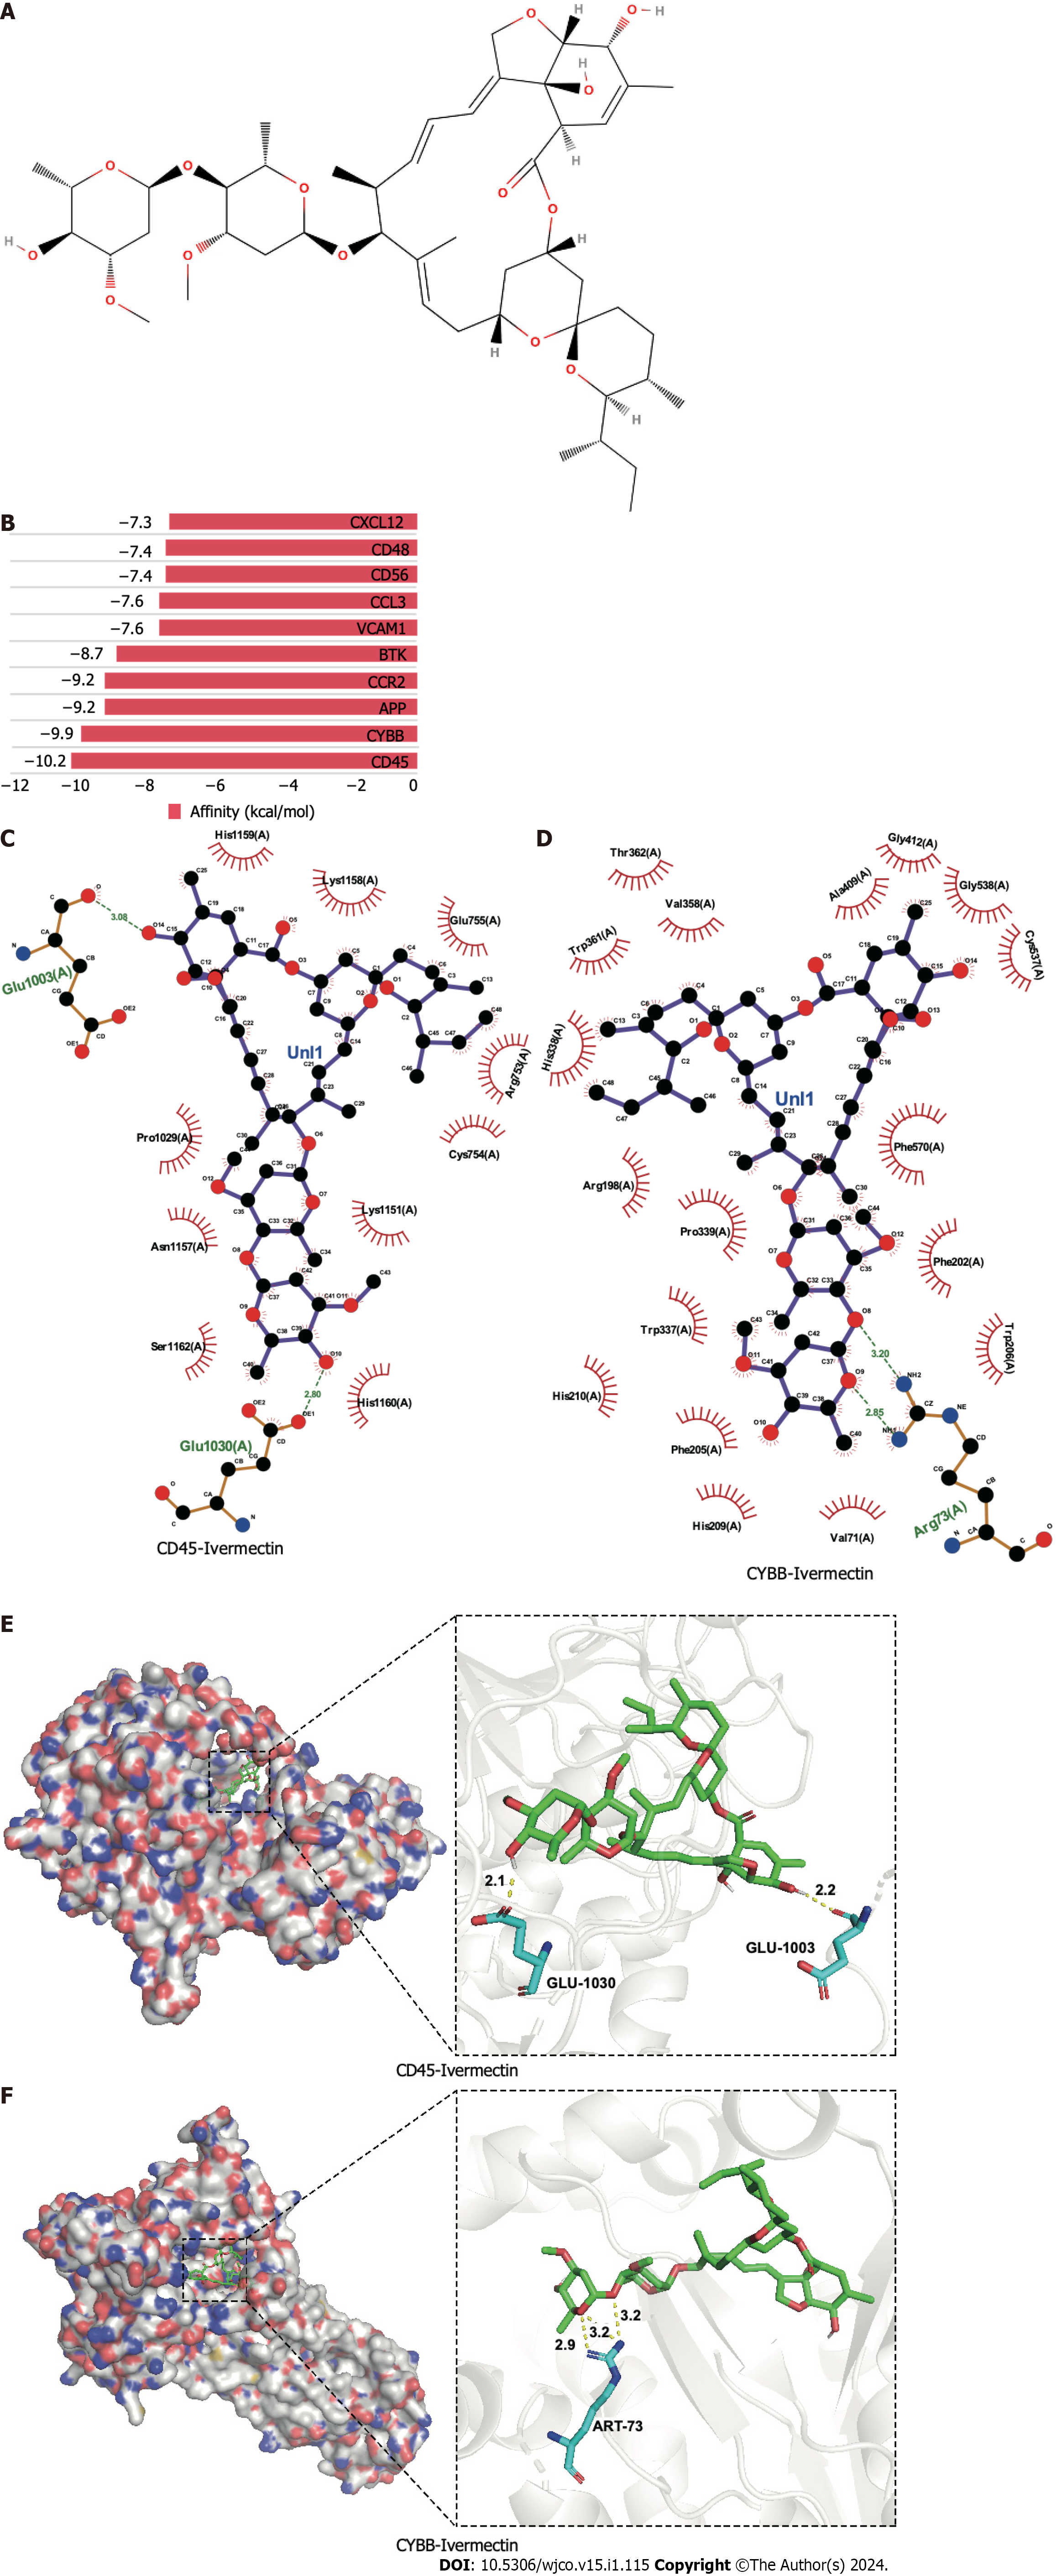
Figure 2 Molecular docking analysis of ivermectin with hub target genes.
A: Chemical structure of ivermectin; B: Binding affinity of ivermectin with the top 10 hub- target genes. A longer bar indicates a lower binding affinity; C: 2D interaction diagrams of ivermectin with CYBB; D: 2D interaction diagrams of ivermectin with CD45; E: 3D docking structures and interactions of ivermectin with CD45; F: 3D docking structures and interactions of ivermectin with CYBB.
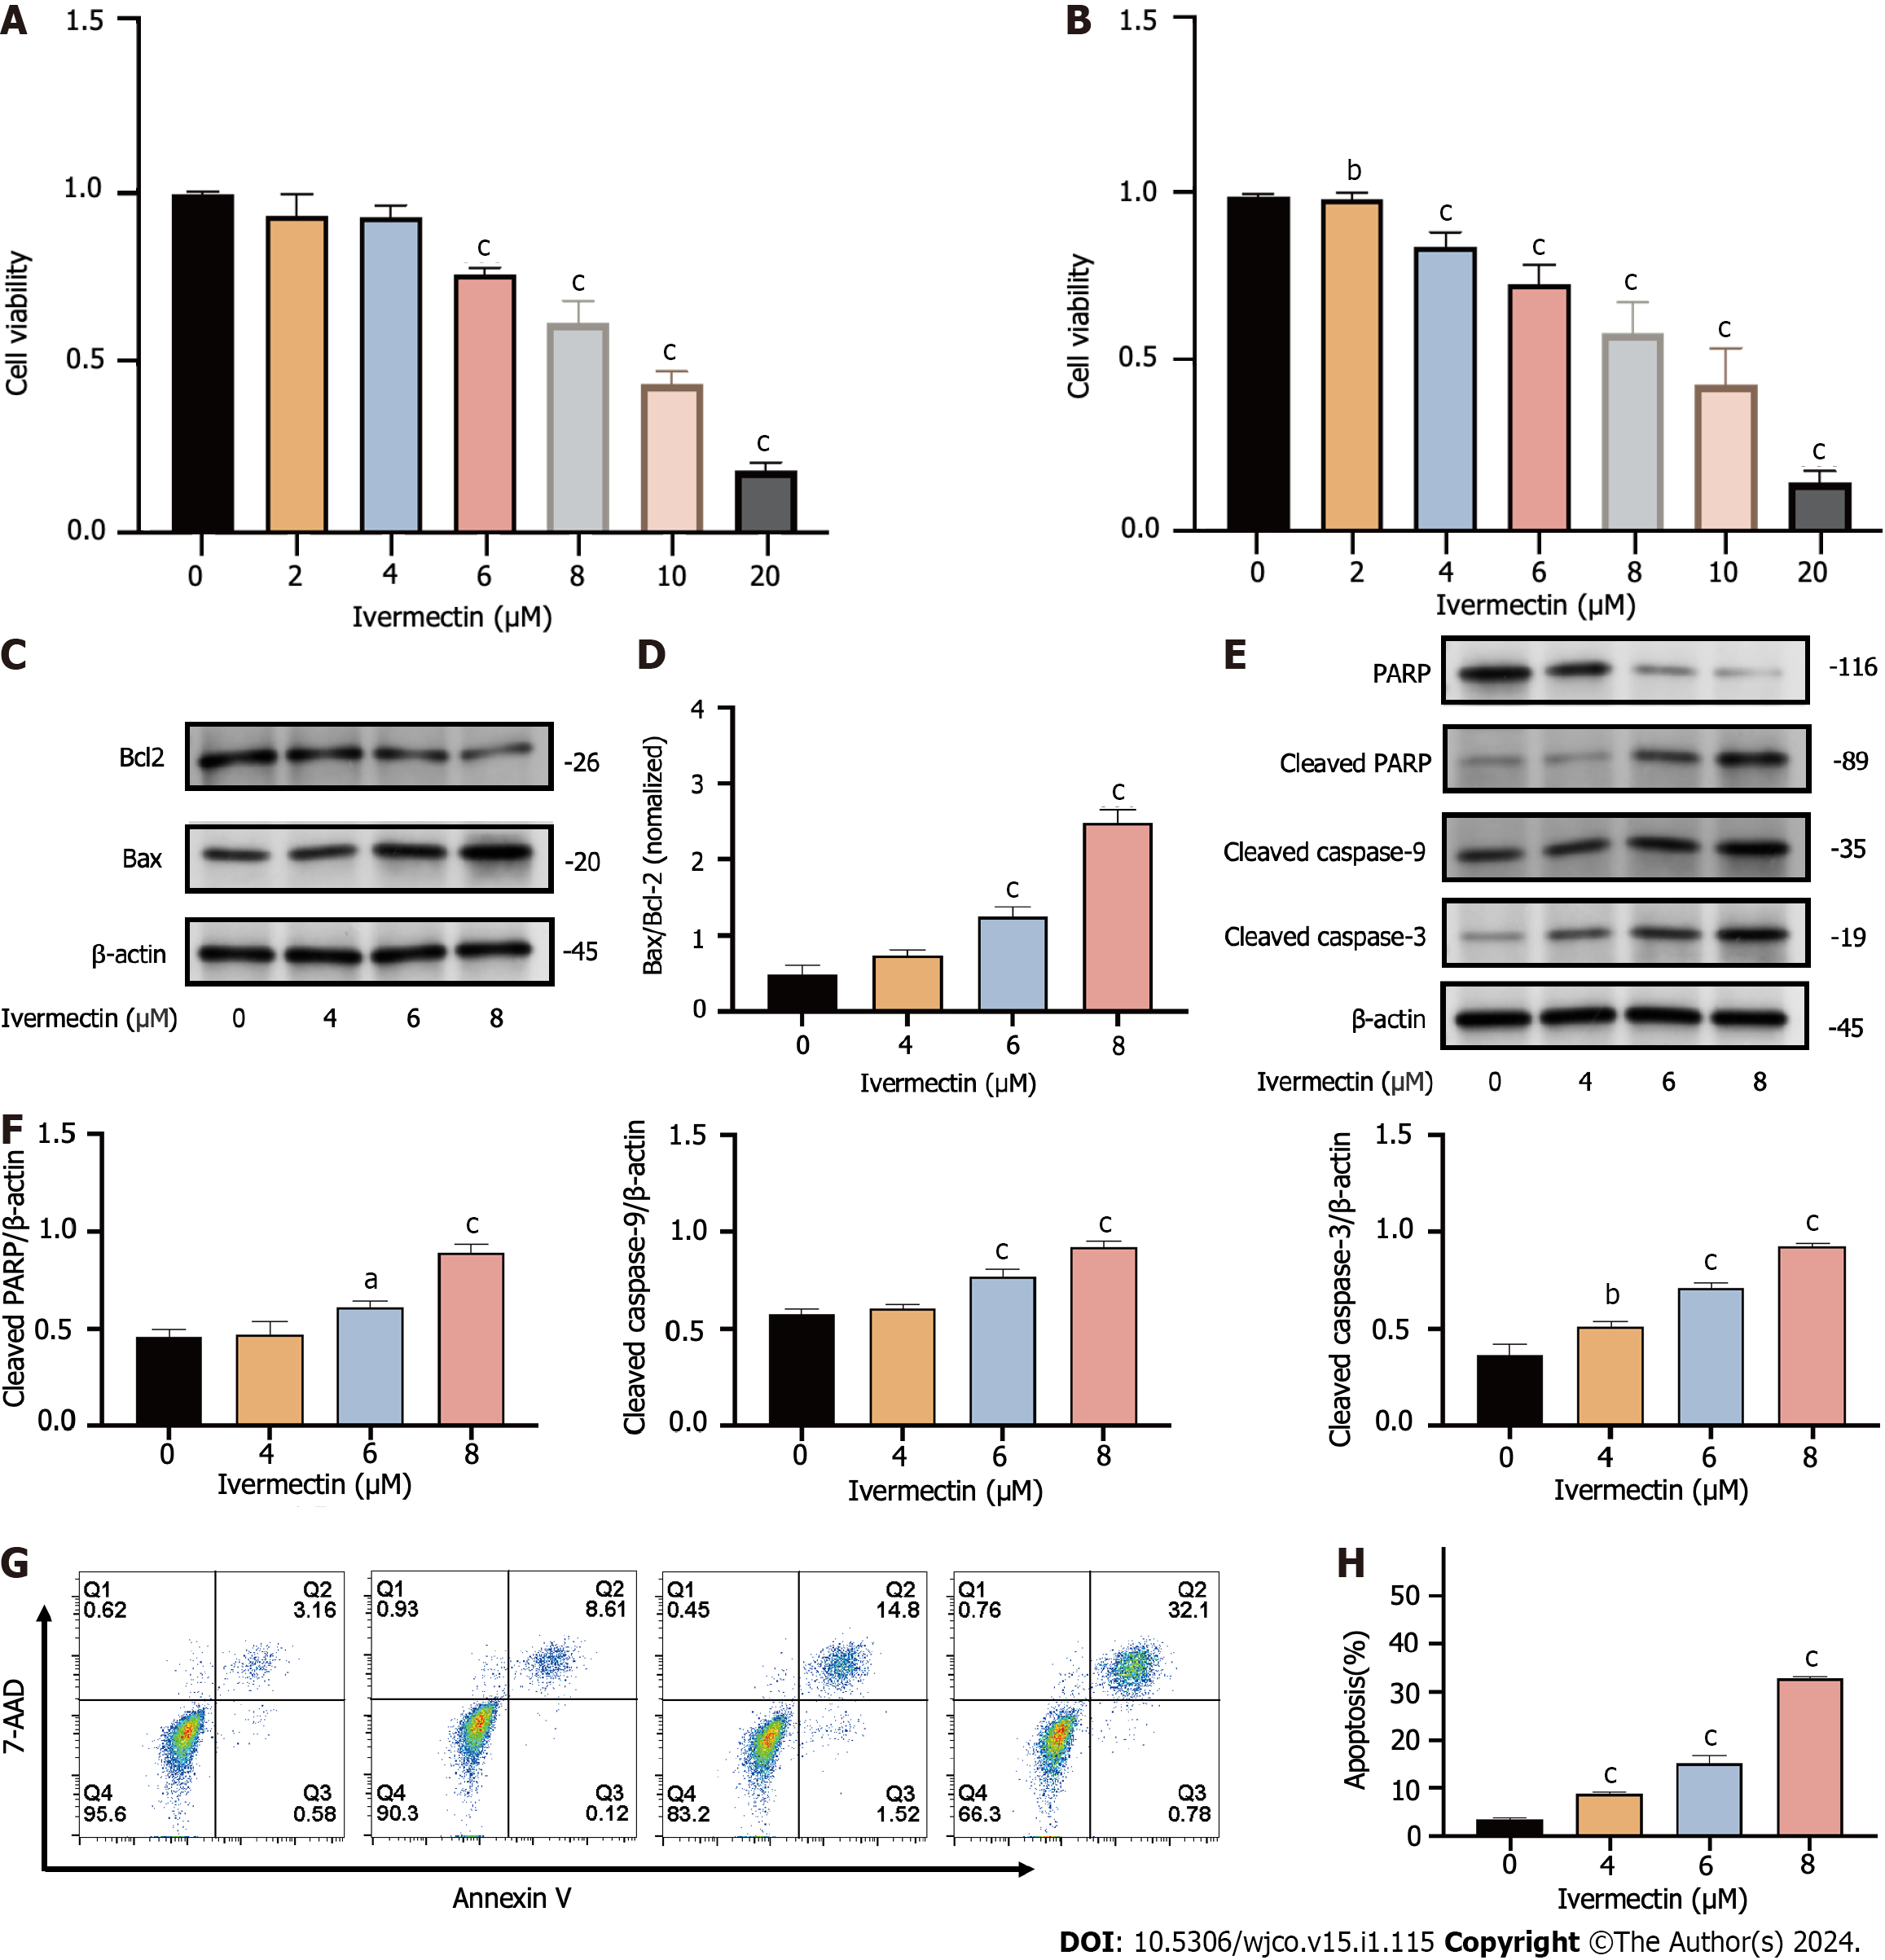
Figure 3 Ivermectin inhibits proliferation and promotes apoptosis in t(4; 14) multiple myeloma cells.
A: CCK-8 analysis of cell viability in cells treated with ivermectin for 24 h; B: CCK-8 analysis of cell viability in cells treated with ivermectin for 48 h; C: Western blot analysis revealing Bax and Bcl-2 protein expression levels in cells treated with ivermectin; D: The relative Bax protein expression levels to Bcl-2 protein expression levels are presented as the means ± SD of three independent experiments; E: Western blot analysis displaying protein expression levels of caspase cascade (including cleaved-caspase 9, cleaved-caspase 3, PARP, and cleaved PARP); F: The data are shown as the means ± SD of three independent experiments. G: Apoptosis in t(4;14) multiple myeloma cells post-ivermectin treatment using 7-AAD/Annexin-V flow cytometry assay. H: The data are shown as the means ± SD of three independent experiments. aP < 0.05, bP < 0.01, and cP < 0.001 compared with the control group.
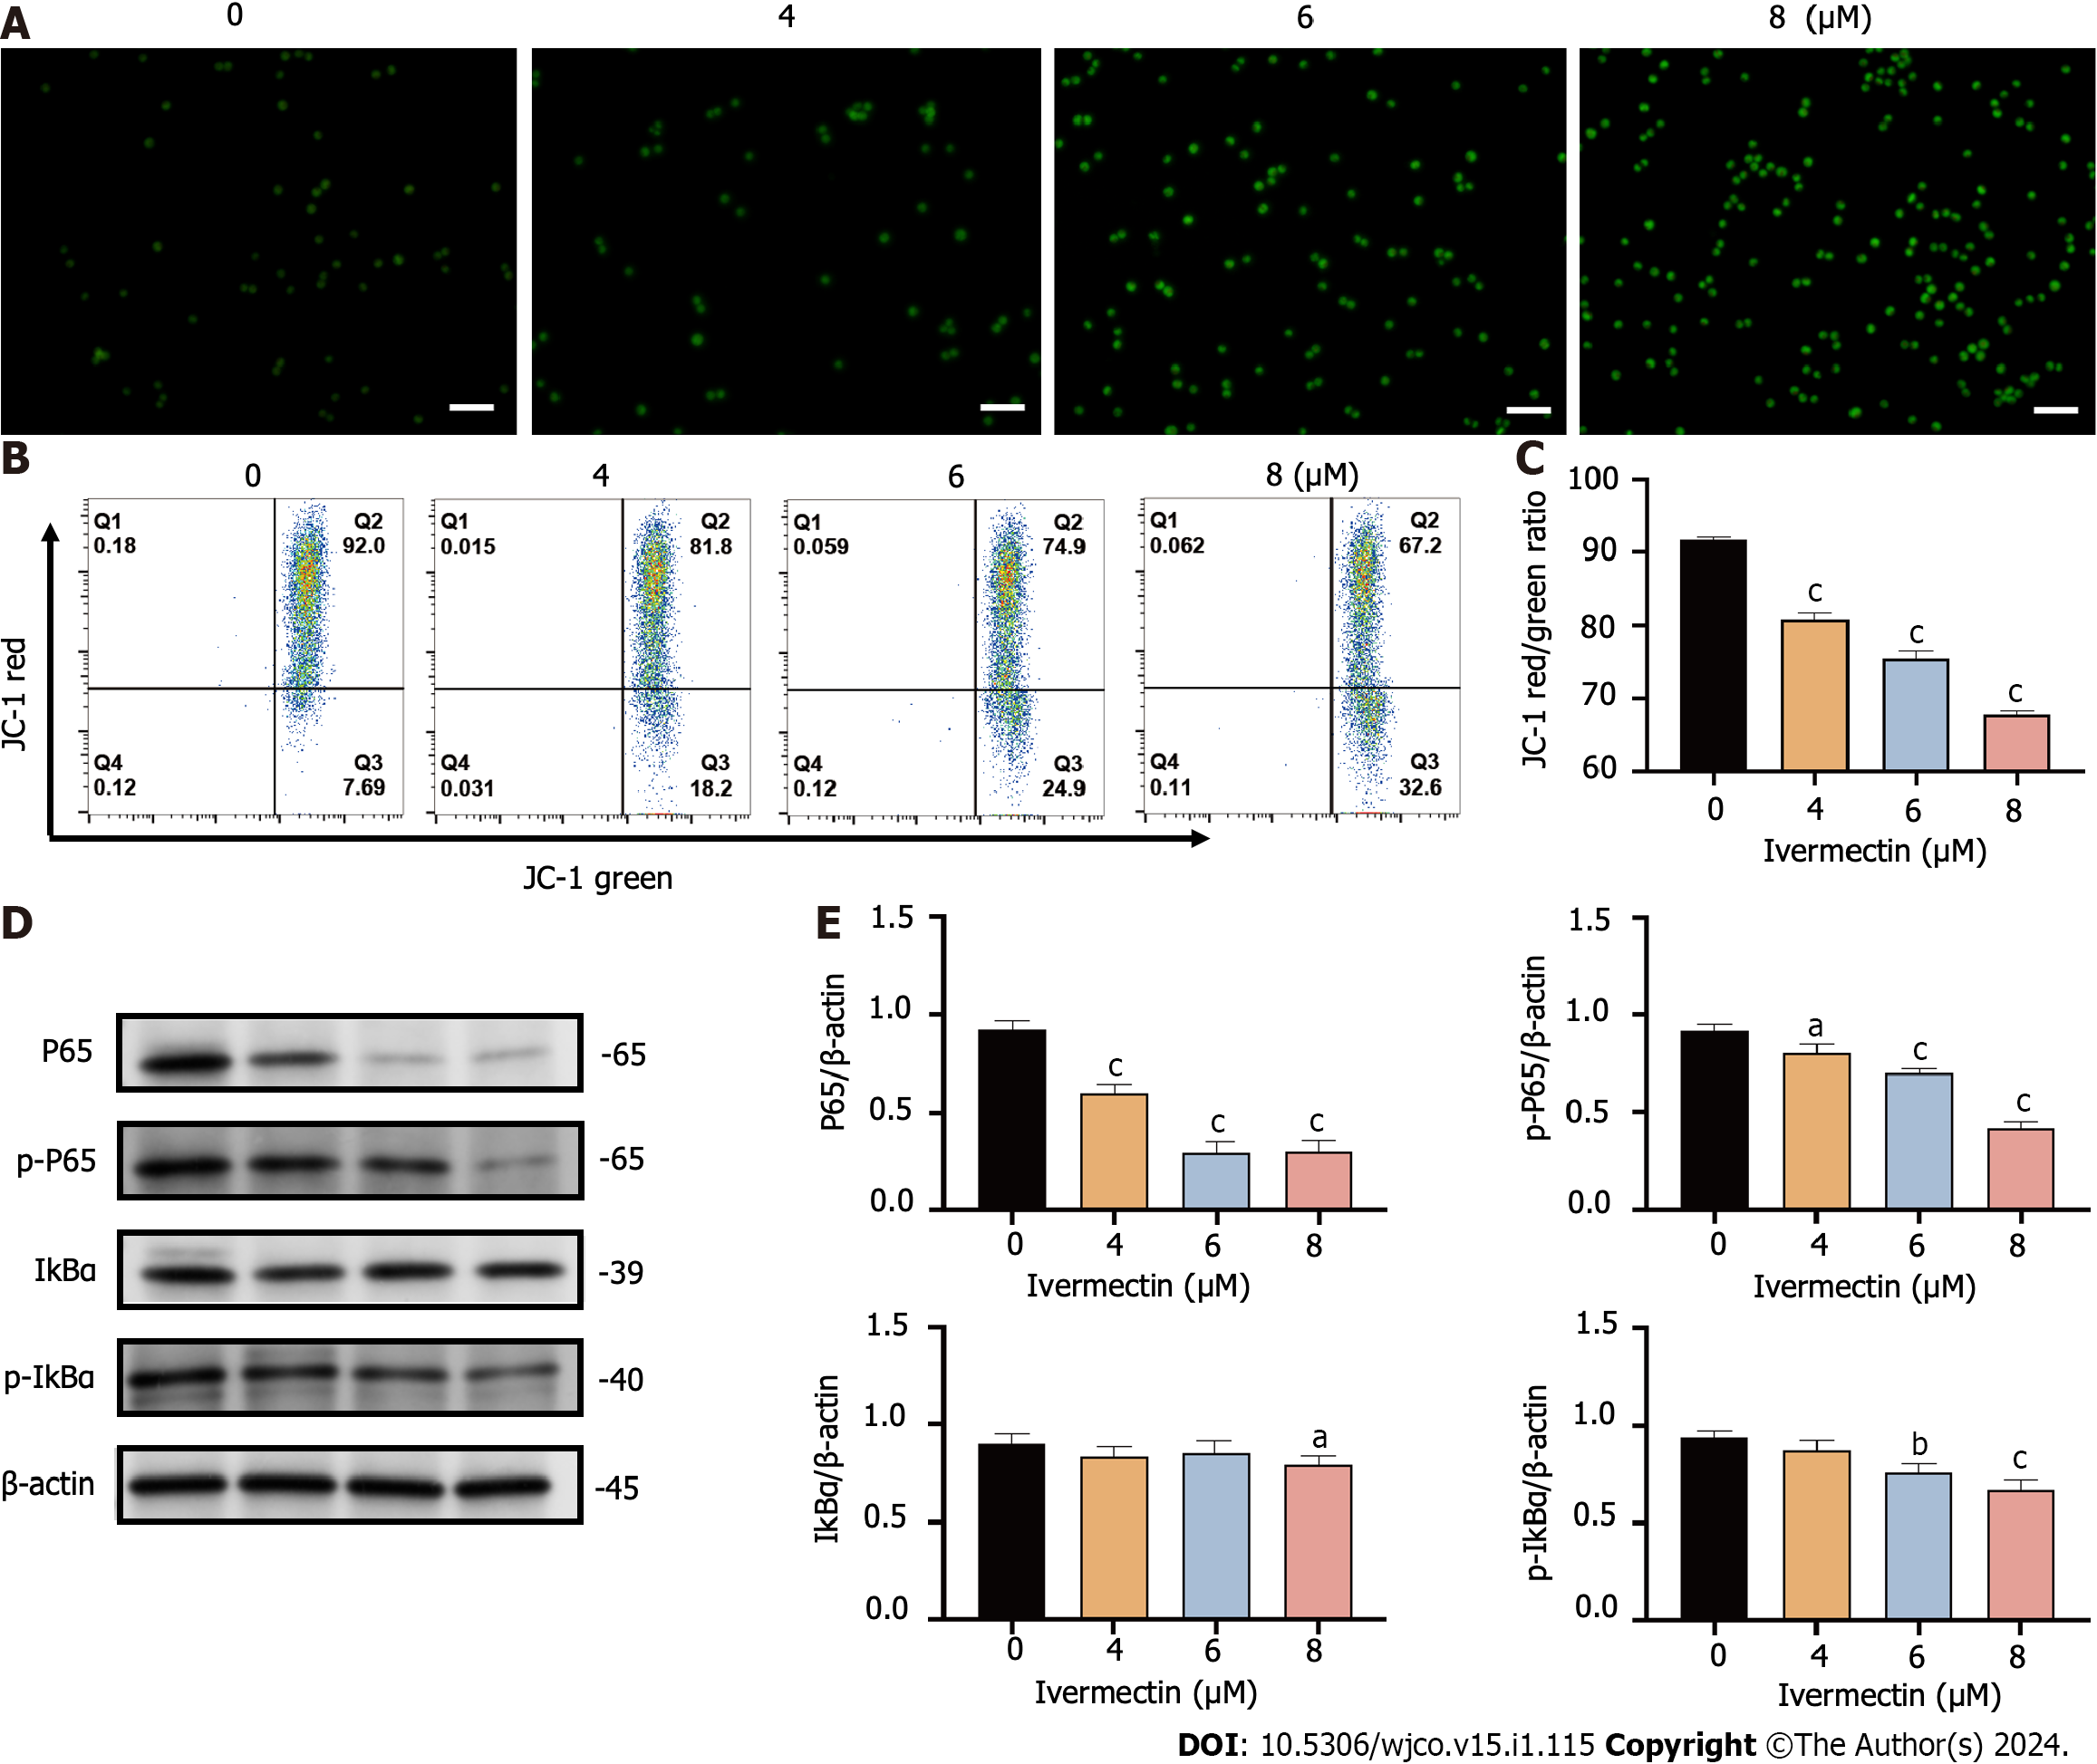
Figure 4 Ivermectin induces apoptosis in t(4;14) multiple myeloma cells via mitochondrial and nuclear factor-κB signaling pathway.
A: Visualization of intracellular reactive oxygen species (ROS) in t(4;14) multiple myeloma (MM) cells after treatment with ivermectin using 2′,7′-dichlorodihydrofluorescein (DCF) diacetate staining. ROS is represented by the green DCF fluorescence viewed under a fluorescence microscope at 200× magnification. Scale bar: 50 μm. B: Mitochondrial membrane potential in t(4;14) MM cells post-ivermectin treatment assessed using JC-1 staining; C: The data are shown as the means ± SD of three independent experiments; D: Expression patterns of p65, p-p65, p-IκBα, and IκBα in t(4;14) MM cells after exposure to ivermectin, analyzed by western blotting; E: The data are shown as the means ± SD of three independent experiments. aP < 0.05, bP < 0.01, and cP < 0.001 compared with the control group.
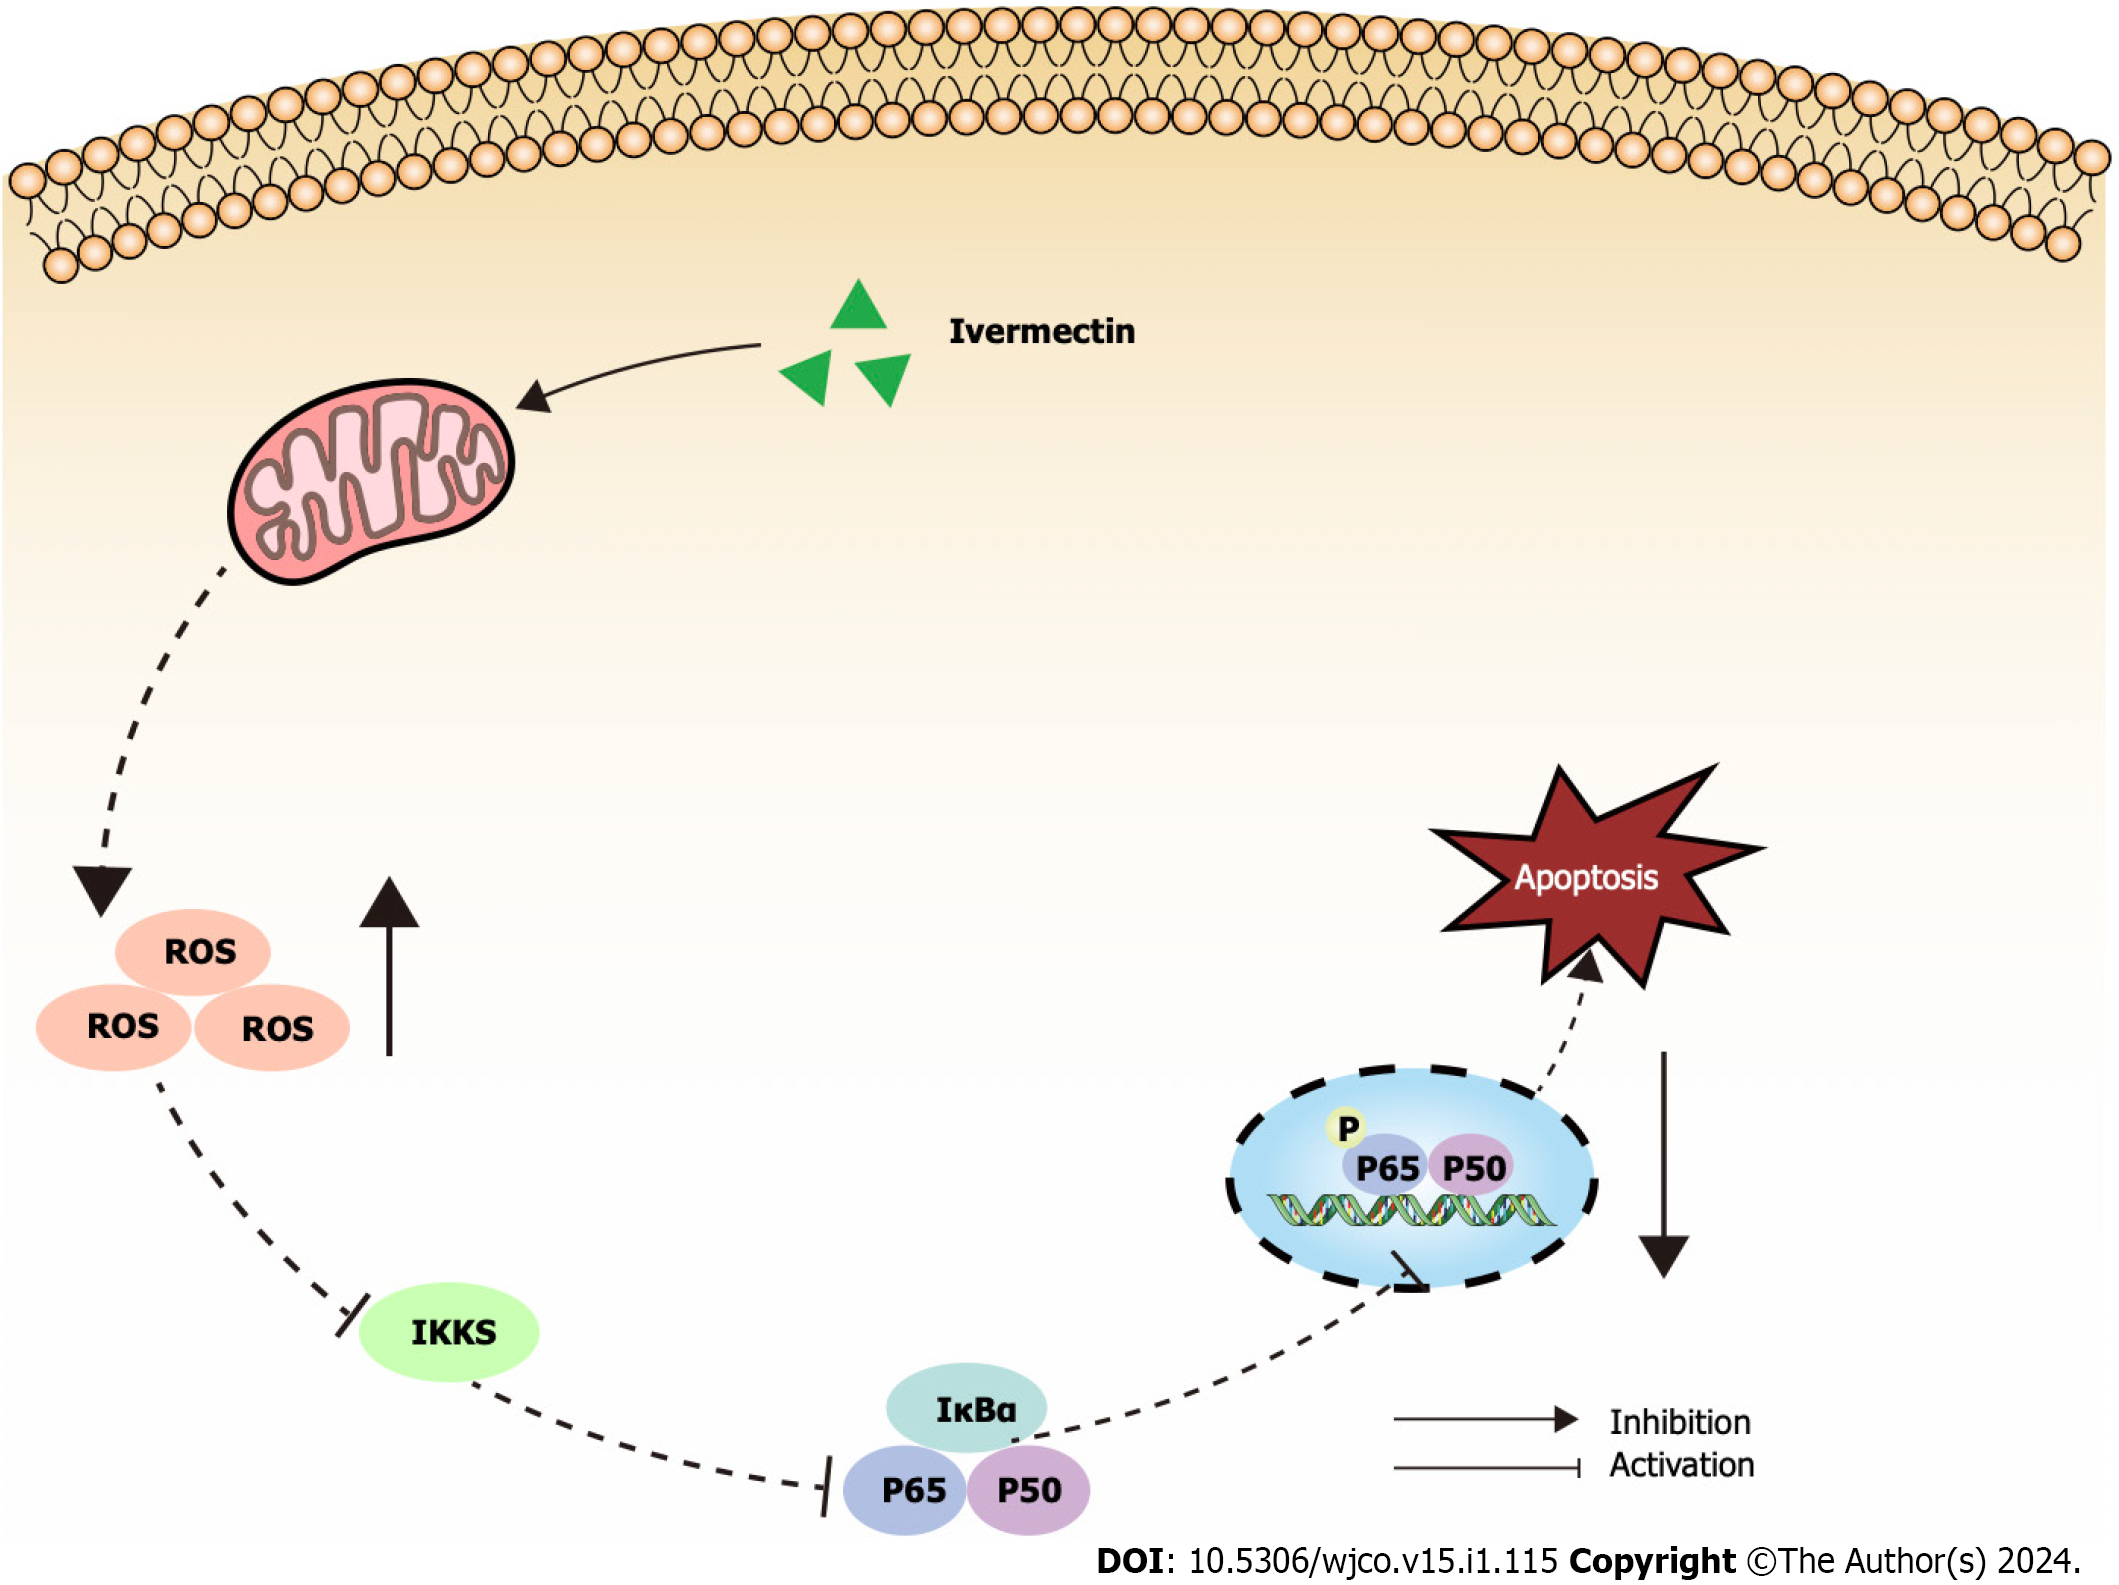
Figure 5 Illustrated overview of ivermectin promoting apoptosis in t(4;14) multiple myeloma cells.
IκBα: Anti-inhibitor of NF-κB; IKKs: Inhibitors of kappa B kinase; ROS: Reactive oxygen species.
- Citation: Song Y, Zhang HJ, Song X, Geng J, Li HY, Zhang LZ, Yang B, Lu XC. Gene signatures to therapeutics: Assessing the potential of ivermectin against t(4;14) multiple myeloma. World J Clin Oncol 2024; 15(1): 115-129
- URL: https://www.wjgnet.com/2218-4333/full/v15/i1/115.htm
- DOI: https://dx.doi.org/10.5306/wjco.v15.i1.115


