Copyright
©The Author(s) 2022.
World J Clin Oncol. Oct 24, 2022; 13(10): 762-778
Published online Oct 24, 2022. doi: 10.5306/wjco.v13.i10.762
Published online Oct 24, 2022. doi: 10.5306/wjco.v13.i10.762
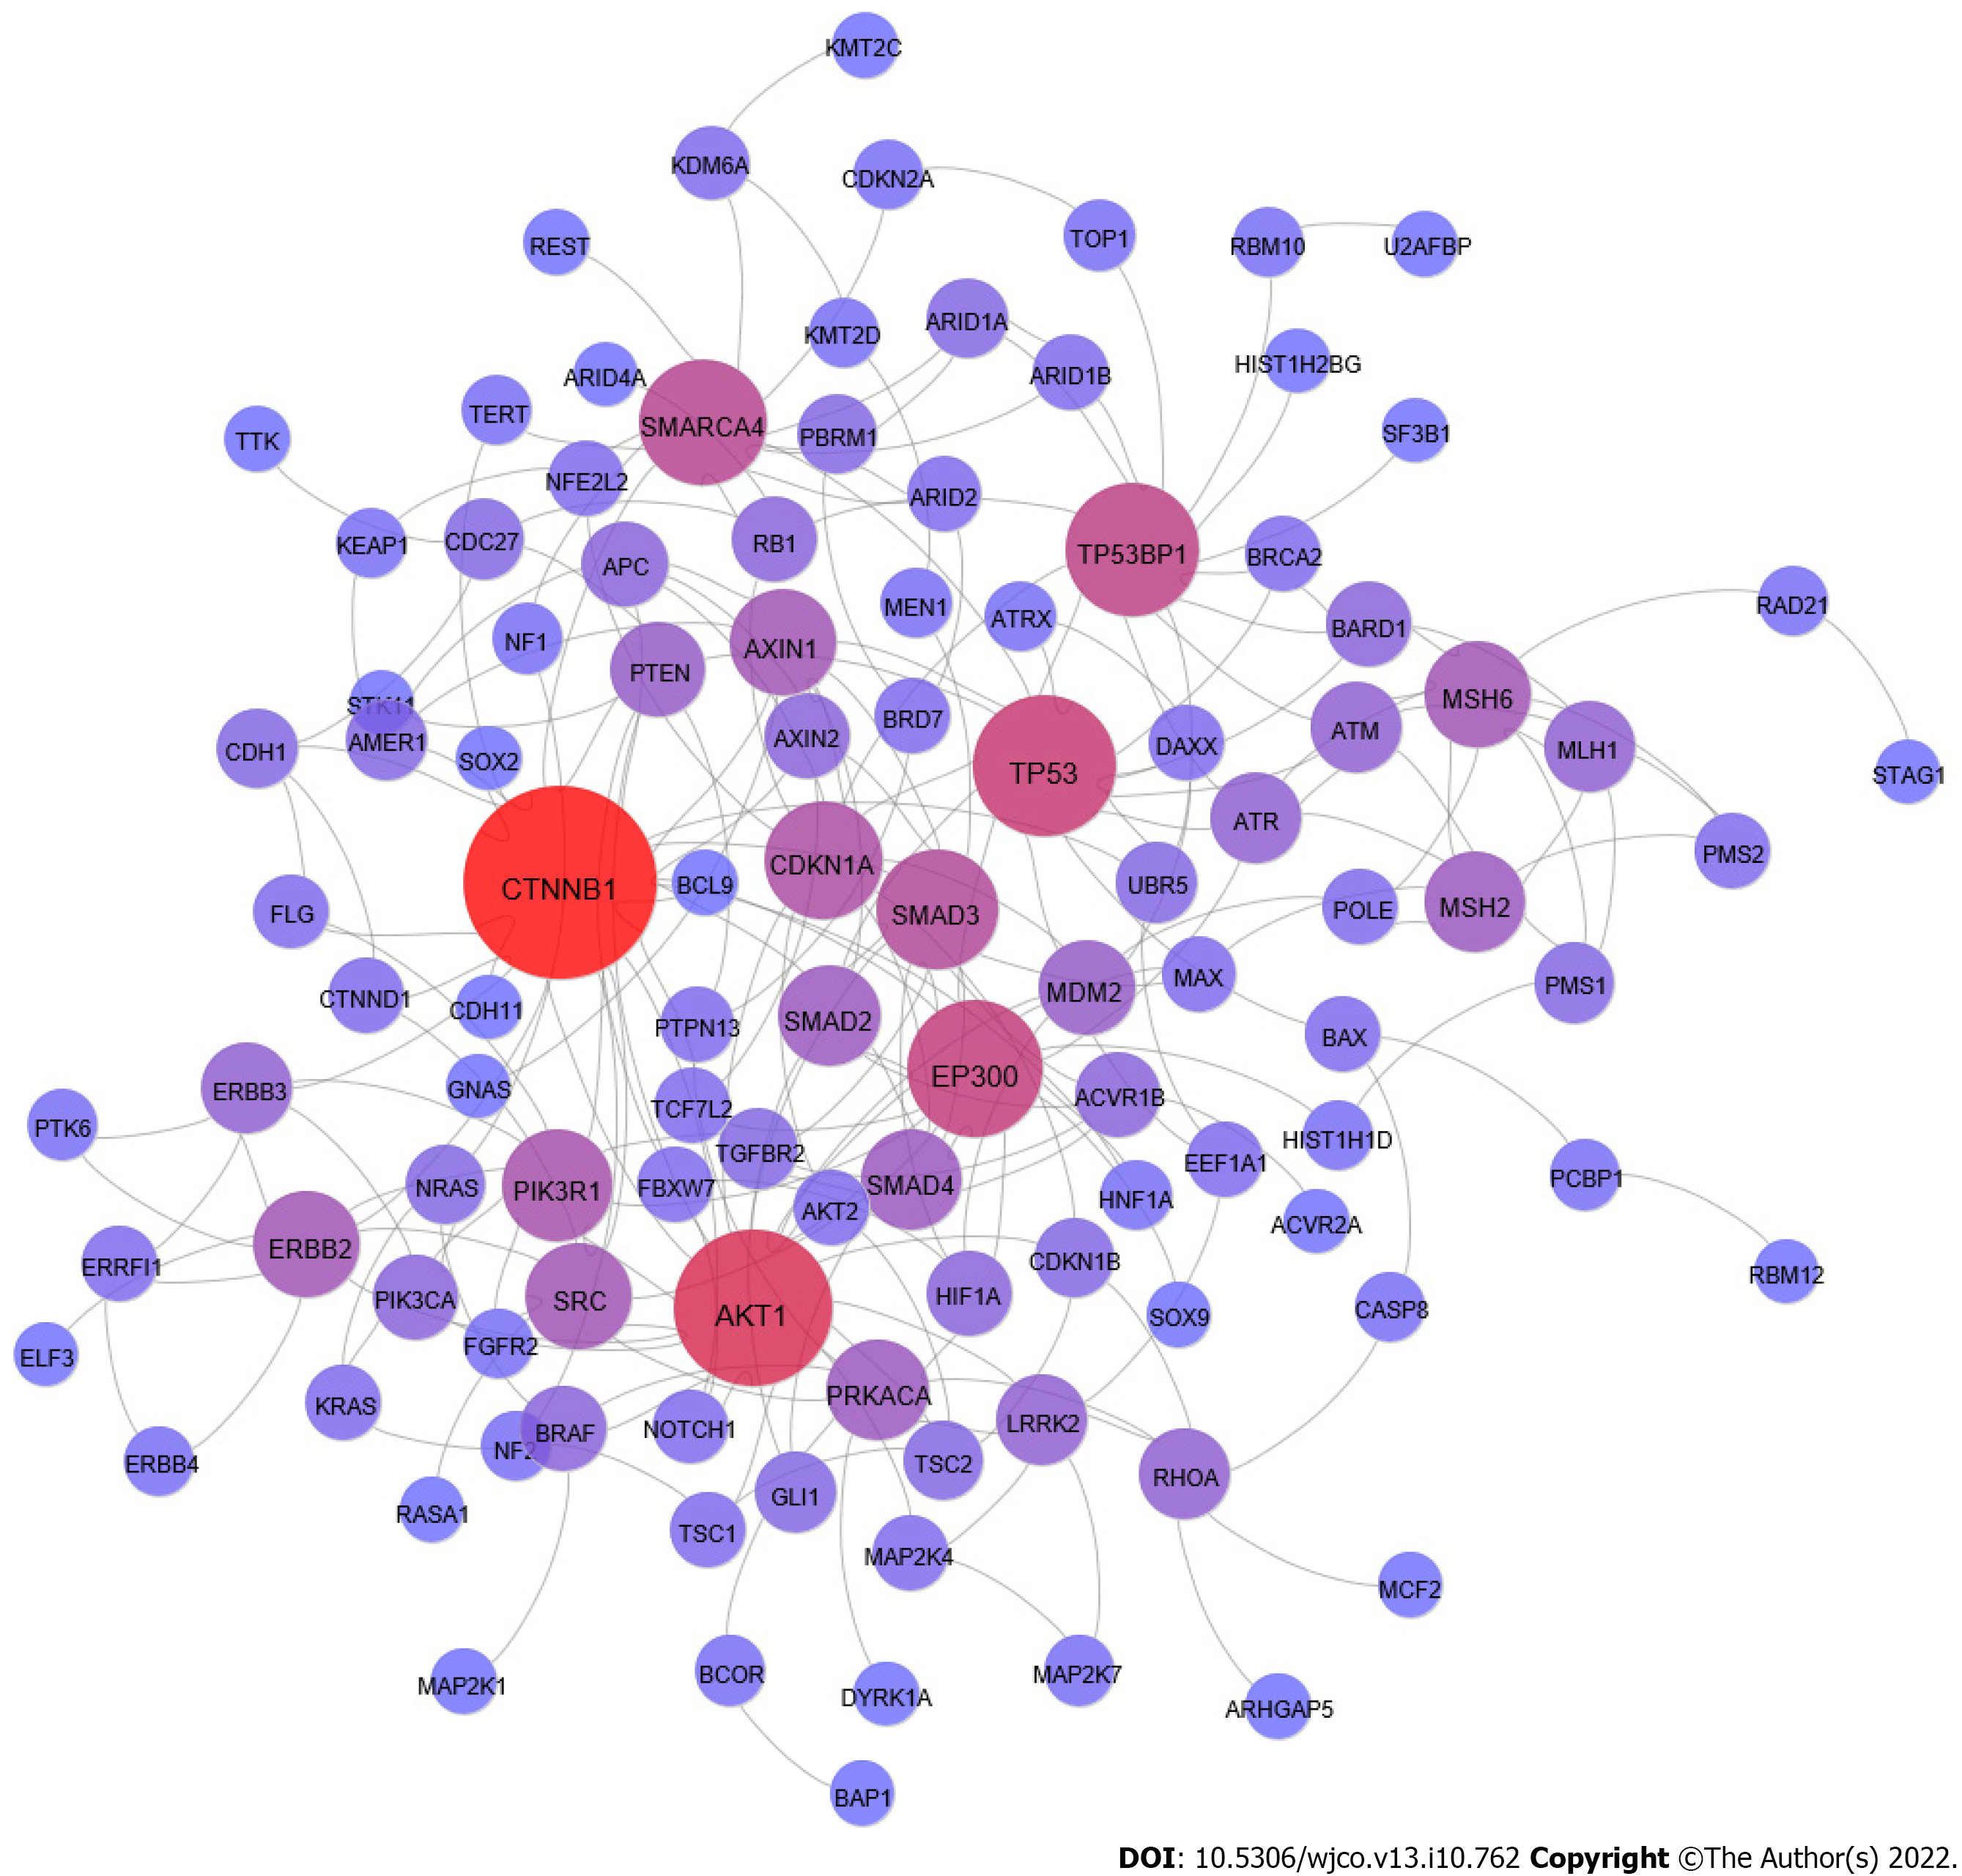
Figure 1 Protein-protein interaction of genes with mutations associated with gastrointestinal cancers.
The nodes represent the genes, and the edges represent the protein interactions. The network was built using information from experimental data only from the STRING database[110]. The node size represents the number of protein interactions (degree), indicating the node’s centrality.
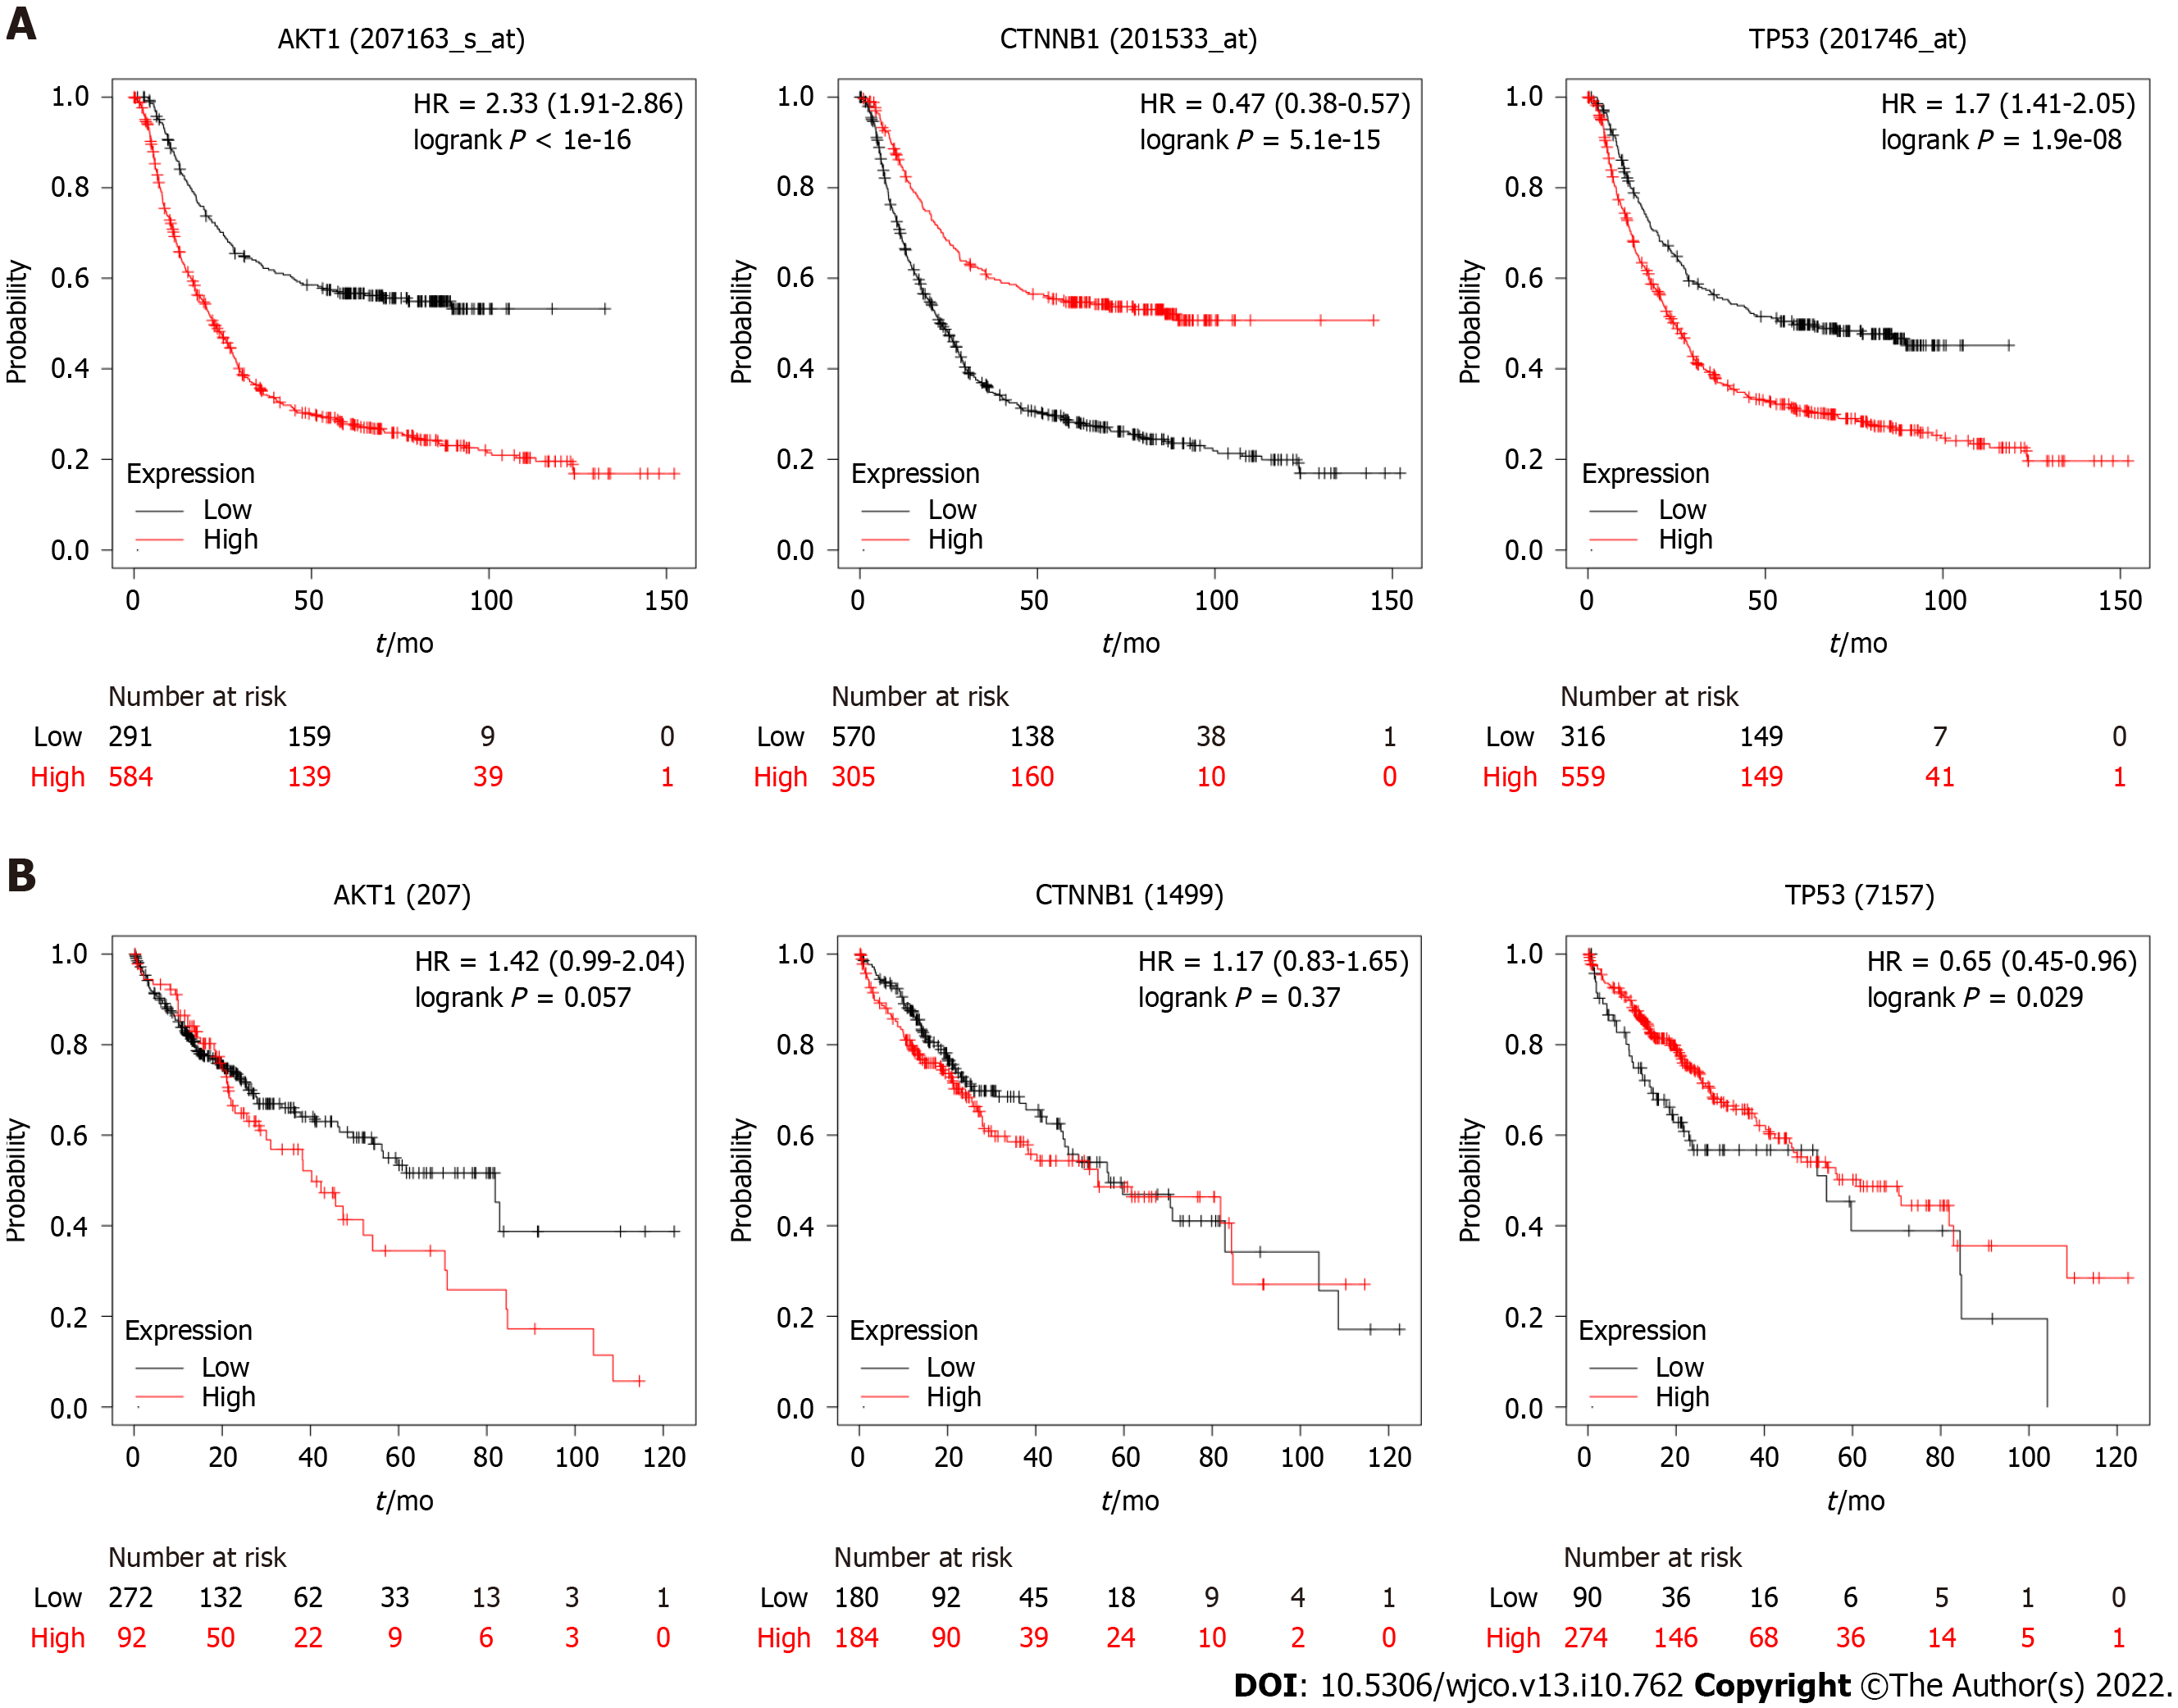
Figure 2 Prognostic value of Akt1, catenin beta 1, tumor protein p53 for gastric cancer (A) and hepatocellular carcinoma (B) in Kaplan Meier plotter (https://kmplot.com)[142]. Kaplan-Meier survival curves for patients of gastric cancer and hepatocellular carcinoma with high and low indicated gene expression. CTNNB1: Catenin beta 1; TP53: Tumor protein p53.
- Citation: Bispo IMC, Granger HP, Almeida PP, Nishiyama PB, de Freitas LM. Systems biology and OMIC data integration to understand gastrointestinal cancers. World J Clin Oncol 2022; 13(10): 762-778
- URL: https://www.wjgnet.com/2218-4333/full/v13/i10/762.htm
- DOI: https://dx.doi.org/10.5306/wjco.v13.i10.762


