Copyright
©The Author(s) 2021.
World J Clin Oncol. Apr 24, 2021; 12(4): 272-281
Published online Apr 24, 2021. doi: 10.5306/wjco.v12.i4.272
Published online Apr 24, 2021. doi: 10.5306/wjco.v12.i4.272
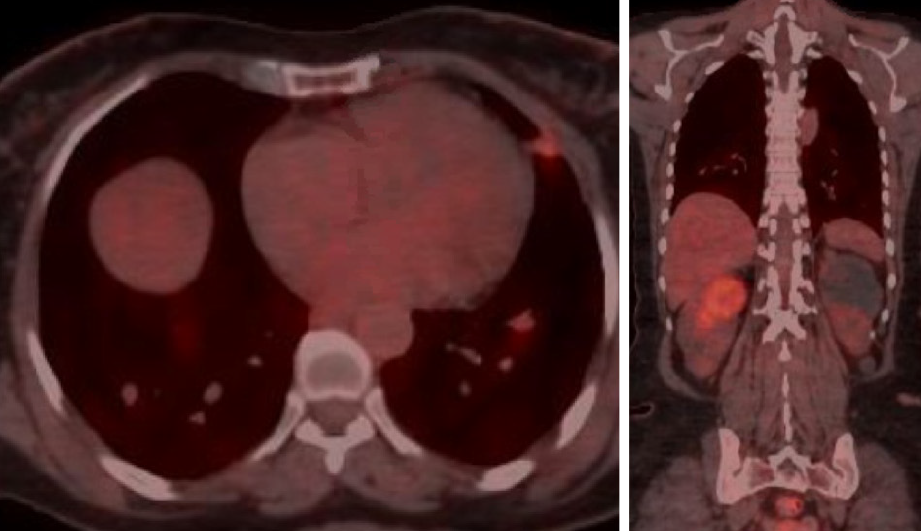
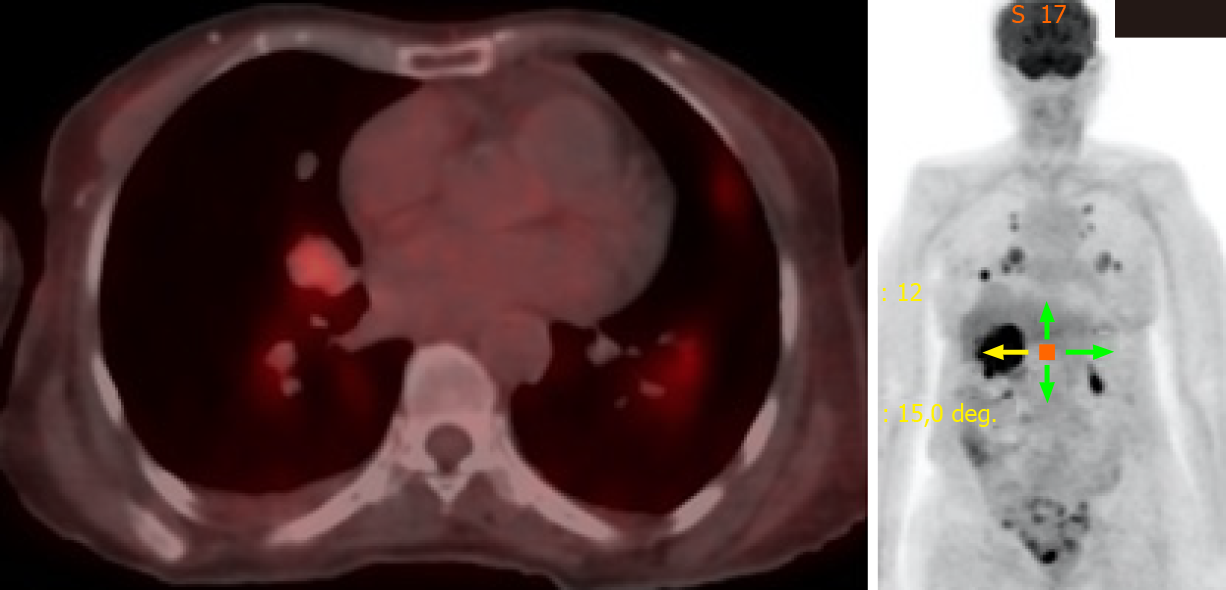
Figure 1 Positron emission tomography/computed tomography scan shows pulmonary metastases and new development of right renal metastasis.
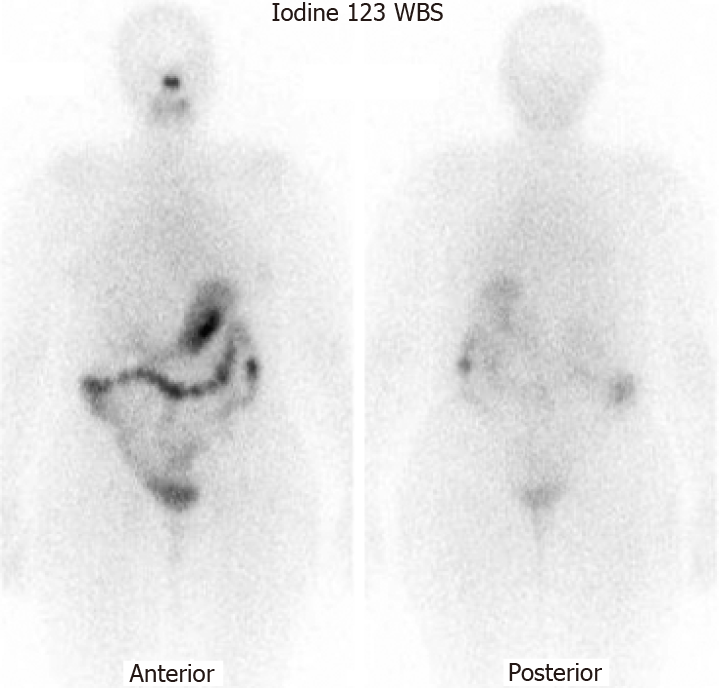
Figure 2 Diagnostic iodine-123 whole-body scan showing no tracer uptake in pulmonary and renal metastases.
WBS: Whole-body scan.
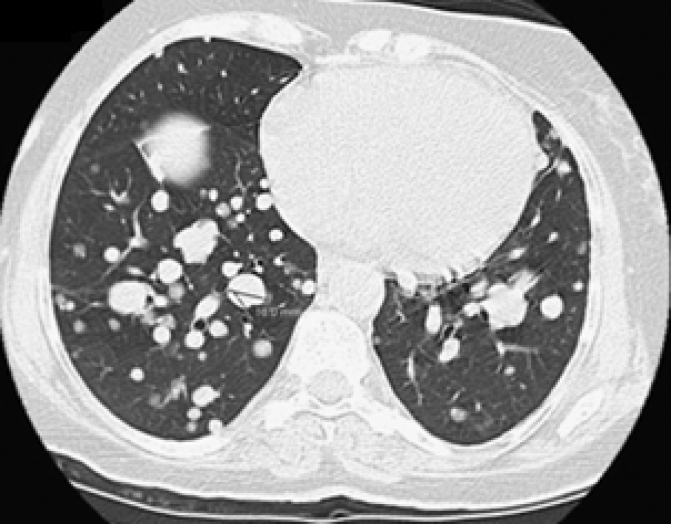
Figure 3 Chest computed tomography shows pulmonary metastases progression from Hurthle cell thyroid cancer.
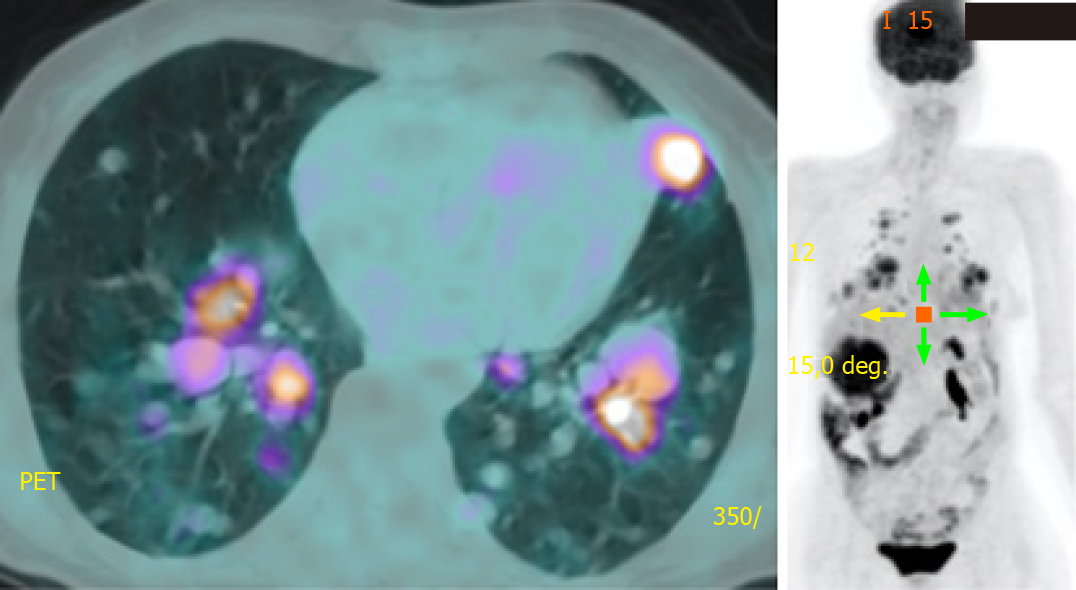
Figure 4 Positron emission tomography/computed tomography scan shows pulmonary metastases progression one year after treatment with sorafenib.
PET: Positron emission tomography.
Figure 5 Positron emission tomography/computed tomography scan shows regression of pulmonary and renal metastases with lenvatinib.
Figure 6 Blood test trends during tyrosine kinase inhibitor treatment.
A: Thyroglobulin; B: Hemoglobin; C: Platelet counts; D: Renal profile; E: Serum albumin levels during tyrosine kinase inhibitor therapy.
- Citation: Butt MI, Khalid Bakhsh AM, Nadri QJ. Lenvatinib-induced multiorgan adverse events in Hurthle cell thyroid cancer: A case report. World J Clin Oncol 2021; 12(4): 272-281
- URL: https://www.wjgnet.com/2218-4333/full/v12/i4/272.htm
- DOI: https://dx.doi.org/10.5306/wjco.v12.i4.272


