Copyright
©The Author(s) 2019.
World J Clin Oncol. Mar 24, 2019; 10(3): 149-160
Published online Mar 24, 2019. doi: 10.5306/wjco.v10.i3.149
Published online Mar 24, 2019. doi: 10.5306/wjco.v10.i3.149
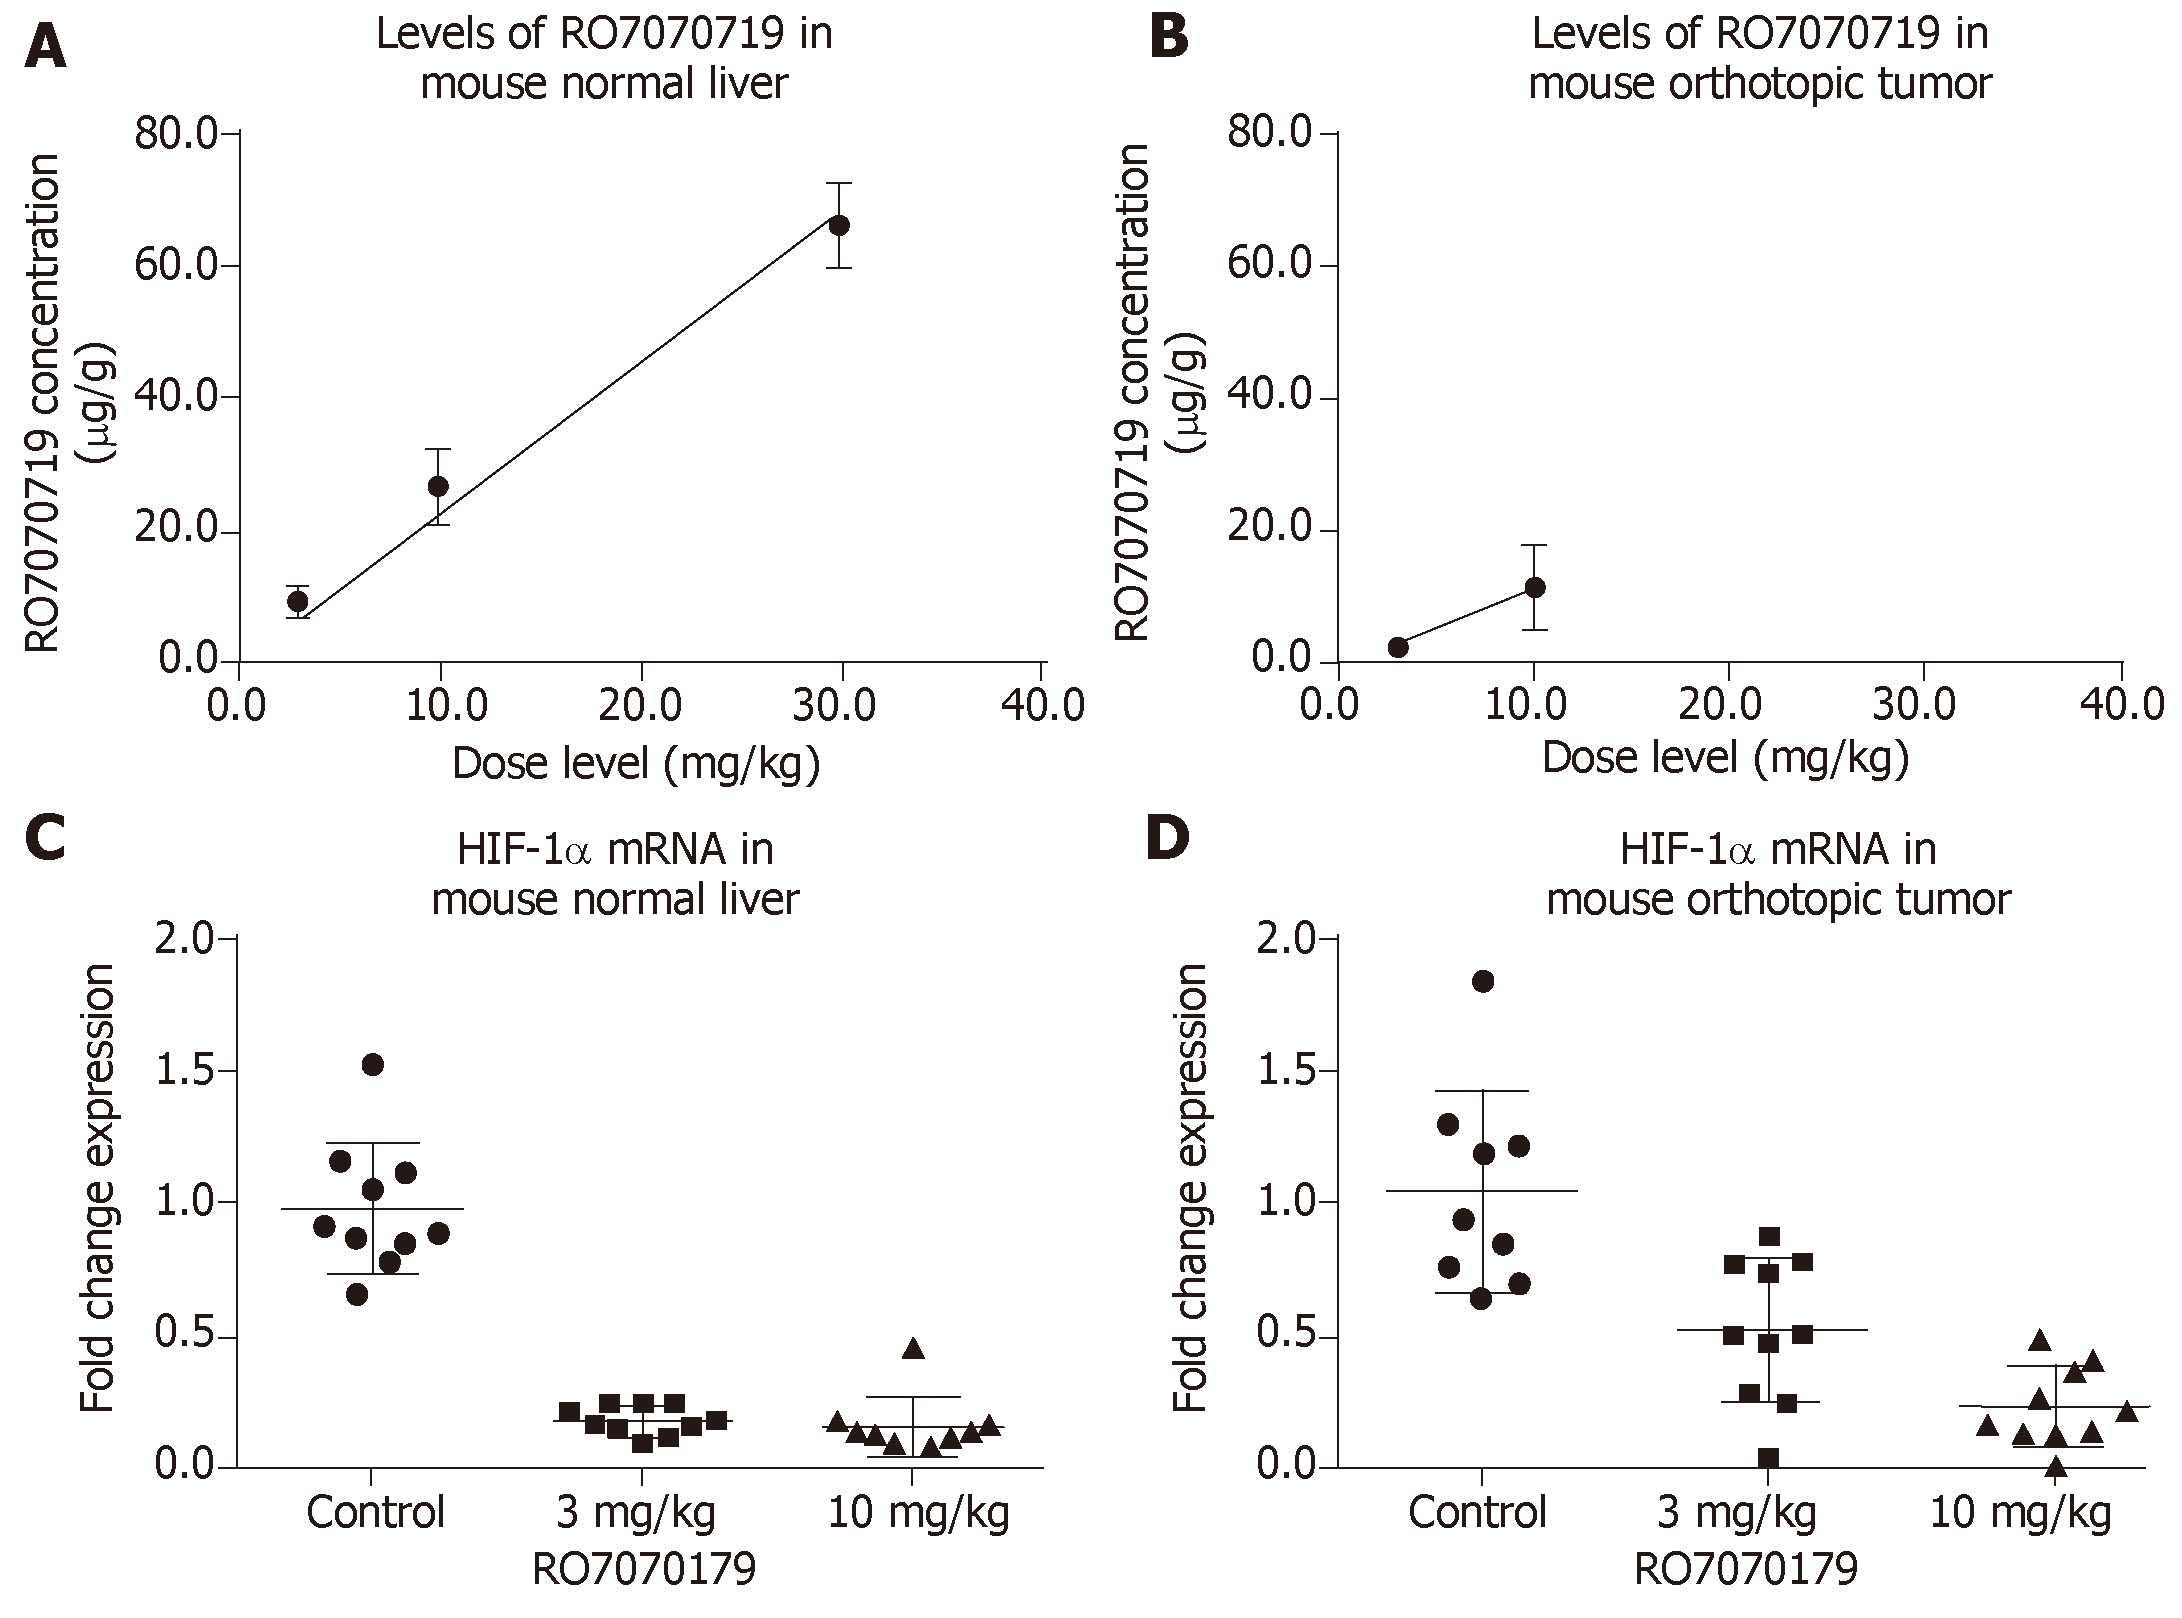
Figure 1 Concentrations of RO7070719 in normal mouse liver, Hep3B orthotopic tumor and specimens harvested at Day 39.
A: Concentrations of RO7070719 in normal liver; B, C: Hep3B tumor xenograft and the levels of HIF-1α mRNA in (C) normal liver; D: Hep3B tumor xenograft. Normal mouse liver (A) and Hep3B orthotopic tumor (B) specimens harvested at Day 39 (n = 10/group, except at 30 mg/kg n = 3/group harvested at Day 23) were quantified using hybridization-ELISA for RO7070719 concentrations. The levels of HIF-1a mRNA were quantified by qPCR in normal liver (C), and Hep3B orthotopic tumor xenografts (D).
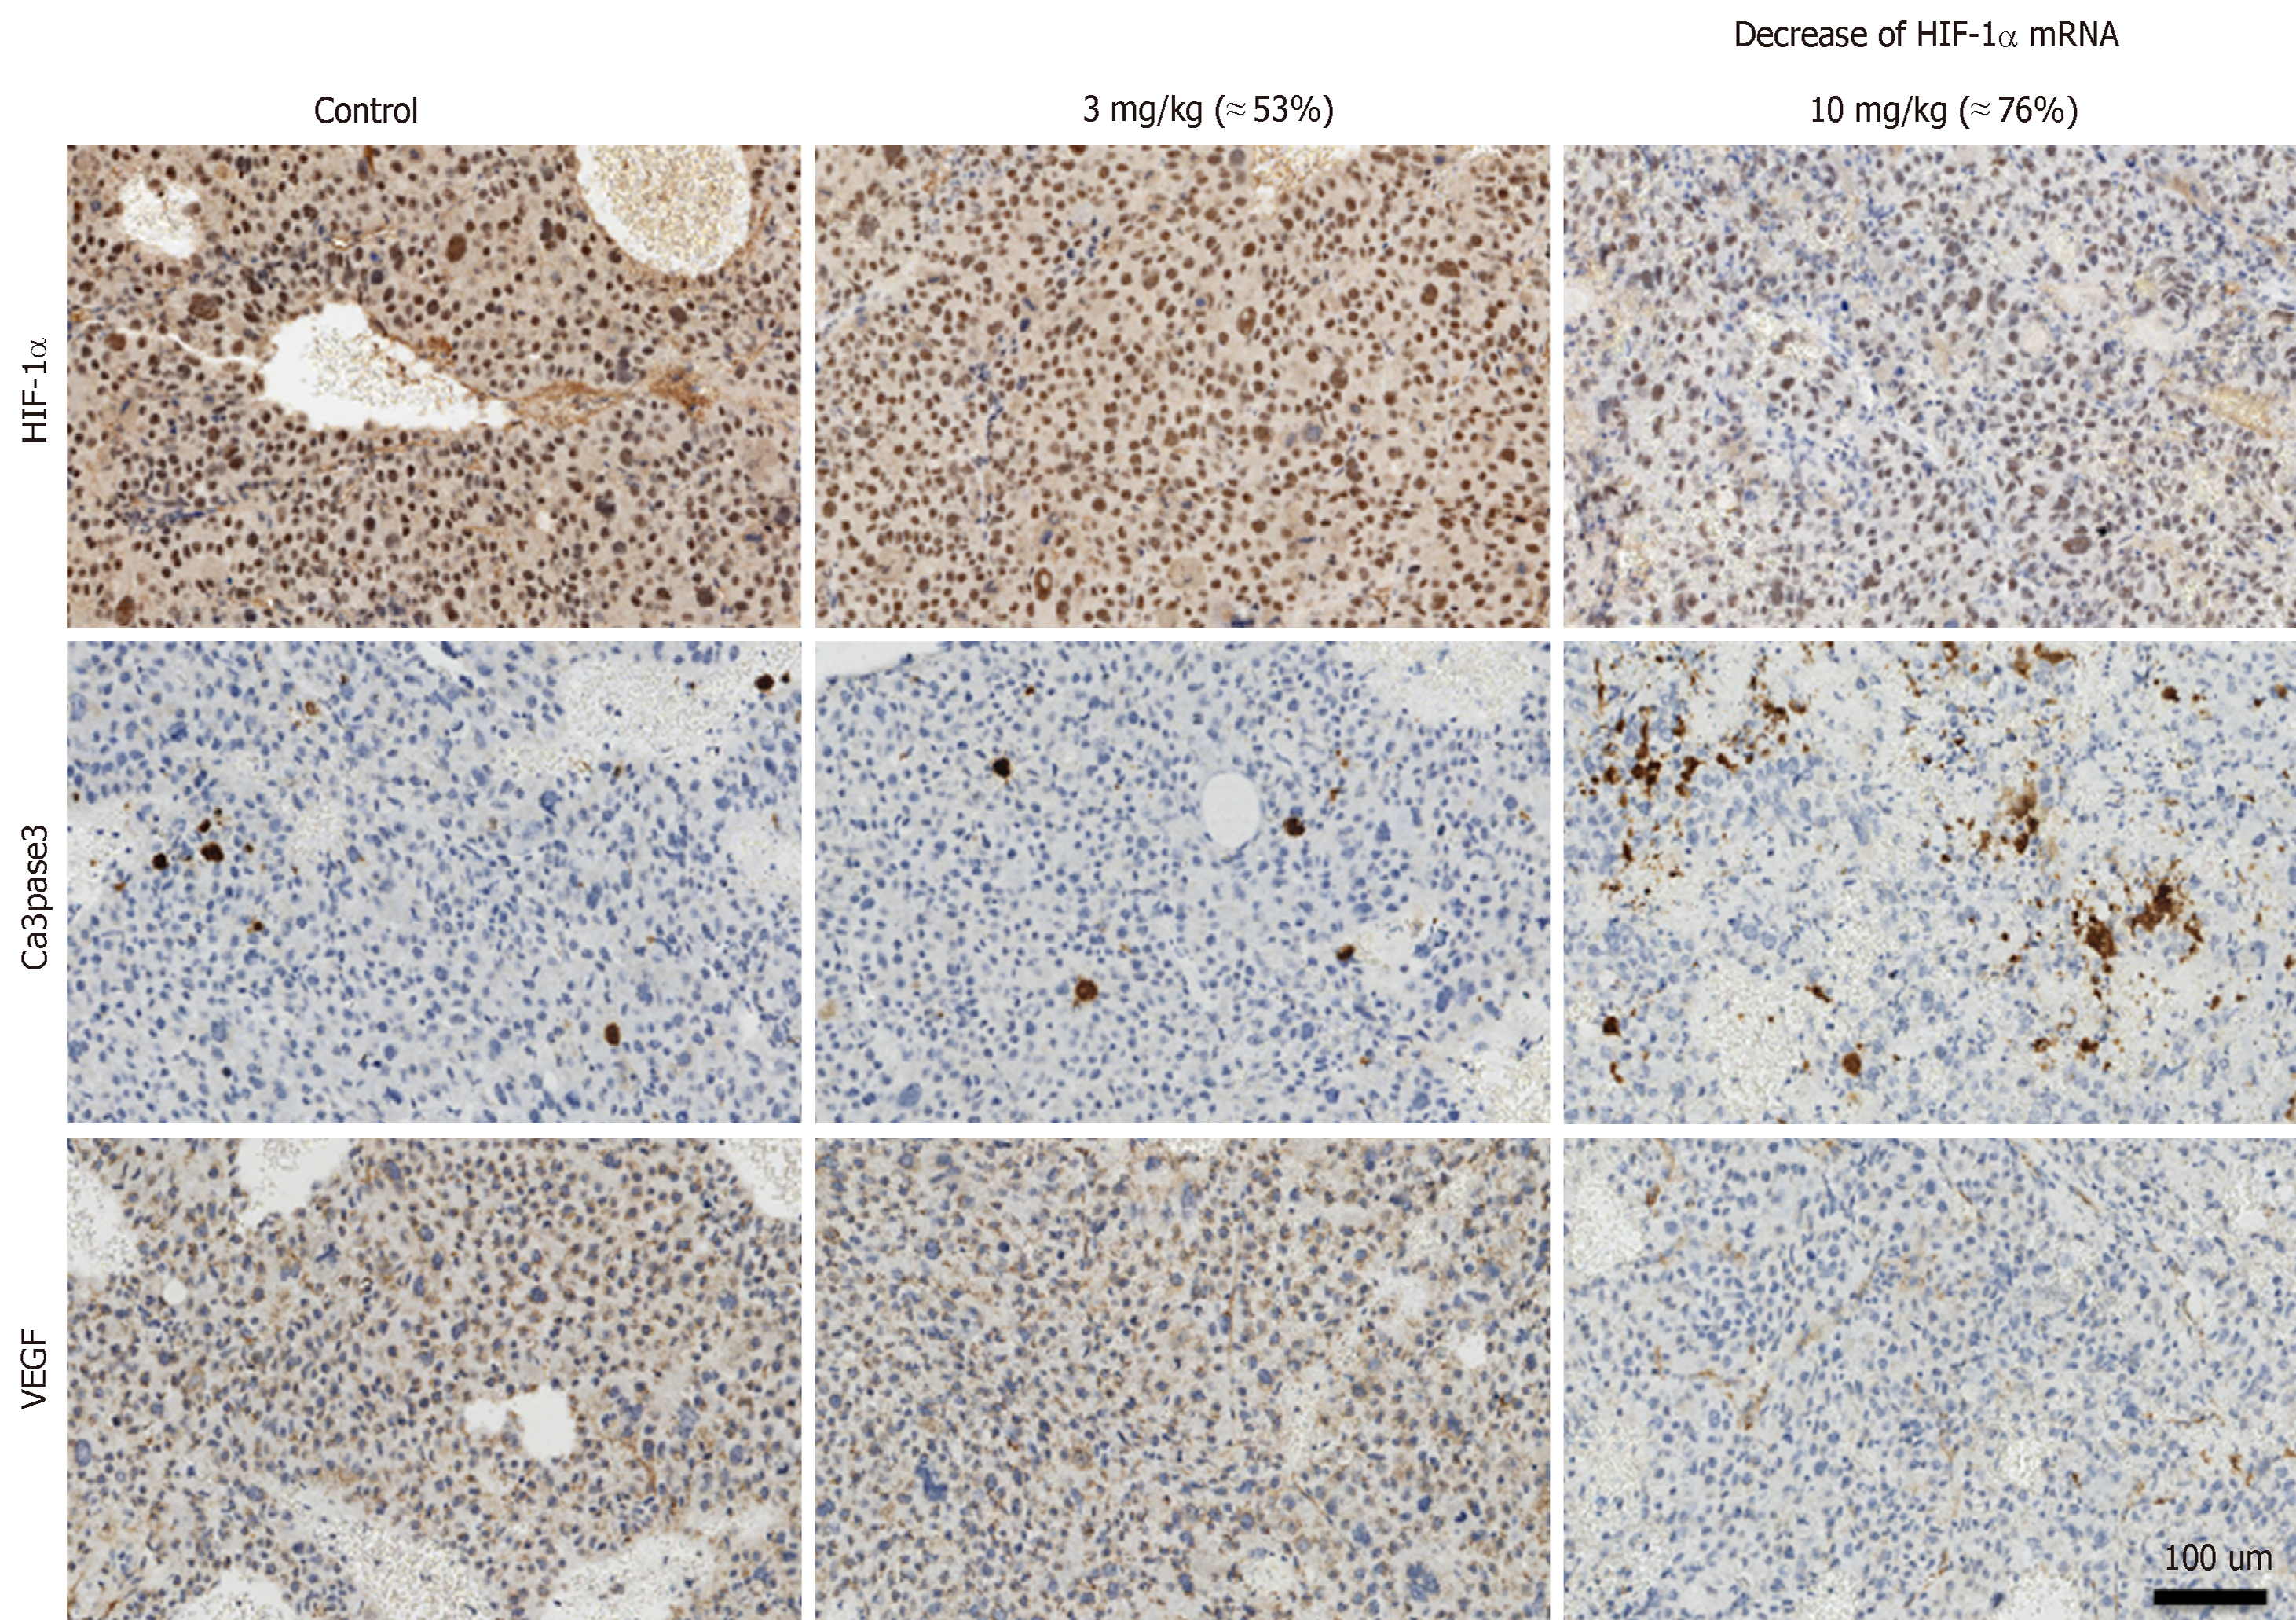
Figure 2 Immunohistochemistry analysis.
Immunohistochemistry analysis of the control mouse xenograft, tumor xenograft treated with 3 mg/kg RO7070179, which exhibited 53% decrease in hypoxia-inducible factor 1α (HIF-1α) mRNA, and the tumor xenograft treated with 10 mg/kg RO7070719, which exhibited 76% decrease in HIF-1α mRNA. HIF-1α: Hypoxia-inducible factor 1α; VEGF: Vascular epidermal growth factor.
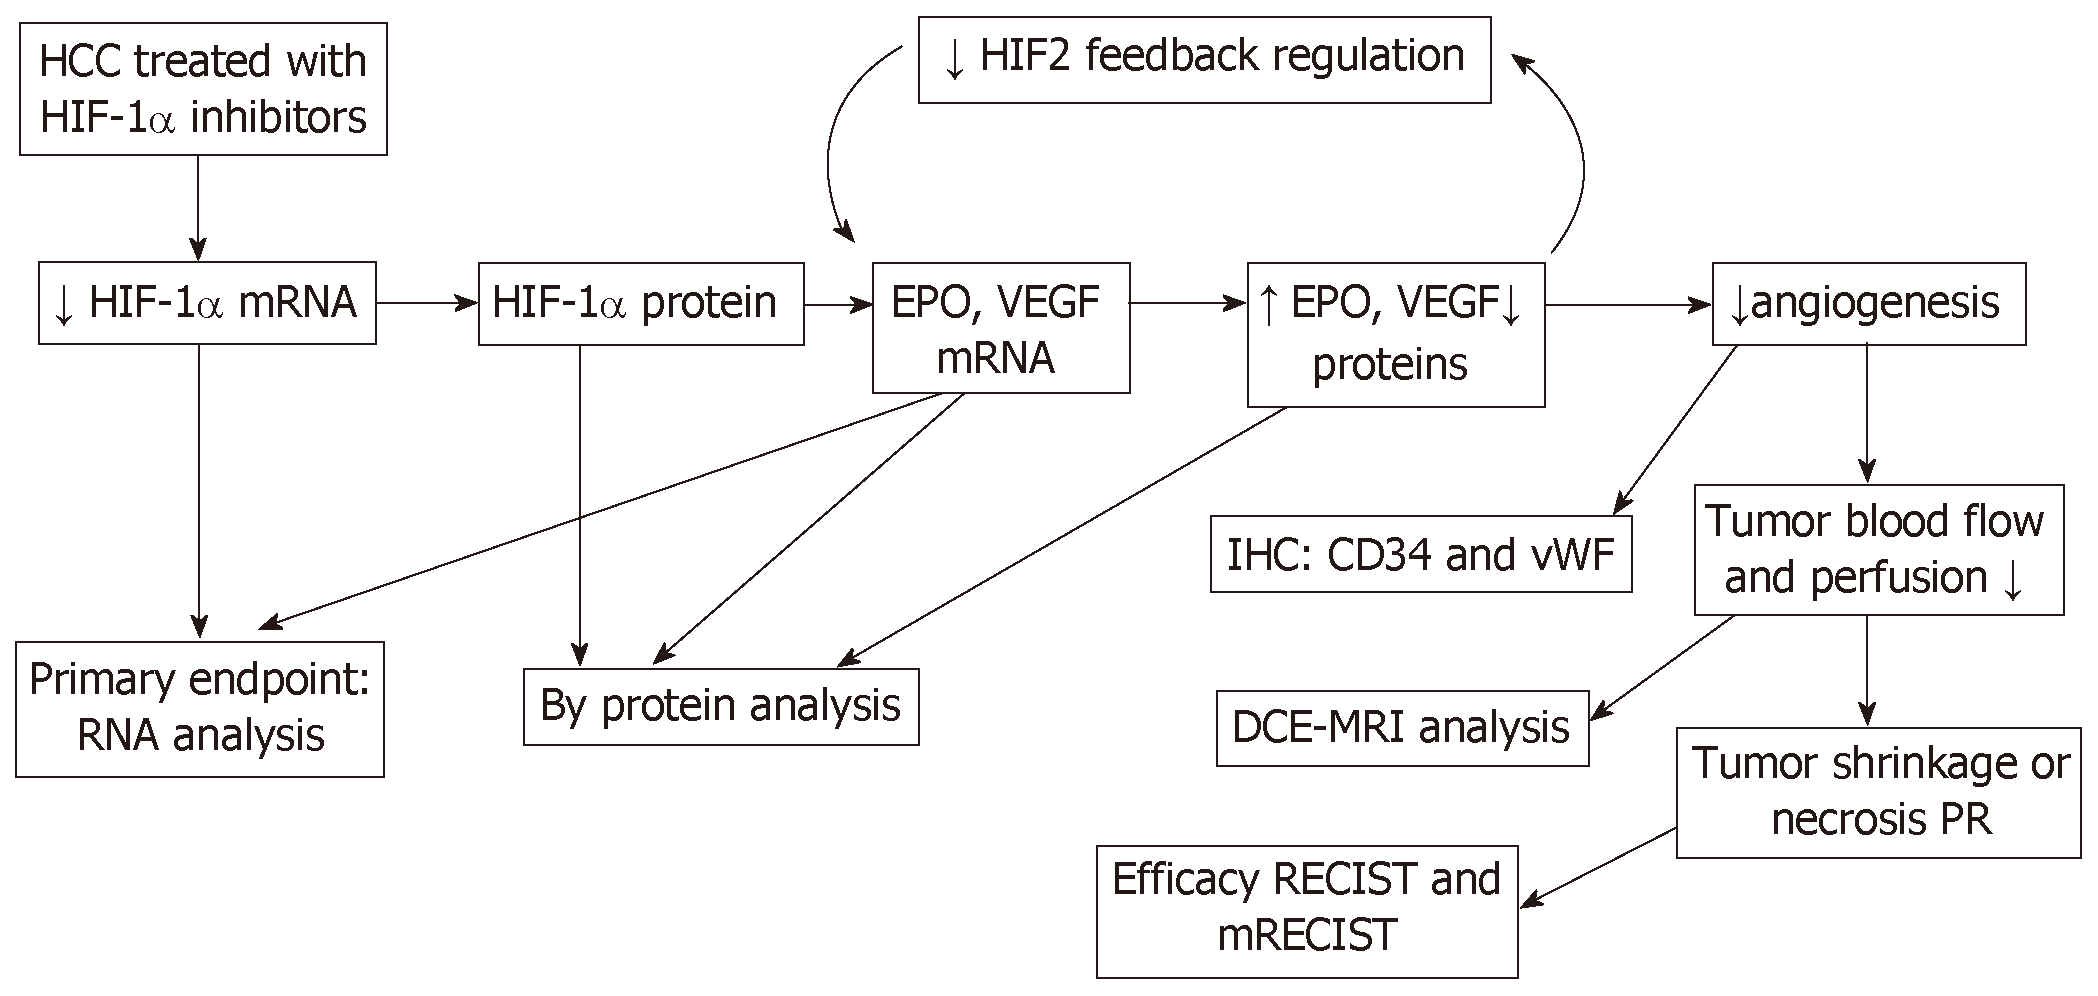
Figure 3 Biomarker analysis plan to dissect mechanism of action of hypoxia inducible factor-1αlpha inhibitors.
HIF-1α: Hypoxia inducible factor-1αlpha; HIF2: Hypoxia inducible factor 2; HIF-1α mRNA: Hypoxia inducible factor 1-alpha messenger ribonucleic acid; EPO: Erythropoietin; VEGF: Vascular epidermal growth factor; IHC: Immunohistochemistry; vWF: Von willebrand factor; CD34: Cluster of differentiation 34; PR: Partial response; DCE-MRI: Dynamic contrast-enhanced magnetic resonance imaging; RECIST: Response evaluation criteria in solid tumors.
Figure 4 CT scans of patient who achieved partial response before and after treatment.
Tumor in liver is circled by arrowheads. The size of tumor was 6.7 cm before treatment, and decreased to 3.7 cm after 4 mo of treatment, and 2.3 cm after 8 mo of treatment.
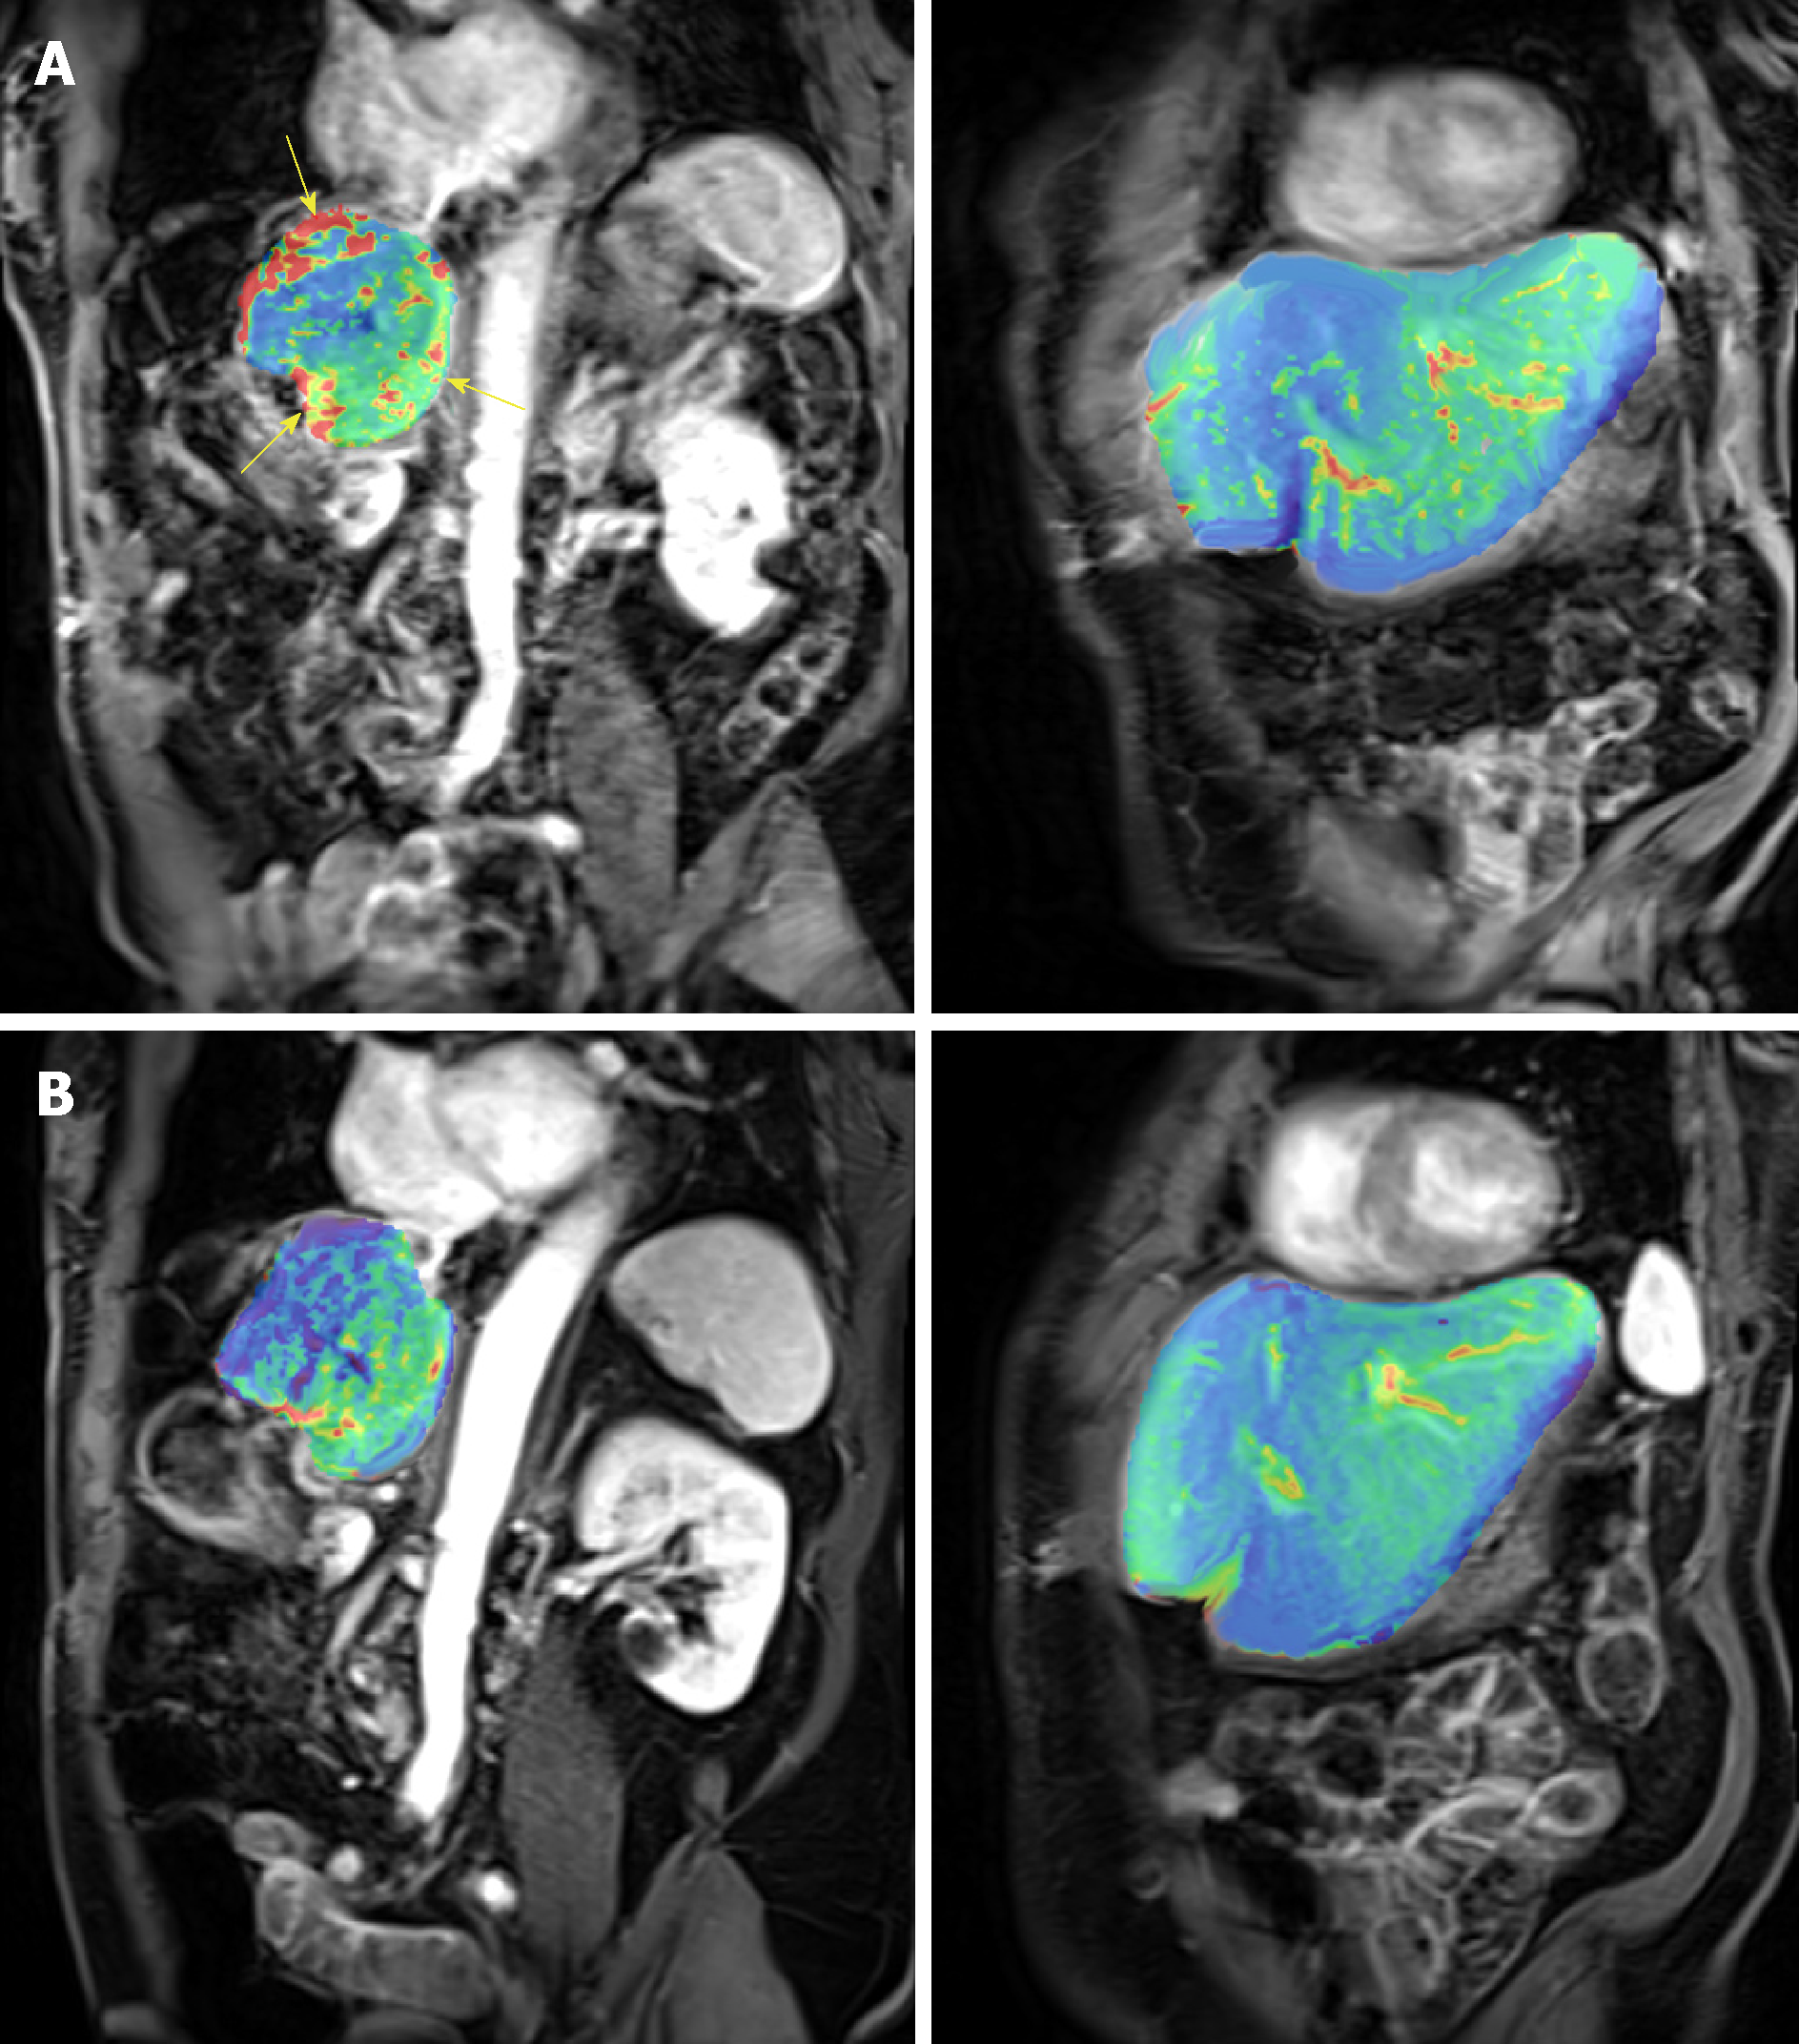
Figure 5 The effect of RO7070179 in the super responder using heat maps (red means more perfusion and green means less perfusion) between the 2 time periods (baseline 6/20/16 and after 1 cycle 7/28/16).
The change of color from red to green correlates with decrease in perfusion between those time periods. A: Pretreatment heat map from pretreatment perfusion magnetic resonance imaging (MRI) (Coronal Section); B: Post treatment heat map from posttreatment perfusion MRI (Coronal Section to include aorta which was used as internal standard for blood flow calibration).
- Citation: Wu J, Contratto M, Shanbhogue KP, Manji GA, O’Neil BH, Noonan A, Tudor R, Lee R. Evaluation of a locked nucleic acid form of antisense oligo targeting HIF-1α in advanced hepatocellular carcinoma. World J Clin Oncol 2019; 10(3): 149-160
- URL: https://www.wjgnet.com/2218-4333/full/v10/i3/149.htm
- DOI: https://dx.doi.org/10.5306/wjco.v10.i3.149


