Copyright
©2014 Baishideng Publishing Group Co.
World J Gastrointest Pathophysiol. Feb 15, 2014; 5(1): 33-39
Published online Feb 15, 2014. doi: 10.4291/wjgp.v5.i1.33
Published online Feb 15, 2014. doi: 10.4291/wjgp.v5.i1.33
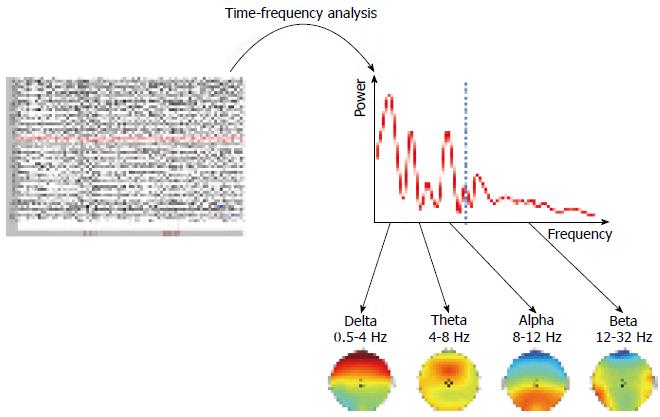
Figure 1 Spectral analysis of resting electroencephalography.
The multi-channel resting electroencephalography is recorded, and pre-processed including filtering, interpolation of channels with abnormal signal shape and de-artifacting. For each channel (in this example the Cz electrode - highlighted in red), time-frequency analysis is applied to extract the spectral distribution of the signal. The distribution is summed in standard frequency bands: delta, theta, alpha and beta, and results for each band presented on topographical maps (the Cz results are indicated by a black circle). Each channel shows its own spectral distribution, with the typical pattern: delta (frontal), theta (centro-frontal), alpha (occipital), and beta (temporal).
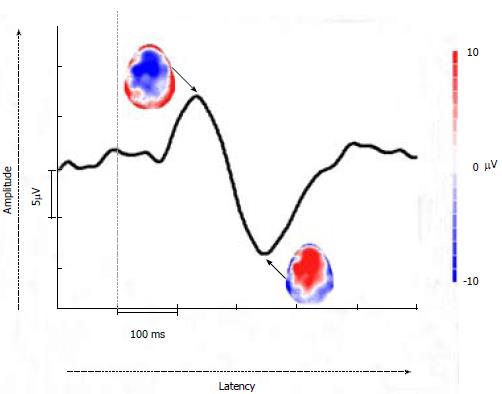
Figure 2 A typical visceral evoked potential at the central site on the scalp (Cz electrode).
The two main peaks can be seen from the waveform. The two topographies at each of the peaks, representing the amplitude of evoked potentials over the entire scalp, are shown. Evoked potential waveforms and topographies can be used to analyze changes in amplitudes, latencies, and topographical distribution due to pain in chronic pancreatitis.
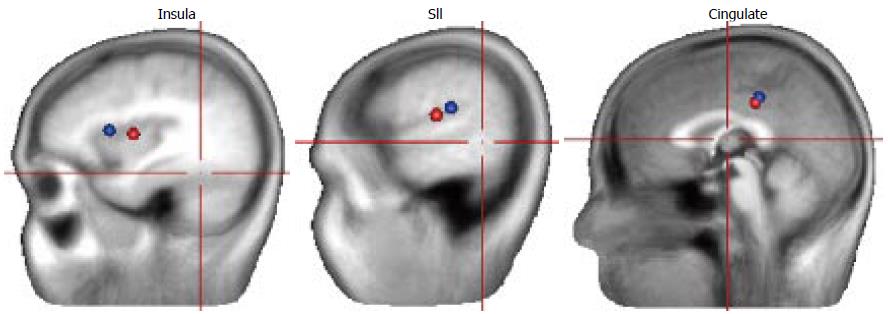
Figure 3 Analysis of underlying sources.
This figure shows a typical 5-source model of visceral evoked potentials (bilateral insula, bilateral secondary somatosensory cortex, and cingulate). A posterior shift of the insula source can be seen[27]. SII: Secondary somatosensory cortex.
- Citation: Lelic D, Olesen SS, Graversen C, Brock C, Valeriani M, Drewes AM. Electrophysiology as a tool to unravel the origin of pancreatic pain. World J Gastrointest Pathophysiol 2014; 5(1): 33-39
- URL: https://www.wjgnet.com/2150-5330/full/v5/i1/33.htm
- DOI: https://dx.doi.org/10.4291/wjgp.v5.i1.33


