Copyright
©The Author(s) 2017.
World J Radiol. Apr 28, 2017; 9(4): 206-211
Published online Apr 28, 2017. doi: 10.4329/wjr.v9.i4.206
Published online Apr 28, 2017. doi: 10.4329/wjr.v9.i4.206
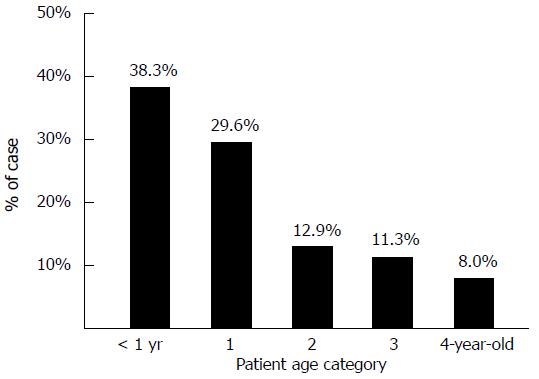
Figure 1 Age distribution of patient cohort.
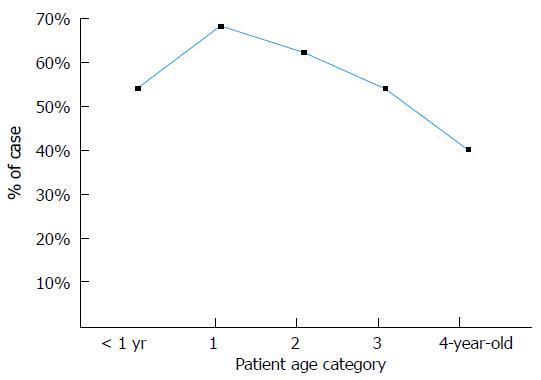
Figure 2 Rate of radiographic evidence of lower respiratory tract infection according to patient age.
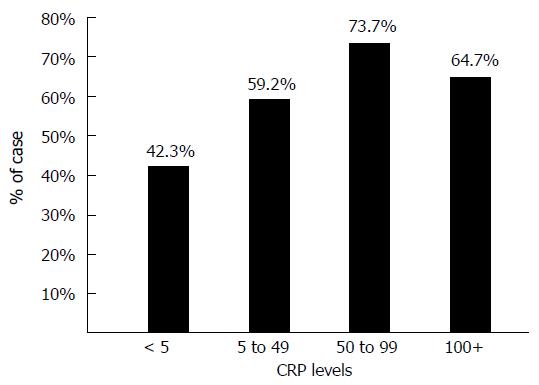
Figure 3 Rate of radiographic evidence of lower respiratory tract infection according to patient C-reactive protein levels.
CRP: C-reactive protein.
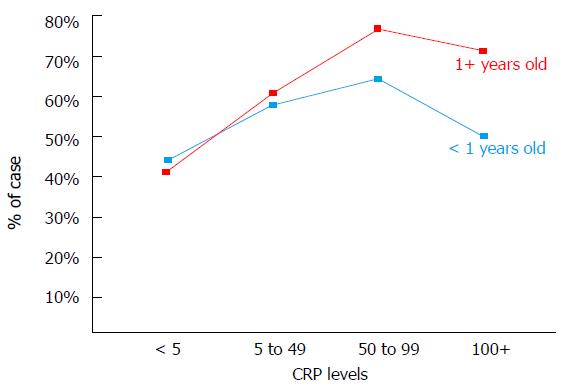
Figure 4 Rate of radiographic evidence of lower respiratory tract infection according to patient age and C-reactive protein level.
CRP: C-reactive protein.
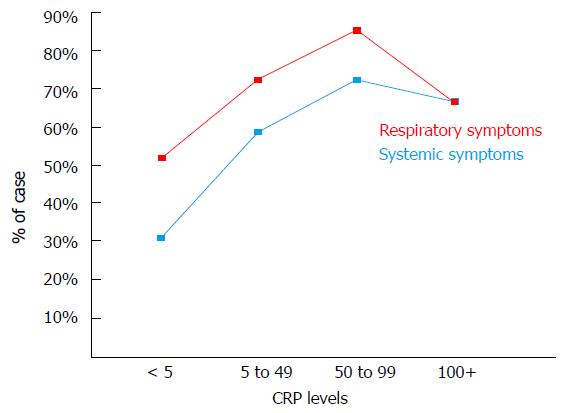
Figure 5 Rate of radiographic evidence of lower respiratory tract infection according to patient symptoms and C-reactive protein level.
CRP: C-reactive protein.
- Citation: Twomey M, Fleming H, Moloney F, Murphy KP, Crush L, O’Neill SB, Flanagan O, James K, Bogue C, O’Connor OJ, Maher MM. C-reactive protein and radiographic findings of lower respiratory tract infection in infants. World J Radiol 2017; 9(4): 206-211
- URL: https://www.wjgnet.com/1949-8470/full/v9/i4/206.htm
- DOI: https://dx.doi.org/10.4329/wjr.v9.i4.206


