Copyright
©The Author(s) 2016.
World J Radiol. Jun 28, 2016; 8(6): 594-599
Published online Jun 28, 2016. doi: 10.4329/wjr.v8.i6.594
Published online Jun 28, 2016. doi: 10.4329/wjr.v8.i6.594
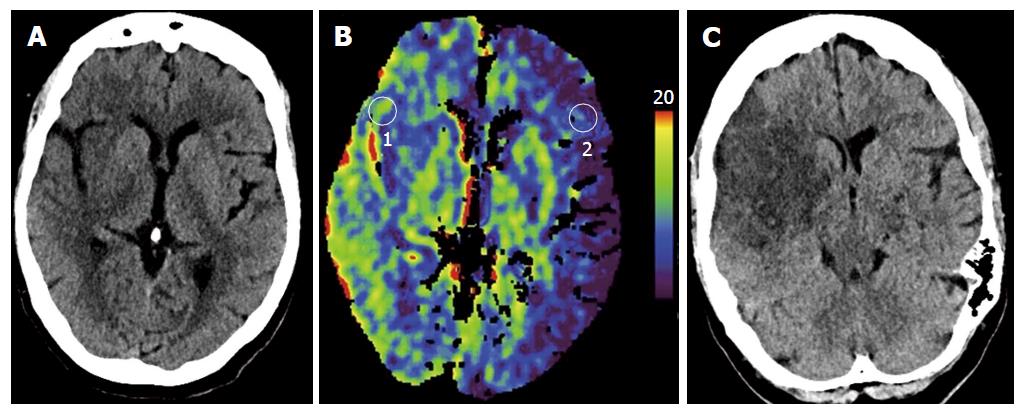
Figure 1 An extended computed tomography perfusion protocol in a patient with petechial hemorrhage in the ischemic/infarcted brain following tissue plasminogen activator.
A: The unenhanced CT shows loss of the gray white interface in the right insula; B: PS map with ROI over the affected territory and unaffected territory on the contralateral side. PS values are 1.38 and 2.95 mL/100 per minute on the unaffected and affected sides, respectively; C: Follow-up imaging the next day showed petechial hemorrhage in the infarcted tissue. ROI: Region of interest; CT: Computed tomography; PS: Permeability-surface area product maps.
- Citation: Yen P, Cobb A, Shankar JJS. Does computed tomography permeability predict hemorrhagic transformation after ischemic stroke? World J Radiol 2016; 8(6): 594-599
- URL: https://www.wjgnet.com/1949-8470/full/v8/i6/594.htm
- DOI: https://dx.doi.org/10.4329/wjr.v8.i6.594


