Copyright
©The Author(s) 2016.
World J Radiol. Mar 28, 2016; 8(3): 322-330
Published online Mar 28, 2016. doi: 10.4329/wjr.v8.i3.322
Published online Mar 28, 2016. doi: 10.4329/wjr.v8.i3.322
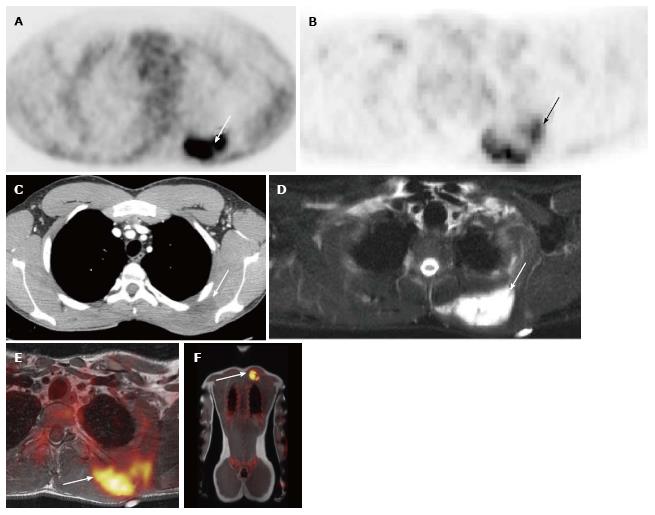
Figure 1 19-year-old male with undifferentiated malignant small round cell sarcoma.
Axial image from the PET-CT examination (A) shows intense uptake in mass in the left upper back (white arrow); axial image from the PET-MRI examination (B) shows similar FDG uptake in this region (white arrow); axial CT image from the PET-CT (C) shows a slightly hypodense mass in this region (white arrow). This mass is much better seen on the axial T2 fat suppressed image from the PET-MRI (D) (white arrow). Fused PET-MRI images [T1-weighted axial (E) and whole body coronal (F) MR sequences] again show intense FDG uptake associated with the mass in the left upper back (white arrows). PET-MRI: Positron emission tomography-magnetic resonance imaging; CT: Computed tomography; FDG: Fluorodeoxyglucose.
Figure 2 12-year-old male with rhabdomyosarcoma.
Axial PET image from PET-MRI (A) shows intense FDG uptake in the left parapharyngeal region (black arrow). Axial PET image from PET-CT (B) shows similar uptake in the same region (black arrow). Coronal T2-weighted fat suppressed image from the MRI portion of the examination (C) clearly shows extent of tumor (white arrow) including perineural spread through foramen rotundum (white dashed arrow). Tumor is not as well delineated on this coronal CT image from the PET-CT examination (D) (white arrow). PET-MRI: Positron emission tomography-magnetic resonance imaging; CT: Computed tomography; FDG: Fluorodeoxyglucose.
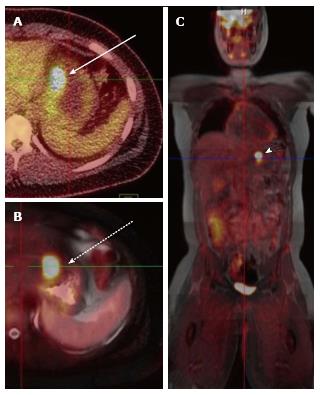
Figure 3 14-year-old male with gastrointestinal stromal tumor.
Axial fused PET-CT image (A) shows intense uptake along the lesser curvature of the stomach (white arrow). Axial fused PET-MRI image (B) (T2-weighed HASTE sequence) shows similar intense uptake along the lesser curvature (dashed arrow). Coronal whole body fused PET-MRI image (C) (T1 VIBE sequence) shows intense uptake in the same region (arrowhead). PET-MRI: Positron emission tomography-magnetic resonance imaging; CT: Computed tomography.
Figure 4 18-year-old male with follicular lymphoma of the right parotid gland.
Axial fused PET-CT image (A) shows intense uptake in the region of the right parotid gland (white arrow). Axial fused PET-MRI image (B) (T2 HASTE sequence) shows similar intense uptake in the right parotid (yellow image). Axial T2 HASTE image (C) shows a focal T2-hyperintense mass in the right parotid. This mass was not well seen on CT. PET-MRI: Positron emission tomography-magnetic resonance imaging; CT: Computed tomography.
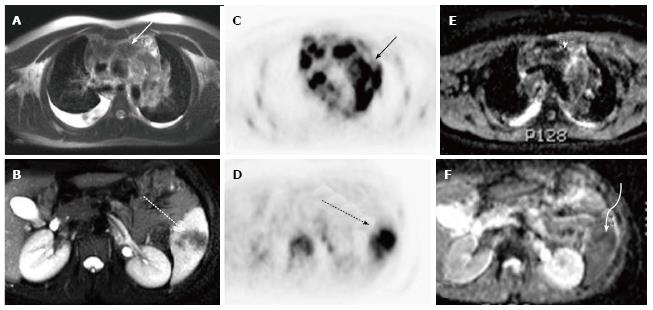
Figure 5 18-year-old male with nodular sclerosing Hodgkin’s lymphoma.
Axial T2-weighted MRI images of the chest (A) and abdomen (B) demonstrate enlarged mediastinal lymph nodes (white solid arrow) and a region of hypointensity within the spleen (white dashed arrow). Axial images from the concurrently obtained PET examination (C and D) demonstrate intense radiotracer uptake within the mediastinal lymph nodes (solid black arrow) and spleen (dashed black arrow). Axial ADC map images through the same regions (E and F) show areas of decreased signal intensity corresponding to the areas of radiotracer uptake (arrowhead and curve arrow). PET: Positron emission tomography; MRI: Magnetic resonance imaging; ADC: Apparent diffusion coefficient.
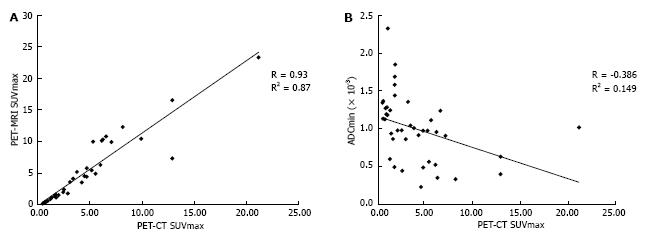
Figure 6 Correlation between positron emission tomography-magnetic resonance imaging biomarkers and positron emission tomography-computed tomography and ADCmin values with positron emission tomography-computed tomography SUVmax.
A: PET-MRI SUVmax as a function of PET-CT SUVmax; B: PET-MRI ADCmin as a function of PET-CT SUVmax. PET-MRI: Positron emission tomography-magnetic resonance imaging; CT: Computed tomography; ADCmin: Minimum apparent diffusion coefficient; SUVmax: Maximum standardized uptake value.
- Citation: Pugmire BS, Guimaraes AR, Lim R, Friedmann AM, Huang M, Ebb D, Weinstein H, Catalano OA, Mahmood U, Catana C, Gee MS. Simultaneous whole body 18F-fluorodeoxyglucose positron emission tomography magnetic resonance imaging for evaluation of pediatric cancer: Preliminary experience and comparison with 18F-fluorodeoxyglucose positron emission tomography computed tomography. World J Radiol 2016; 8(3): 322-330
- URL: https://www.wjgnet.com/1949-8470/full/v8/i3/322.htm
- DOI: https://dx.doi.org/10.4329/wjr.v8.i3.322


