Copyright
©The Author(s) 2016.
World J Radiol. Mar 28, 2016; 8(3): 288-297
Published online Mar 28, 2016. doi: 10.4329/wjr.v8.i3.288
Published online Mar 28, 2016. doi: 10.4329/wjr.v8.i3.288
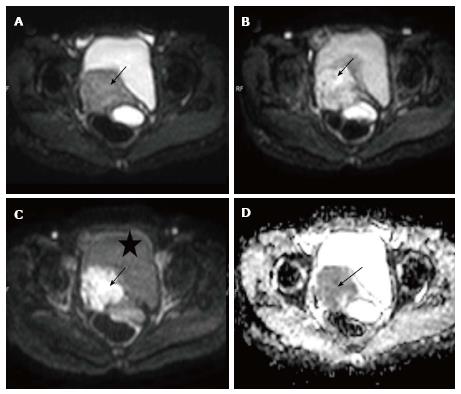
Figure 1 Carcinoma cervix.
Axial diffusion weighted imagings of a biopsy proven case of carcinoma cervix show a mass (arrow) involving the cervix having hyper intense signal on b 0 (A), b 400 (B) and b 800 (C) images; Note the progressive loss of signal of the urinary bladder (marked as asterisk) as the B value increases; the mass is also hypointense on corresponding apparent diffusion coefficient image (D) confirming true diffusion restriction.
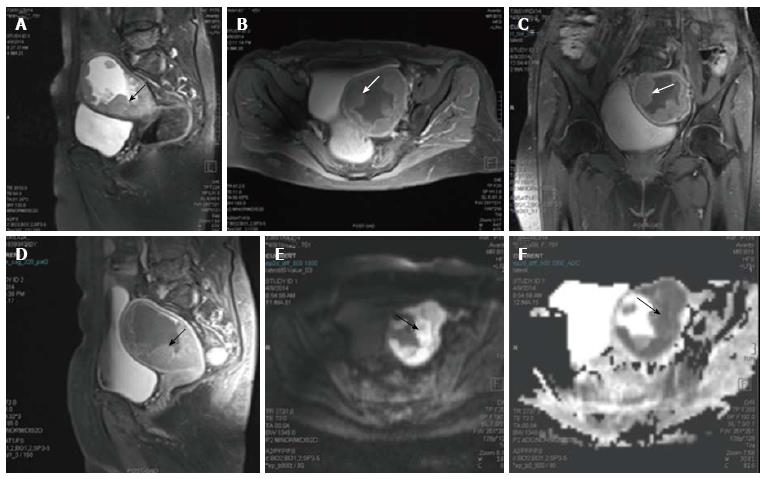
Figure 2 Endometrial carcinoma.
Sagittal T2 weighted magnetic resonance image of a female who presented with menorrhagia. It shows irregular nodular thickening of the endometrial (arrow in A). The lesion on post contrast axial (B), coronal (C) and sagittal (D) images shows enhancement. On diffusion weighted imaging (E) and corresponding apparent diffusion coefficient (F) images, the lesion showed significant restriction of diffusion. The tumour is limited to the outer myometrium and no parametrial invasion noted suggesting a T1c disease. This lesion on biopsy turned out to be carcinoma endometrium.
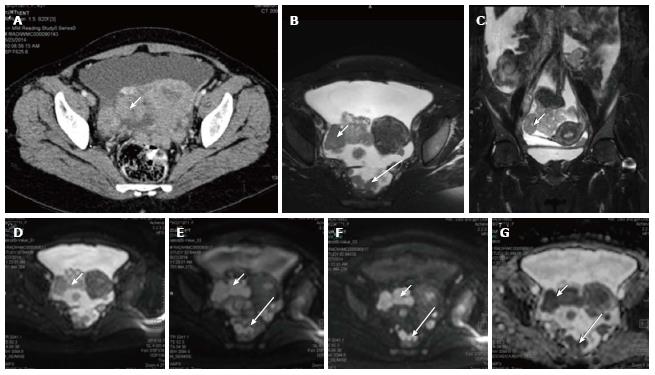
Figure 3 Carcinoma ovary.
Axial contrast enhanced computed tomography image (A), T2 weighted axial (B) and coronal (C) images of a patient with known ovarian cancer shows right adnexal mass (arrows) multiple deposits in peritoneum of the pelvis (long arrows); On DWI, b 0 (D), b 400 (E), b 800 (F) and ADC (G) images show significant diffusion restriction in the primary (arrow) as well as peritoneal deposits (long arrow). These lesions were proven to be malignant deposits on fine needle aspiration cytology. ADC: Apparent diffusion coefficient; DWI: Diffusion weighted imaging.
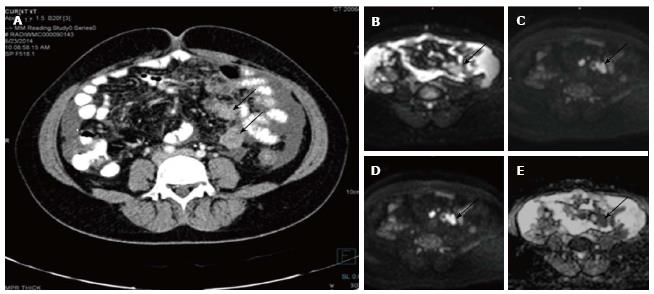
Figure 4 Serosal deposits in carcinoma ovary.
Axial contrast enhanced computed tomography image (A) of a patient with known ovarian cancer shows enhancing soft tissues (arrows) over the surface of small bowel suggestive of serosal deposits. On diffusion weighted imaging, b 0 (B), b 400 (C), b 800 (D) and ADC (E) images show significant diffusion restriction in the serosal deposits. These lesions were proven to be malignant deposits on fine needle aspiration cytology. ADC: Apparent diffusion coefficient.
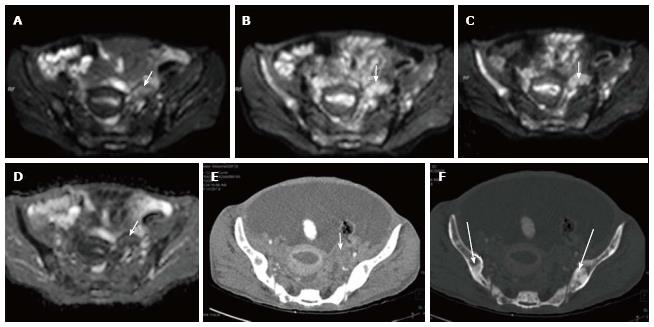
Figure 5 Left ovarian metastasis.
Axial diffusion weighted imaging b 0 (A), b 400 (B), b 800 (C) and ADC (D) images of known case of carcinoma breast shows significant restricted diffusion of the left ovarian mass (arrow) suggesting left ovarian metastasis. Note is also made of multiple hypertense diffusion restricting lesions in the b/lilliac bone which were metastatic deposits. Axial contrast enhanced CT (E) showing the left adnexal mass (arrow) with multiple sclerotic metastases (thick arrows) in bilateral illiac bones better seen on CT bone window image (F). ADC: Apparent diffusion coefficient; CT: Computed tomography.
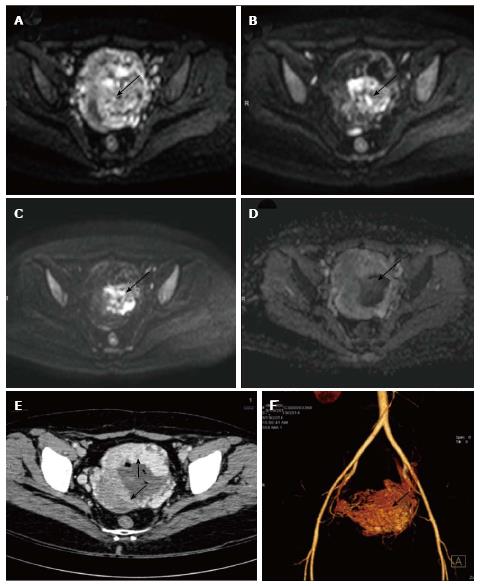
Figure 6 Gestational trophoblastic tumor.
Axial diffusion weighted imaging b 0 (A), b 400 (B) and b 800 (C) and images of known case of gestational trophoblastic tumor shows significant restricted diffusion in the center of the mass (arrow). Note there is spurious restriction in ADC image (D). Axial contrast enhanced CT (E) showing the enhancing uterine mass (arrows) with nonenhancing central area likely hemorrhage which is responsible for the spurious diffusion restriction on DWI. CT angiography image (F) showing marked vascularity of the mass leading to intratumoral hemorrhage. ADC: Apparent diffusion coefficient; DWI: Diffusion weighted imaging; CT: Computed tomography.
- Citation: Manoharan D, Das CJ, Aggarwal A, Gupta AK. Diffusion weighted imaging in gynecological malignancies - present and future. World J Radiol 2016; 8(3): 288-297
- URL: https://www.wjgnet.com/1949-8470/full/v8/i3/288.htm
- DOI: https://dx.doi.org/10.4329/wjr.v8.i3.288


