Copyright
©The Author(s) 2016.
World J Radiol. Mar 28, 2016; 8(3): 255-267
Published online Mar 28, 2016. doi: 10.4329/wjr.v8.i3.255
Published online Mar 28, 2016. doi: 10.4329/wjr.v8.i3.255
Math 18 Math(A1).
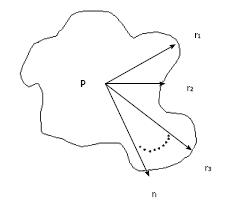
Figure 1 Sector-integration of irregular field.
Math 19 Math(A1).
Math 20 Math(A1).
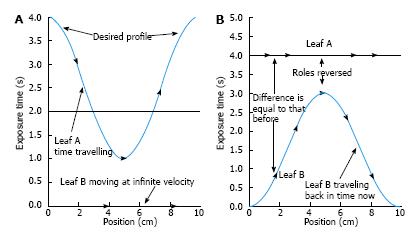
Figure 2 The portion of arrays is allowed to be interchanged between the two leaves as shown.
A: An example of a leaf pair exposure-time profile; B: The first half of the profile is made realizable by reversing the roles of leaf A and leaf B.
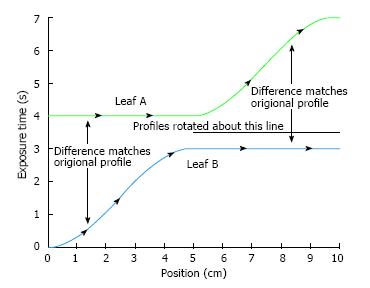
Figure 3 The roles of leaf A and leaf B are reversed again after the mid position.
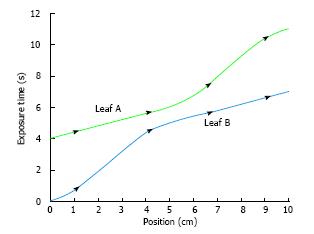
Figure 4 Profiles for both leaves are skewed to eliminate large velocities.
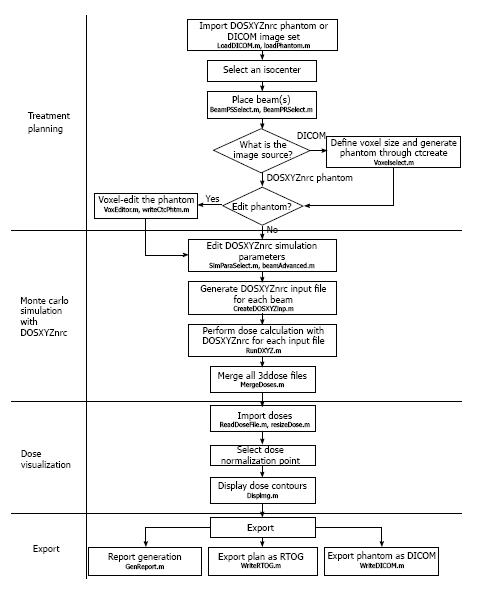
Figure 5 Block diagram showing the flowchart with main components of DOSCTP.
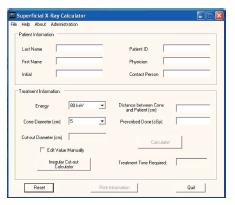
Figure 6 Front end window of superficial X-ray treatment time calculator.
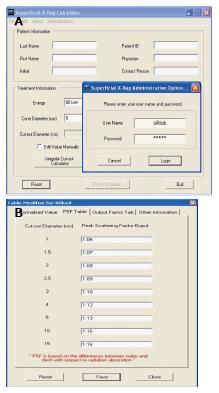
Figure 7 Password protected database (A) and comprehensive database (B).
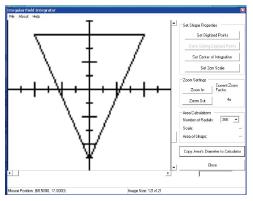
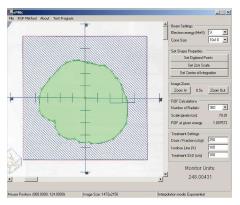
Figure 8 Irregular field calculator.
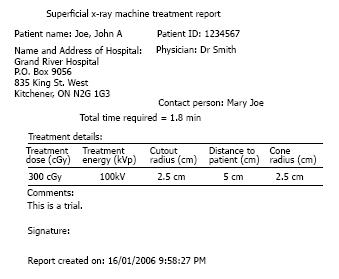
Figure 9 Record printout (hardcopy or electronic).
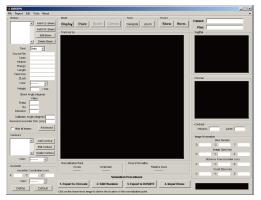
Figure 10 The front-end window of electron monitor unit calculator showing the imported irregular electron field image in the left hand side and the patient treatment parameters in the right hand side.
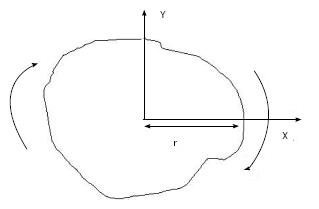
Figure 11 Schematic diagram showing the algorithm to acquire the radius in each divided angular segment in the irregular field.
Instead of rotating the vectors from the central axis towards the field edge, the whole field is rotated cutting through the positive X-axis.
Figure 12 Front-end window of sliding window intensity modulated radiotherapy.
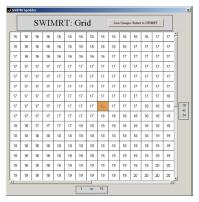
Figure 13 The editable image grid under the subroutine “SWIMRTgridder”.
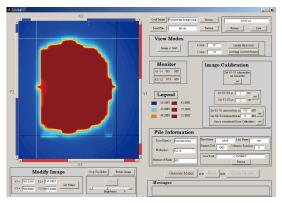
Figure 14 The front-end window of DOSCTP.
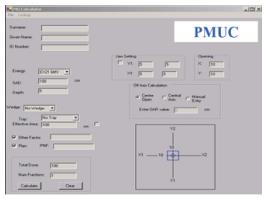
Figure 15 The front-end window of photon beam monitor unit calculator.
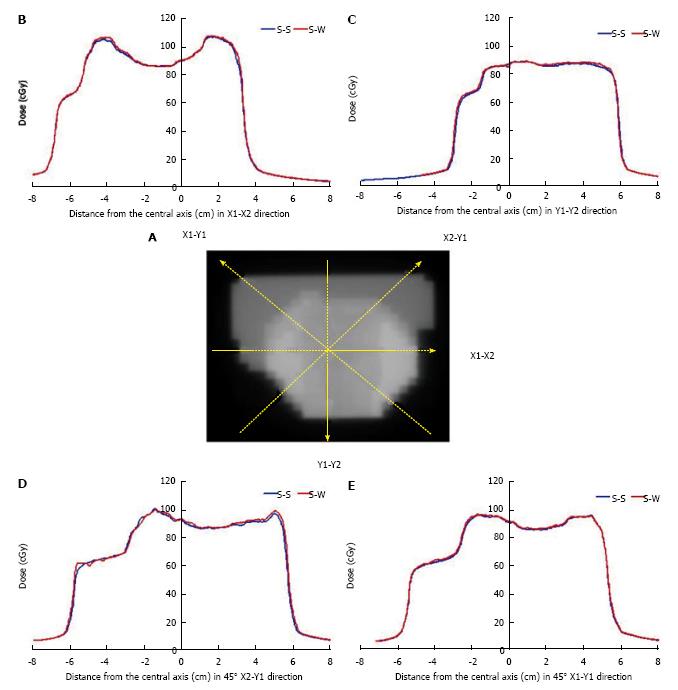
Figure 16 Fluence map of an anterior-posterior beam segment.
A: Fluence map for an anterior-posterior segmental beam for the prostate IMRT; B-F: The broken lines represent the beam profiles measured at the X1-X2 (B), Y1-Y2 (C), 45° X2-Y1 (D) and 45° X1-Y1 (E) direction. The blue curve is the profile using the step-and-shoot algorithm (S-S), while the red curve is the profile using the sliding window (S-W) algorithm from Pinnacle3 and SWIMRT respectively.
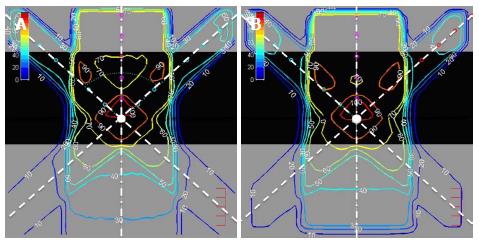
Figure 17 Two dimensional dose distributions of an inhomogeneous solid phantom with lung slab of 0.
5 g/cm3 irradiated by three 6 MV photon beams calculated using DOSCTP (A) and Pinnacle3 (B).
- Citation: Chow JCL. Some computer graphical user interfaces in radiation therapy. World J Radiol 2016; 8(3): 255-267
- URL: https://www.wjgnet.com/1949-8470/full/v8/i3/255.htm
- DOI: https://dx.doi.org/10.4329/wjr.v8.i3.255


