Copyright
©The Author(s) 2016.
World J Radiol. Feb 28, 2016; 8(2): 174-182
Published online Feb 28, 2016. doi: 10.4329/wjr.v8.i2.174
Published online Feb 28, 2016. doi: 10.4329/wjr.v8.i2.174
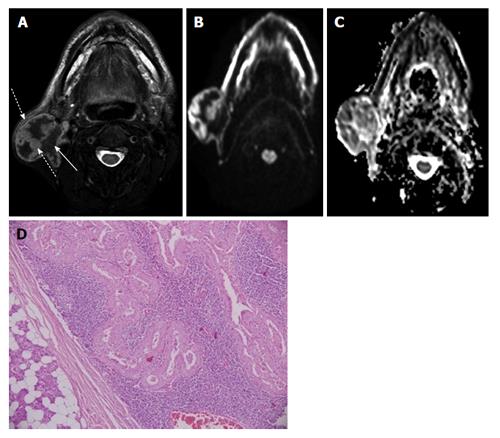
Figure 1 Warthin’s tumour in right parotid gland in a 60-year-old man.
A: Axial T2W FS image shows heterogeneous solid-cystic mass arising exophytically from right parotid gland with mildly hyperintense septae and mural nodules (dashed arrow) while cystic areas are hypointense (solid arrow); B and C: DWI at b1000 (B) s/mm² and ADC map (C) show restricted diffusion in septae and mural nodules of the mass; D: Photomicrograph shows a well encapsulated tumor comprising of acini with oncocytic change separated by sheets of lymphocytes (H-E; original magnification: × 100). DWI: Diffusion weighted imaging; ADC: Apparent diffusion coefficient.
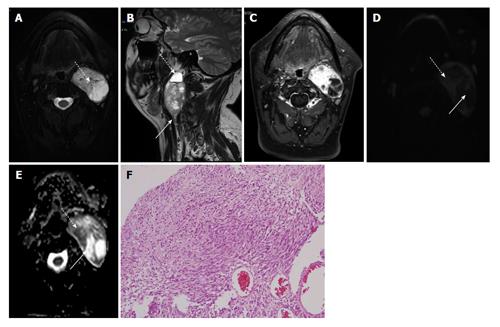
Figure 2 Left parapharyngeal space nerve sheath tumour in a 35-year-old lady.
A: Axial T2W FS image shows multiple intensely T2 hyperintense areas within suggestive of cystic degeneration (dashed arrow); B: Sagittal T2W image shows blood fluid level within the cystic areas (dashed arrow) along with thickened distal exiting nerve (solid arrow); C: Axial T1W FS post contrast image shows intense enhancement in solid areas of the mass while cystic areas are hypointense; D and E: DWI at b1000 (D) s/mm² and ADC map (E) show restricted diffusion in solid areas of the mass (dashed arrow) while cystic areas show free diffusion (solid arrows); F: Photomicrograph shows alternating hypercellular (Antoni A) and hypocellular (Antoni B) areas (H-E; original magnification: × 100). DWI: Diffusion weighted imaging; ADC: Apparent diffusion coefficient.
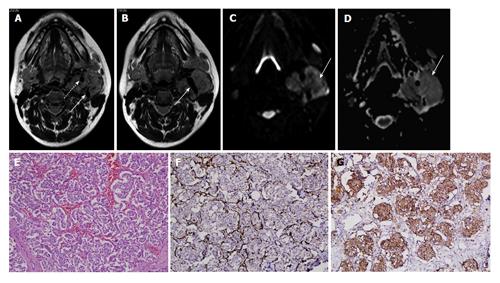
Figure 3 Carotid body tumour in a 30-year-old lady.
A and B: Axial T2W images show heterogeneously hyperintense mass in left carotid space splaying the bifurcation of left common carotid artery (arrow in B) with encasement of both ECA and ICA (dashed arrow and solid arrow in A, respectively); C and D: DWI at b500 s/mm² (C) and ADC map (D) show restricted diffusion in the mass; E: Photomicrographs show tumor cells arranged in Zellballen pattern separated by thin fibrovascular septae (H-E; original magnification: × 200); F and G: S-100 immunostain demonstrating prominence of sustentacular cells at the periphery of the tumor cell nests (F, original magnification, × 200) and tumor cells are immunopositive for synaptophysin (G, original magnification: × 200). DWI: Diffusion weighted imaging; ADC: Apparent diffusion coefficient; ECA: External carotid artery; ICA: Internal carotid artery.
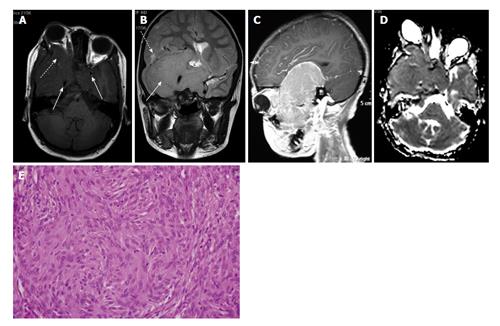
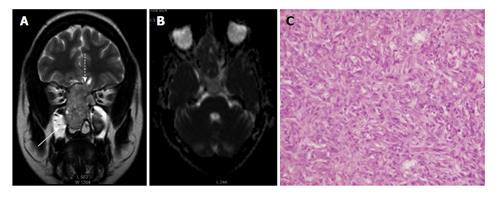
Figure 4 Craniofacial meningioma in a 7-year-old girl.
A: Axial T1W image shows isointense homogenous mass involving bilateral cavernous sinuses (solid arrows) encasing bilateral ICAs and extending to right orbit causing proptosis (dashed arrow); B: Coronal T2W image shows intracranial extension in right middle cranial fossa (solid arrow) with mild perilesional edema in adjacent cerebral parenchyma (dashed arrow); C: Sagittal T1W FS post-gadolinium image reveals intense homogeneous enhancement in the mass; D: ADC map showing homogenous restricted diffusion in the mass; E: Photomicrograph show tumour composed of spindled to polygonal cells with moderate amount of cytoplasm, vesicular nuclei and whorl formation at places (H-E; original magnification: × 400). ADC: Apparent diffusion coefficient; ICA: Internal carotid artery.
Figure 5 Solitary fibrous tumour in a 24-year-old man.
A: Coronal T2W image shows well defined left parapharyngeal space mass with heterogeneously hyperintense signal. The core is more hyperintense than the periphery. Multiple tortuous flow voids seen in the mass (solid arrows); B and C: DWI at b1000 (B) s/mm² and corresponding ADC map (C) show restricted diffusion in the periphery of the mass (dashed arrows) while the centre shows free diffusion (solid arrow); D: Photomicrographs show alternating cellular and hypocellular areas with abundant collagen (H-E; original magnification: × 200); E and F: Masson trichrome stain highlighting abundant collagen (E; original magnification: × 200); tumor cells are diffusely immunopositive for CD34 (F; original magnification: × 400). DWI: Diffusion weighted imaging; ADC: Apparent diffusion coefficient.
Figure 6 Sinonasal hemangiopericytoma in a 45-year-old lady.
A: Coronal T2W image shows mildly expansile sinonasal mass involving, extending to bilateral ethmoid sinuses. Small intracranial extension noted in anterior cranial fossa (dashed arrow); Retained secretions in right maxillary sinus (solid arrow); B: ADC map shows restricted diffusion in the mass; C: Photomicrograph shows spindle cells with mild pleomorphism (H-E; original magnification: × 100). ADC: Apparent diffusion coefficient.
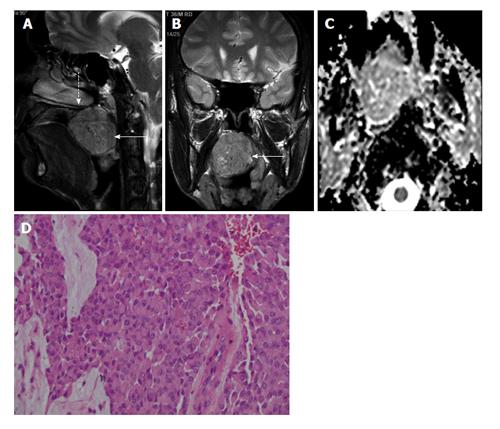
Figure 7 Myoepithelial tumour in a 36-year-old man.
A and B: Sagittal T2W image shows well defined T2 hyperintense mass arising from posterior part of soft palate (dashed arrow in A and B) and into the oropharynx (solid arrow in A and B); C: ADC map shows restricted diffusion in the mass; D: Photomicrograph shows cells with abundant cytoplasm and minimal pleomorphism (H-E; original magnification: × 100).
- Citation: Das A, Bhalla AS, Sharma R, Kumar A, Sharma M, Gamanagatti S, Thakar A, Sharma S. Benign neck masses showing restricted diffusion: Is there a histological basis for discordant behavior? World J Radiol 2016; 8(2): 174-182
- URL: https://www.wjgnet.com/1949-8470/full/v8/i2/174.htm
- DOI: https://dx.doi.org/10.4329/wjr.v8.i2.174


