Copyright
©The Author(s) 2016.
World J Radiol. Nov 28, 2016; 8(11): 887-894
Published online Nov 28, 2016. doi: 10.4329/wjr.v8.i11.887
Published online Nov 28, 2016. doi: 10.4329/wjr.v8.i11.887
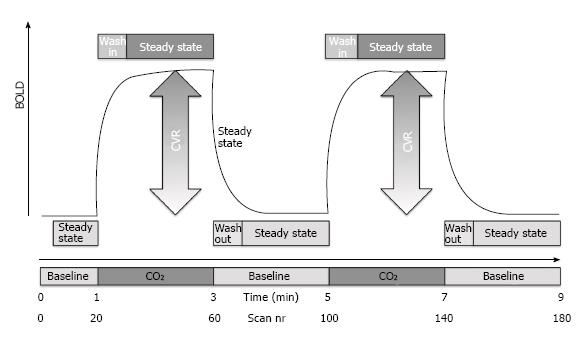
Figure 1 Schematic representation of the ON-OFF CO2 challenge of 7% CO2 applied via a simple nasal cannula.
The magnitude of the CO2 induced change in the blood oxygenation level dependent (BOLD) response represents the cerebrovascular reserve (CVR).
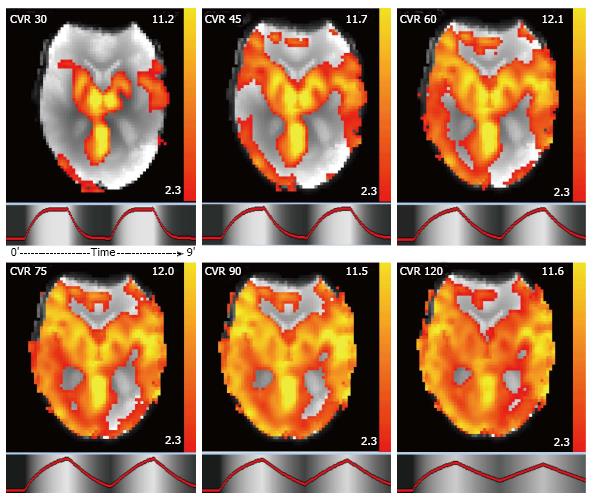
Figure 2 CO2BOLD cerebrovascular reserve maps in axial view.
To take into account delayed vascular response due to the proximal vascular stenosis, the delay of the CO2 induced BOLD response was varied from 30, 45, 60, 75, 90 to 120 s. Units = Z value. CVR: Cerebrovascular reserve.
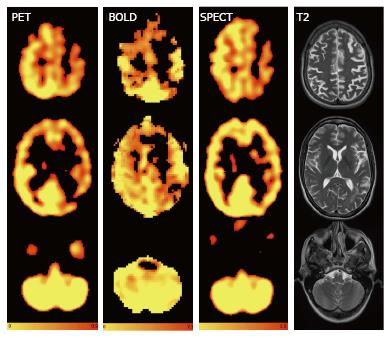
Figure 3 Axial images of a sample patient showing reduced cerebrovascular reserve on the left hemispheric anterior cerebral artery and middle cerebral artery territories without any diminution of the cerebrovascular reserve in the cerebellum for positron emission tomography, CO2BOLD and single photon emission computed tomography and axial T2.
The readings for the territories right ACM, right anterior cerebral artery (ACA), left ACM and left ACA were 0 (normal), 0, 2 (substantial reduction), 2 for reader A and 1, 0, 2, 2 for reader B for PET, 0, 1, 2, 2 and 1, 0, 2, 2 for CO2BOLD and 1, 1, 2, 2 and 1, 1, 2, 2 for SPECT. 0 = no reduction in CVR, 1 = mild reduction in CVR, 2 = severe reduction in CVR Color-scales represent: PET: Normalized accumulated activity, dimensionless under the assumption that 1 mL of tissue weights 1 g. BOLD: Statistical Z value, SPECT: Relative counts, normalized to the mean counts in the cerebellum, dimensionless. PET: Positron emission tomography; SPECT: Single photon emission computed tomography; BOLD: Blood oxygenation level dependent.
- Citation: Pellaton A, Bijlenga P, Bouchez L, Cuvinciuc V, Barnaure I, Garibotto V, Lövblad KO, Haller S. CO2BOLD assessment of moyamoya syndrome: Validation with single photon emission computed tomography and positron emission tomography imaging. World J Radiol 2016; 8(11): 887-894
- URL: https://www.wjgnet.com/1949-8470/full/v8/i11/887.htm
- DOI: https://dx.doi.org/10.4329/wjr.v8.i11.887


