Copyright
©The Author(s) 2015.
World J Radiol. Sep 28, 2015; 7(9): 286-293
Published online Sep 28, 2015. doi: 10.4329/wjr.v7.i9.286
Published online Sep 28, 2015. doi: 10.4329/wjr.v7.i9.286
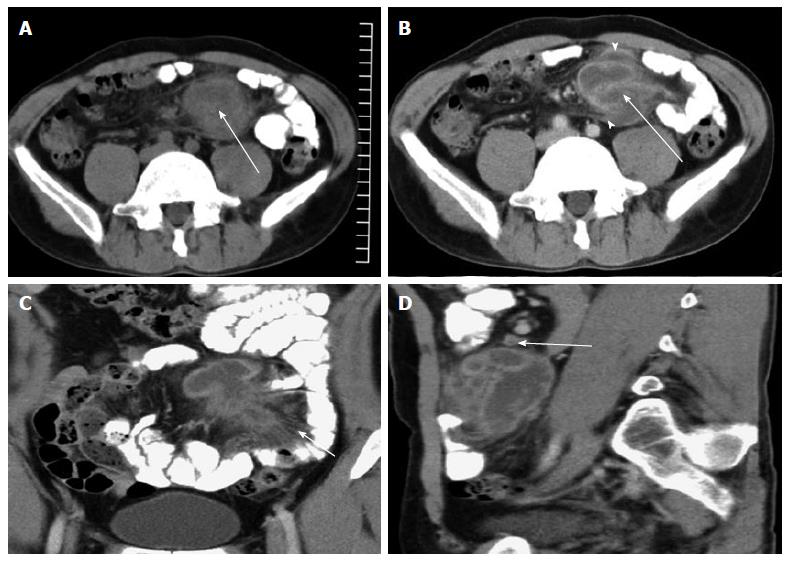
Figure 1 Tuberculous abscess in the mesentery.
A: Axial CT image showed a low density abscess measuring 4.5 cm × 6.2 cm in the small bowel mesentery (arrow); B: Axial CT image (venous phase) showing a low density abscess with enhancement of the wall and septa (arrow). Adjacent parietal peritoneum was thickened with heterogeneous enhancement (arrowhead); C: Coronal CT image showed that the abscess was irregular. The density of the mesentery was increasing. Crowded mesenteric vascular bundles and thickened fiber strands were seen (arrow); D: Sagittal CT image showed a low density abscess with rim enhancement and slightly enlarged lymph nodes (arrow). CT: Computed tomography.
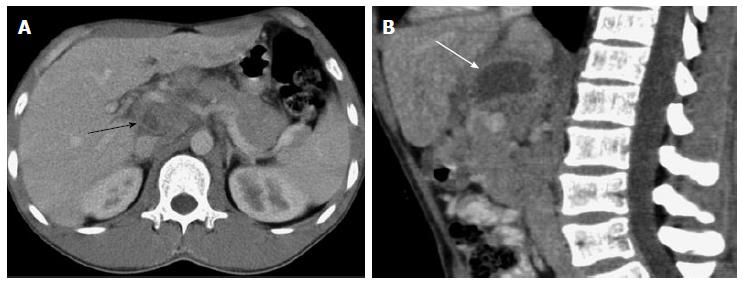
Figure 2 Tuberculous abscess located in the peripancreatic area.
A: Axial CT image showed enlarged lymph nodes in the portacaval space and peripancreatic area with rim enhancement (arrow); B: Sagittal CT image showed a peripherally enhancing, hypodense mass in the peripancreatic area (arrow), measuring approximately 3.7 cm × 4.1 cm × 4.5 cm. CT: Computed tomography.
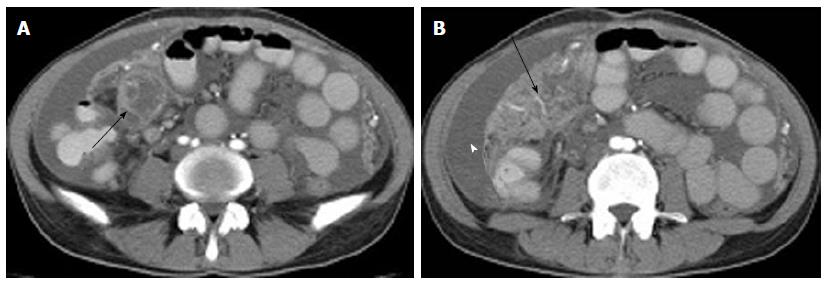
Figure 3 Tuberculous abscess located beside the jejunum.
A: Axial CT image showed a multiseptated, peripherally enhancing, hypodense mass beside the jejunum (arrow), measuring approximately 3.2 cm × 4.0 cm × 5.1 cm; B: Axial CT image showed a caked appearance of the omentum (arrow). Irregular thickened peritoneum with homogeneous enhancement and ascites were also seen (arrow head). CT: Computed tomography.
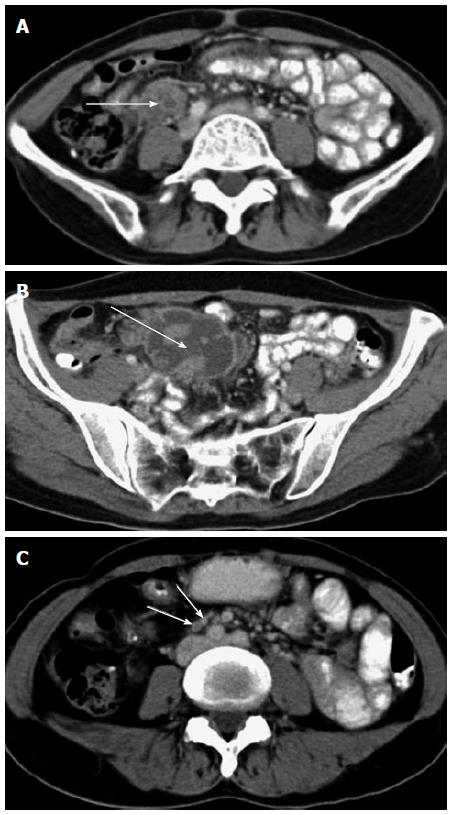
Figure 4 Two tuberculous abscesses located in the lower abdominal cavity.
A, B: Axial CT images showed 2 multiseptated, peripherally enhanced, hypodense masses located in the lower abdominal cavity (arrow), measuring approximately 2.1 cm × 3.8 cm × 5.5 cm and 5.1 cm × 6.0 cm × 6.2 cm, respectively; C: Axial CT image showed slightly enlarged lymph nodes with rim enhancement and homogeneous enhancement (arrow). CT: Computed tomography.
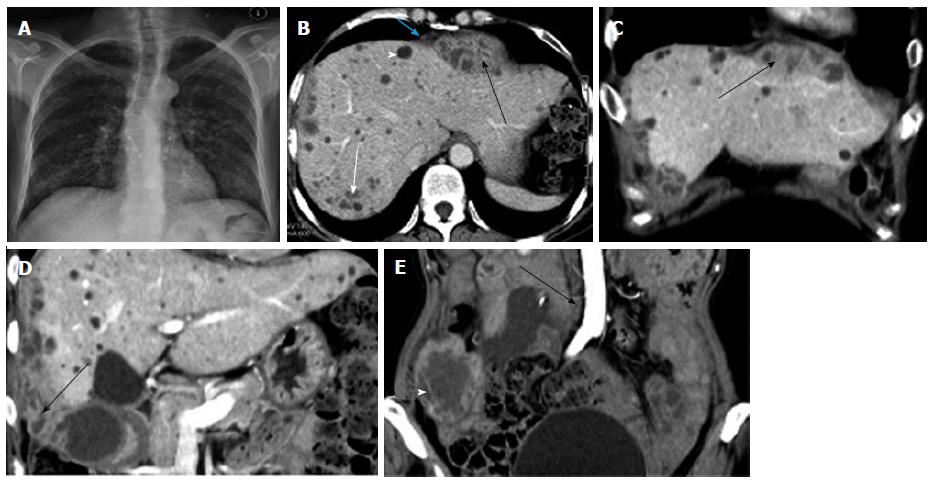
Figure 5 Three tuberculous abscesses located in the abdominal cavity.
A: Chest X-ray film showed active pulmonary tuberculosis; B, C: Axial and coronal CT images showed a multiseptated, peripherally enhanced, hypodense mass located in the subphrenic space measuring 3.0 cm × 3.5 cm × 7.2 cm (black arrow). A liver tuberculous lesion (white arrow) and liver cyst (arrowhead) were also detected. Nodular thickening of the diaphragmatic peritoneum showed homogeneous enhancement (blue arrow); D: Coronal CT image showed a multiseptated, peripherally enhanced, hypodense mass with irregular shape located in the perihepatic space measuring approximately 5.0 cm × 8.9 cm × 12.2 cm (arrow); E: Coronal CT image showed a multiseptated, peripherally enhanced, hypodense mass located in the lower abdominal cavity measuring approximately 4.5 cm × 5.8 cm × 7.0 cm (arrow head). Enlarged lymph nodes with rim enhancement located in the para-aortic region were detected (arrow). CT: Computed tomography.
- Citation: Dong P, Chen JJ, Wang XZ, Wang YQ. Intraperitoneal tuberculous abscess: Computed tomography features. World J Radiol 2015; 7(9): 286-293
- URL: https://www.wjgnet.com/1949-8470/full/v7/i9/286.htm
- DOI: https://dx.doi.org/10.4329/wjr.v7.i9.286


