Copyright
©The Author(s) 2015.
World J Radiol. Sep 28, 2015; 7(9): 236-252
Published online Sep 28, 2015. doi: 10.4329/wjr.v7.i9.236
Published online Sep 28, 2015. doi: 10.4329/wjr.v7.i9.236
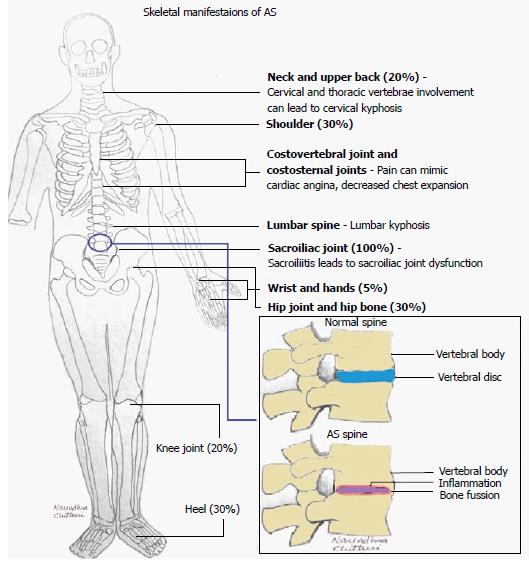
Figure 1 Schematic of skeletal manifestations of ankylosing spondylitis.
AS: Ankylosing spondylitis.
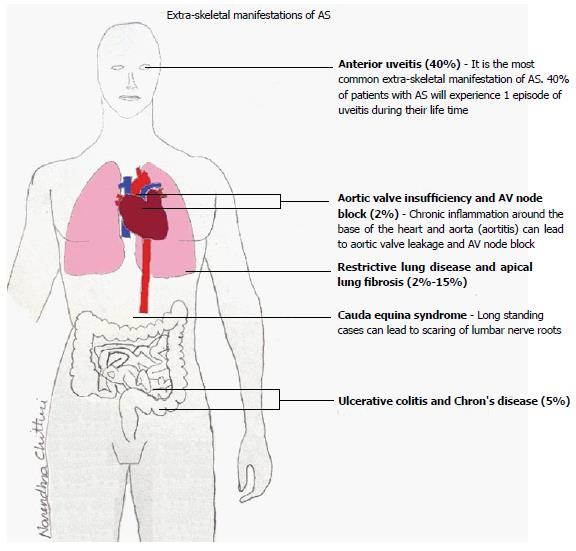
Figure 2 Schematic of extra-skeletal manifestations of ankylosing spondylitis.
AS: Ankylosing spondylitis.
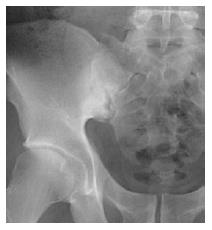
Figure 3 Anteroposterior pelvic X-ray shows pseudodilatation of the sacroiliac joint due to subchondral erosion and subchondral bone sclerosis.
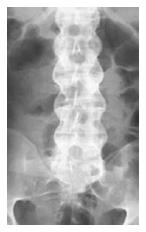
Figure 4 Anteroposterior vertebral X-ray shows bilateral thickening of the syndesmophytes resulting in the appearance of the “bamboo sign” in radiographs.
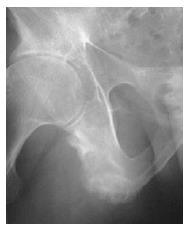
Figure 5 Anteroposterior pelvic X-ray shows ill-defined erosions with sclerosis at the side of ligaments, and tendonitis is seen as enthesopathy at certain sites around the pelvis, at the ischial tuberosity.
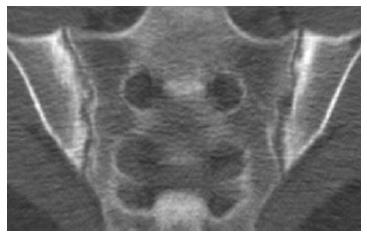
Figure 6 Computed tomography of sacroiliac joint shows bilateral subchondral sclerosis and dentate joint contour due to bone erosion.
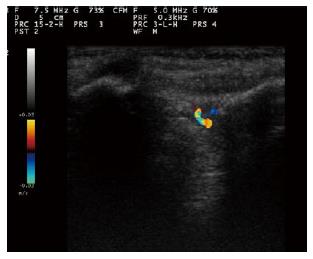
Figure 7 Color Doppler sonogram of sacroiliac joint in a patient with active sacroiliitis reveals vascularization within the posterior portion of the right sacroiliac joint.
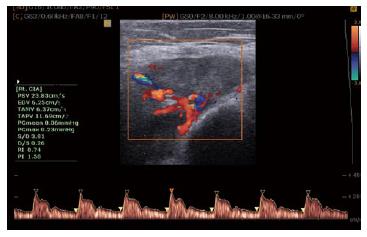
Figure 8 Color and spectral waveform Doppler ultrasonogram of the ischial tuberosity in a patient with severe enthesopathy with a mean resistive index of 0.
74 before treatment.
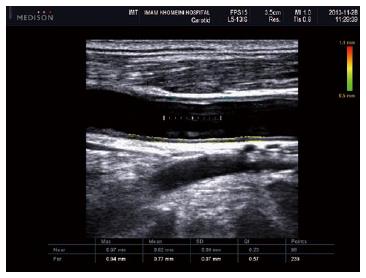
Figure 9 Ultrasonogram shows increased intima-media thickness of both near (0.
82 mm) and far wall (0.77 mm) of common carotid artery in patients with ankylosing spondylitis.
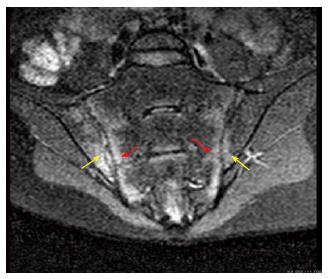
Figure 10 Oblique coronal magnetic resonance imaging (short tau inversion recovery sequence) of a patient with active ankylosing spondylitis revealed bilateral high signal intensity in both the sacral and iliac components of the sacroiliac joint.
- Citation: Ghasemi-rad M, Attaya H, Lesha E, Vegh A, Maleki-Miandoab T, Nosair E, Sepehrvand N, Davarian A, Rajebi H, Pakniat A, Fazeli SA, Mohammadi A. Ankylosing spondylitis: A state of the art factual backbone. World J Radiol 2015; 7(9): 236-252
- URL: https://www.wjgnet.com/1949-8470/full/v7/i9/236.htm
- DOI: https://dx.doi.org/10.4329/wjr.v7.i9.236


