Copyright
©2014 Baishideng Publishing Group Inc.
World J Radiol. Jul 28, 2014; 6(7): 409-416
Published online Jul 28, 2014. doi: 10.4329/wjr.v6.i7.409
Published online Jul 28, 2014. doi: 10.4329/wjr.v6.i7.409
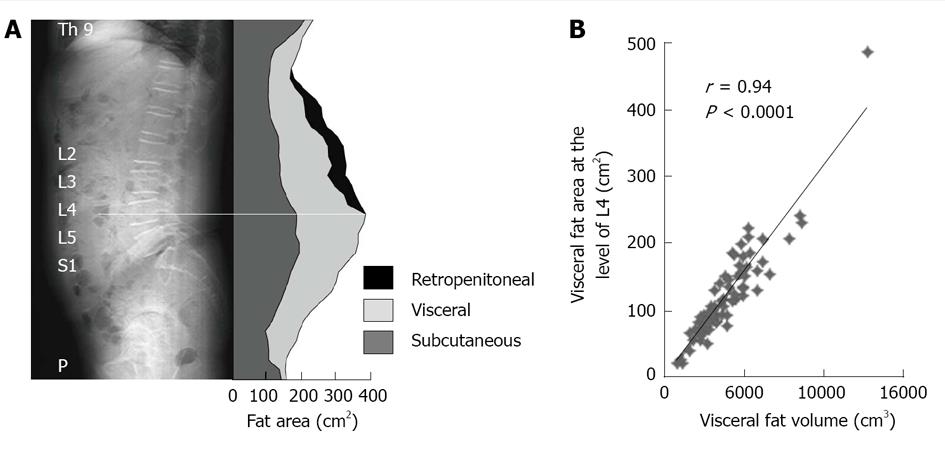
Figure 1 Correlation between visceral fat volume and visceral fat area measured by multislice computed tomography.
A: Abdominal fat distribution; B; Correlation between abdominal visceral fat volume and visceral fat area from a single slice at the level of L4. Number = 75 (males 55, females 20); age: 53 ± 1 yr (range, 18-81 yr), body mass index: 25.4 ± 3.9 kg/cm2 (18.9-38.8 kg/cm2). Slice thickness was 10 mm, and images were obtained from Th 8/9 to the pubis. Fat area measurement application: Advanced area calculation, GE Healthcare Co.
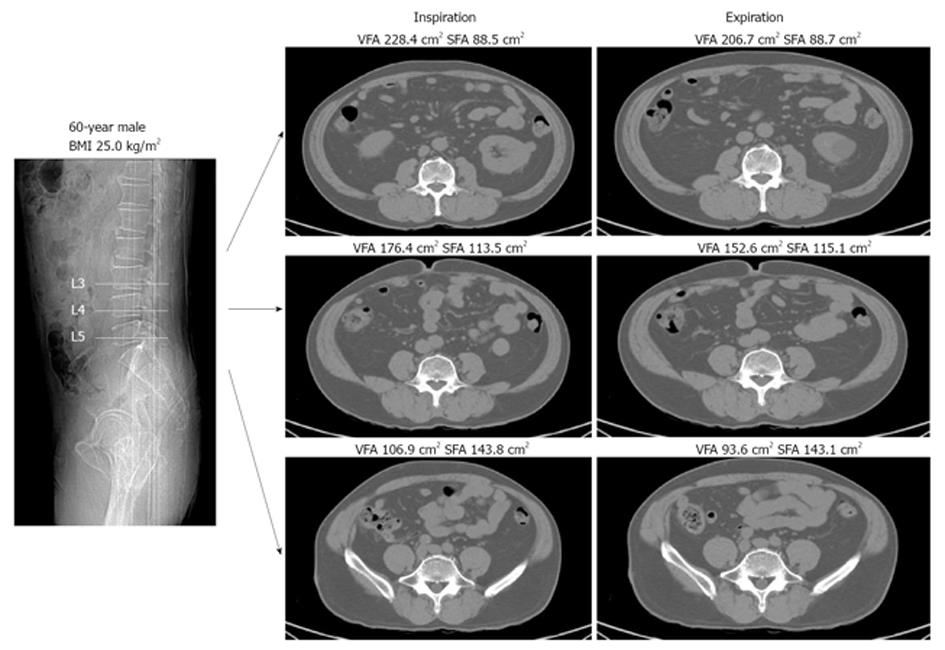
Figure 2 Measurement of visceral fat area varies with respiratory phase and level of computed tomography scan.
Fat area measurement application: Advanced area calculation, GE Healthcare Co. VFA: Visceral fat area; SFA: Subcutaneous fat area; BMI: Body mass index.
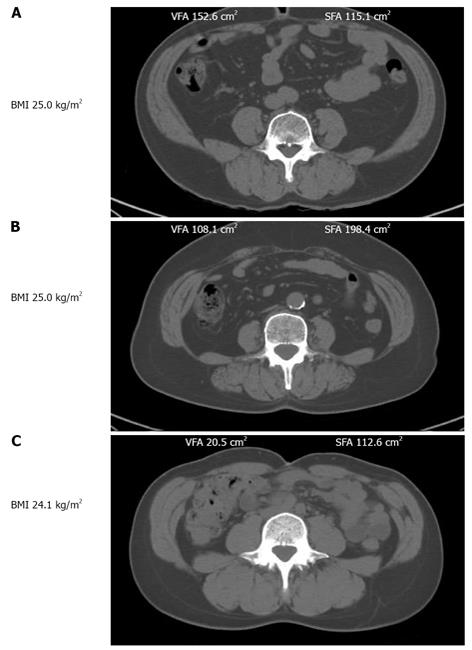
Figure 3 Differences in fat distribution based on sex and age.
CT scans of the abdomen in three representative subjects. A: A 60-year-old male; B: A 60-year-old female; C: A 40-year-old female. Fat area measurement application: Advanced area calculation, GE Healthcare Co. CT: Computed tomography; BMI: Body mass index.
- Citation: Ryo M, Kishida K, Nakamura T, Yoshizumi T, Funahashi T, Shimomura I. Clinical significance of visceral adiposity assessed by computed tomography: A Japanese perspective. World J Radiol 2014; 6(7): 409-416
- URL: https://www.wjgnet.com/1949-8470/full/v6/i7/409.htm
- DOI: https://dx.doi.org/10.4329/wjr.v6.i7.409


