Copyright
©2013 Baishideng Publishing Group Co.
World J Radiol. Aug 28, 2013; 5(8): 313-320
Published online Aug 28, 2013. doi: 10.4329/wjr.v5.i8.313
Published online Aug 28, 2013. doi: 10.4329/wjr.v5.i8.313
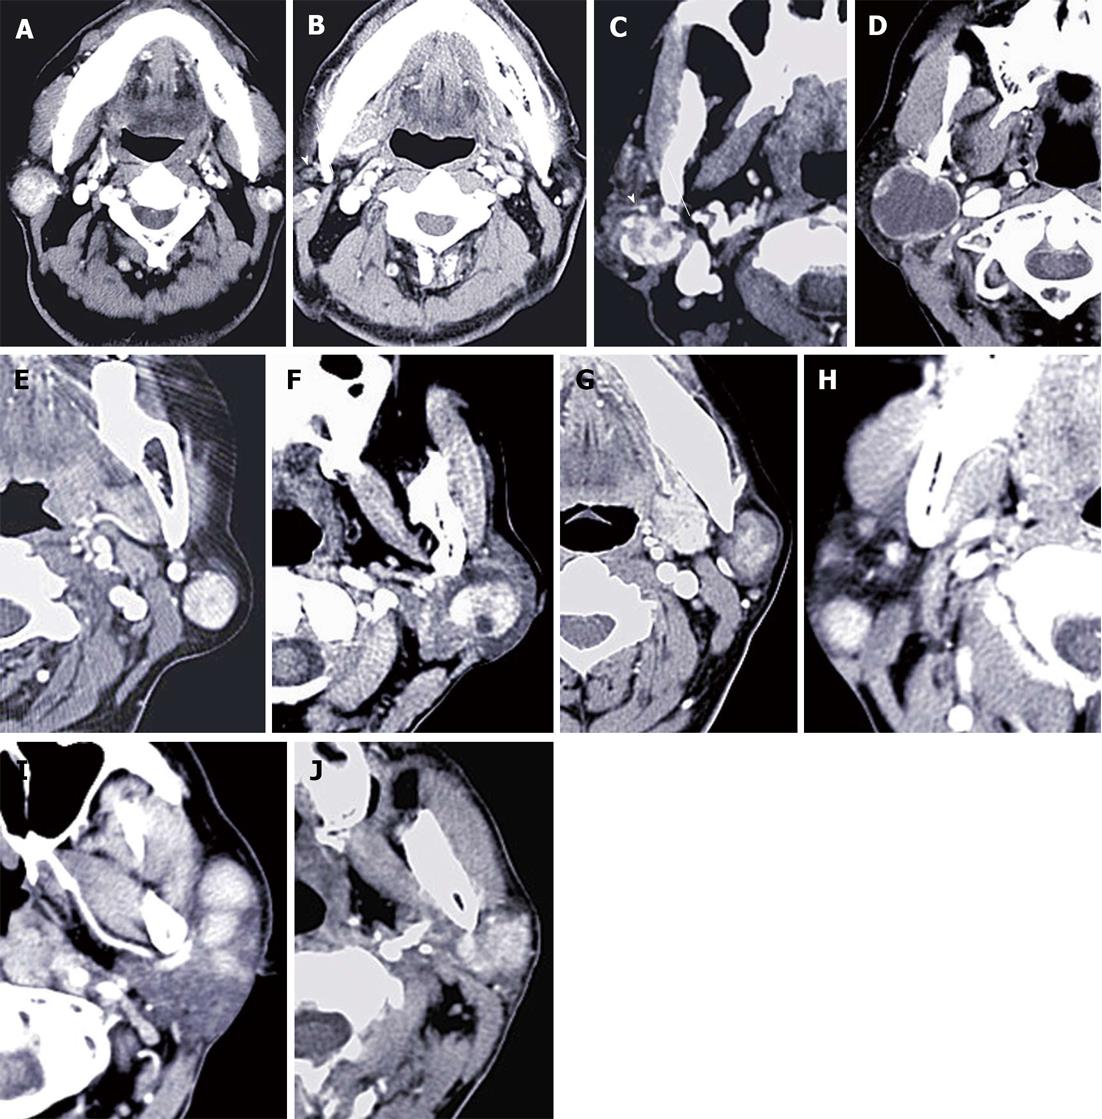
Figure 1 Computed tomography features of all observed subtypes of parotid gland tumors.
A-D: Warthin’s tumors (War-Ts) showing heterogeneous and apparent enhancement; A, B: bilateral multiple lesions with and enlarged lymph nodes; C: Tumors with multiple capsules and vessel facing sign; D: War-T had a large cystic degeneration; E, F: Basal cell adenoma showing apparent heterogeneous enhancement, with multiple low-density areas (E) and multiple capsules (F); G: Pleomorphic adenoma with apparent heterogeneous enhancement at 60 s; H, I: EG presenting unilateral multiple lesions with enlarged lymph nodes, well margin and homogenous enhancement; J: Parotid carcinoma displayed unclear margin and heterogeneous enhancement and involved the superficial and deep lobe.
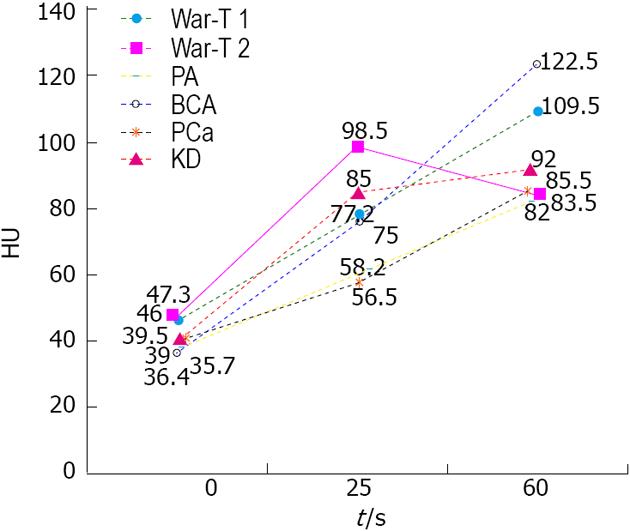
Figure 2 Time and computed tomography number curve of dual-phase contrast enhanced spiral computed tomography in the observed entities.
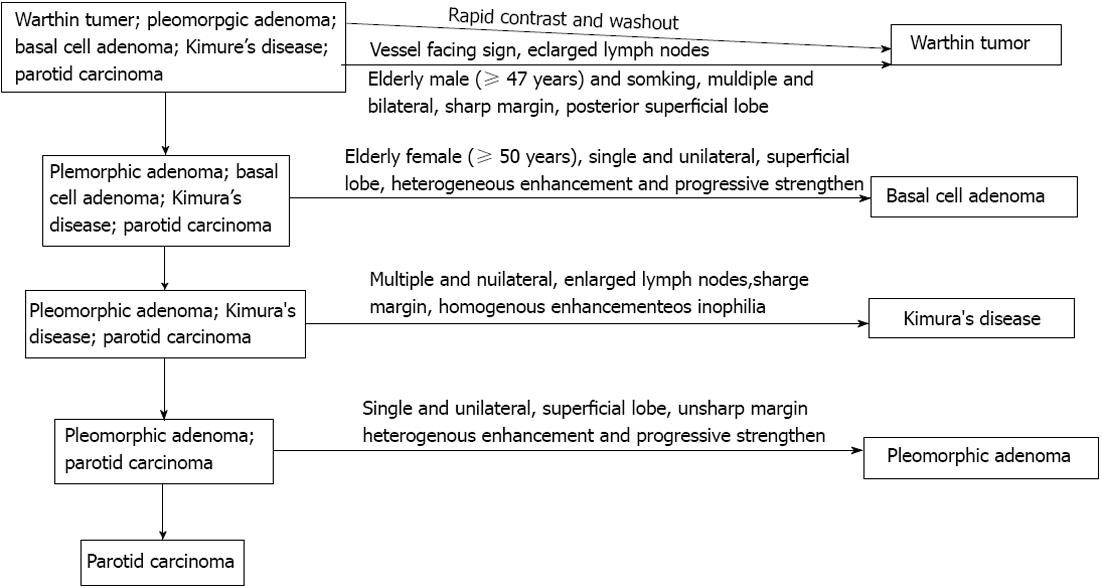
Figure 3 Diagnostic strategy of parotid gland tumors.
War-T: Warthin’s tumor; PA: Pleomorphic adenoma; BCA: basal cell adenoma; PCa: Parotid carcinoma; KD: Kimura’s disease; HU: Unenhanced-attenuation.
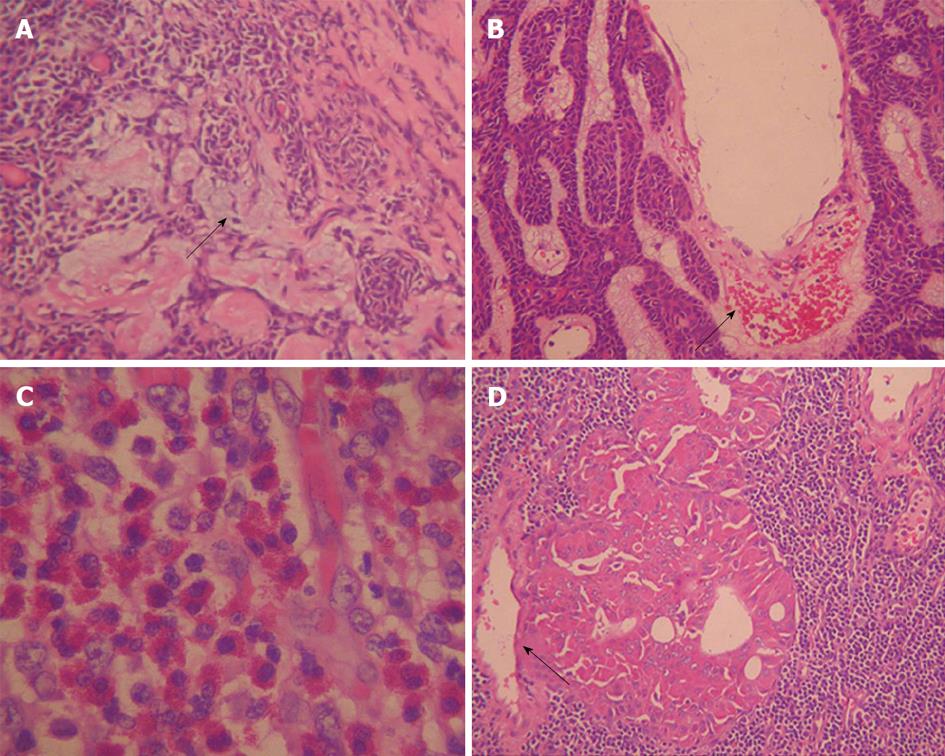
Figure 4 Histopathological features of pleomorphic adenoma, basal cell adenoma, Kimura’s disease and Warthin’s tumor (HE staining, x 400).
A: Pleomorphic adenoma are a large amount of myxoid matrix (arrow), rare epithelial components, and low micro vessel count; B, D: Basal cell adenoma and Warthin’s tumor (War-T) respectively, small capillaries and venules are prominent (black arrow). War-T consists of abundant lymphoid interstitial tissue and gland tube sample structures; C: Kimura’s disease demonstrates a lot of eosinophil invasion.
- Citation: Xu ZF, Yong F, Yu T, Chen YY, Gao Q, Zhou T, Pan AZ, Wu RH. Different histological subtypes of parotid gland tumors: CT findings and diagnostic strategy. World J Radiol 2013; 5(8): 313-320
- URL: https://www.wjgnet.com/1949-8470/full/v5/i8/313.htm
- DOI: https://dx.doi.org/10.4329/wjr.v5.i8.313


