Copyright
©2013 Baishideng Publishing Group Co.
World J Radiol. Apr 28, 2013; 5(4): 178-183
Published online Apr 28, 2013. doi: 10.4329/wjr.v5.i4.178
Published online Apr 28, 2013. doi: 10.4329/wjr.v5.i4.178
Figure 1 Gray scale ultrasound, color Doppler, Doppler spectral analysis in patients with Graves’ disease.
A: Gray scale ultrasound of the right lobe of the thyroid gland in patients with Graves’ disease shows enlarged gland with smooth contour and heterogeneous echotexture; B: Color Doppler of the same patient shows diffuse increase vascularity of the thyroid gland; C: Doppler spectral analysis of the right inferior thyroid artery of the same patients show elevated peak systolic velocity (V1 = 89.8 cm/s) and elevated end diastolic velocity (V2 = 44.9 cm/s). CCA: Common carotid artery; IJV: Internal jugular vein; IJV: Internal jugular vein.
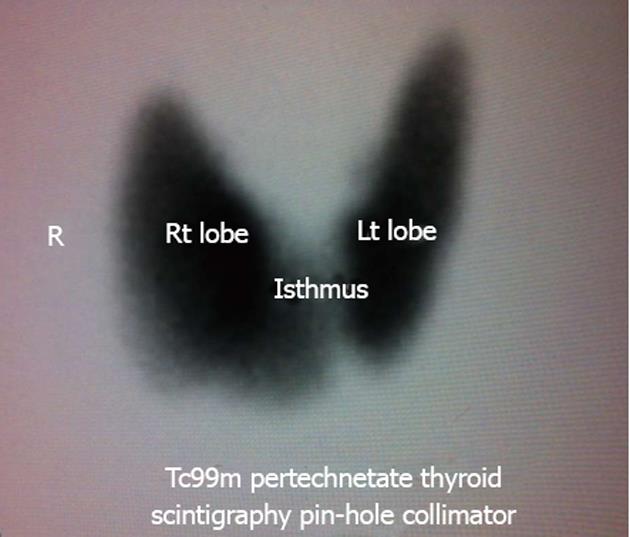
Figure 2 Thyroid scintigraphy of the same patient showed enlarged both lobes of the thyroid with diffuse increase uptake.
R: Right; Tc99m: Technetium TC 99M pyrophosphate.
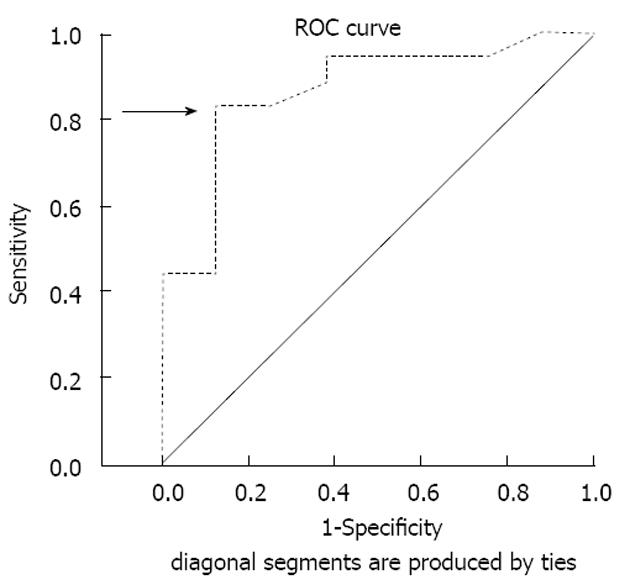
Figure 3 Receiver operating characteristic analysis of the results determined that 40 cm/s is the appropriate cut-off value of peak systolic velocity to differentiate Graves’ disease from thyroiditis.
ROC: Receiver operating characteristic.
- Citation: Donkol RH, Nada AM, Boughattas S. Role of color Doppler in differentiation of Graves' disease and thyroiditis in thyrotoxicosis. World J Radiol 2013; 5(4): 178-183
- URL: https://www.wjgnet.com/1949-8470/full/v5/i4/178.htm
- DOI: https://dx.doi.org/10.4329/wjr.v5.i4.178


