Copyright
©2013 Baishideng Publishing Group Co.
World J Radiol. Apr 28, 2013; 5(4): 156-165
Published online Apr 28, 2013. doi: 10.4329/wjr.v5.i4.156
Published online Apr 28, 2013. doi: 10.4329/wjr.v5.i4.156
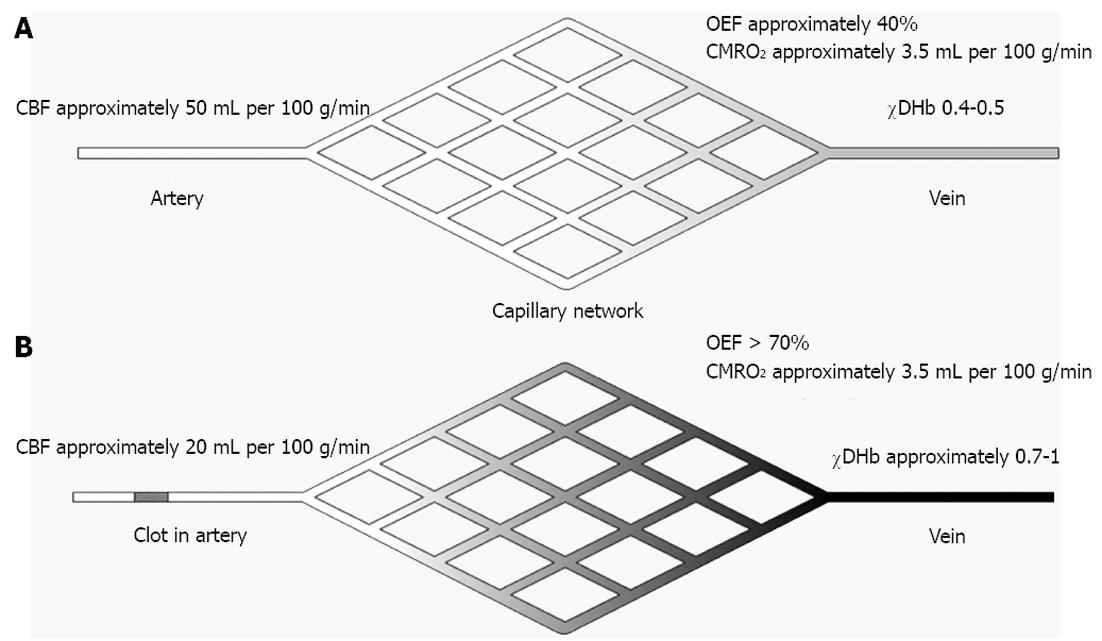
Figure 1 Schematic drawing of brain supplying artery, capillary network and draining vein and the sequence of events leading to an increased visibility of draining veins on T2*w imaging and susceptibility-weighted imaging during acute ischemic stroke.
A: In the normal brain cerebral blood flow (CBF) is approximately 40 mL per 100 g/min to sustain normal brain function. Oxygen extraction fraction (OEF) and cerebral metabolism rate of oxygen (CMRO2) are in the range of approximately 40%-50% and 3.5 mL per 100 g/min respectively. The fraction of deoxyhemoglobin (χDHb) provides the normal appearing venous vessels on T2*w and susceptibility-weighted imaging; B: When the blood supply is interrupted CBF drops to approximately 20 mL per 100 g/min (penumbral threshold) or < 10 mL per 100 g/min (ischemic threshold). In penumbral tissue CMRO2 can be kept stable by an increase of OEF to > 70%. In effect, χDHb rises to its maximum (assuming optimal arterial oxygenation) and draining veins may appear more pronounced and hypointense.
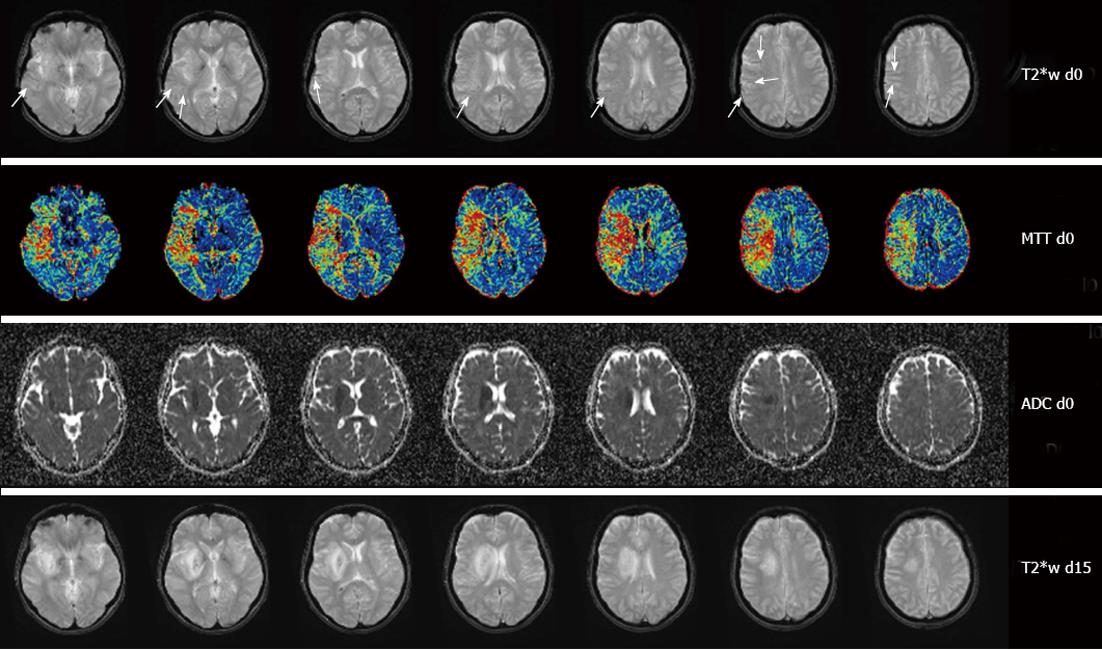
Figure 2 Image montage of magnetic resonance imaging findings in a 46-year-old woman with a right middle cerebral artery occlusion 321 min after symptom onset and an National Institute of Health Stroke Score of 11 on admission.
Note the subtle asymmetrically prominent veins (arrows) on T2*w imaging (first row) within the mean transit time (MTT) lesion (second row) but outside the apparent diffusion coefficient (ADC) lesion (third row) on the day of admission (d0). On follow-up imaging 15 d later (d15) vessel appearance has normalized (fourth row).
- Citation: Jensen-Kondering U, Böhm R. Asymmetrically hypointense veins on T2*w imaging and susceptibility-weighted imaging in ischemic stroke. World J Radiol 2013; 5(4): 156-165
- URL: https://www.wjgnet.com/1949-8470/full/v5/i4/156.htm
- DOI: https://dx.doi.org/10.4329/wjr.v5.i4.156


