Copyright
©2012 Baishideng Publishing Group Co.
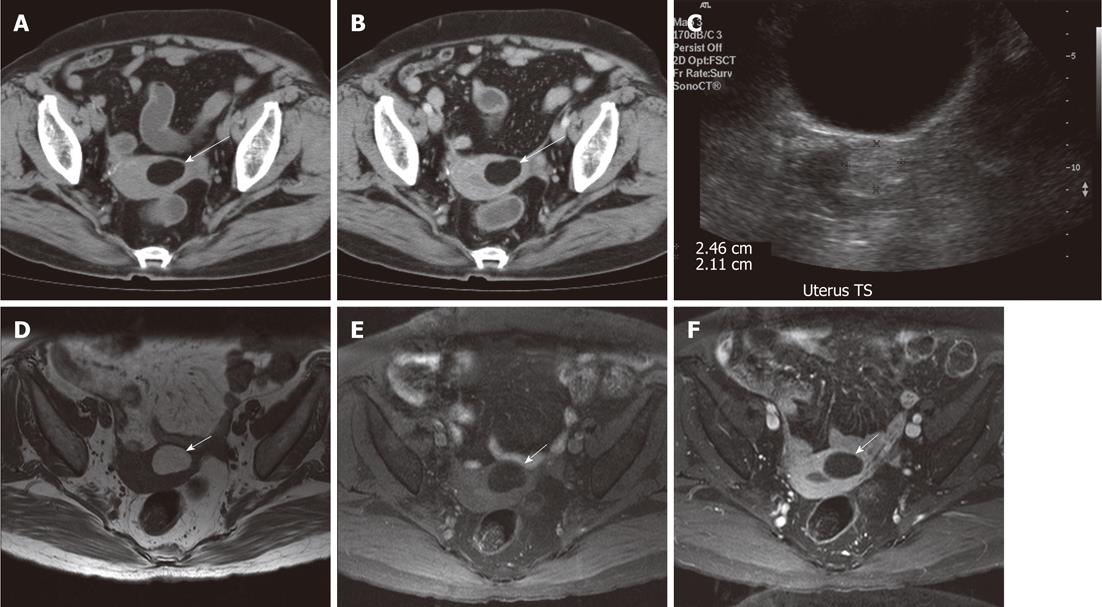
Figure 1 Computed tomography, ultrasound and magnetic resonance images of lipomatous uterine tumor in a 79-year-old woman.
A and B: Computed tomography axial images of the pelvis without contrast (A) and with intravenous contrast (B) show a non-enhancing lesion in left side of the uterine fundus (long arrows); C: The density is similar to that of subcutaneous fat. Ultrasound of pelvis in transverse view shows a hyperechoic lesion (2.46 cm × 2.11 cm) in the uterine fundus; D: T1-weighted axial MRI image shows a homogeneous hyperintense lesion in left side of uterine fundus; E: The lesion shows complete suppression of signal intensity in T1-weighted fat-suppressed sequence, suggestive of fat component; F: No contrast enhancement is seen after intravenous gadolinium is administered. Compression of the uterine cavity is clearly demonstrated. Magnetic resonance imaging (MRI) images of the lesion (short arrows) (D-F).
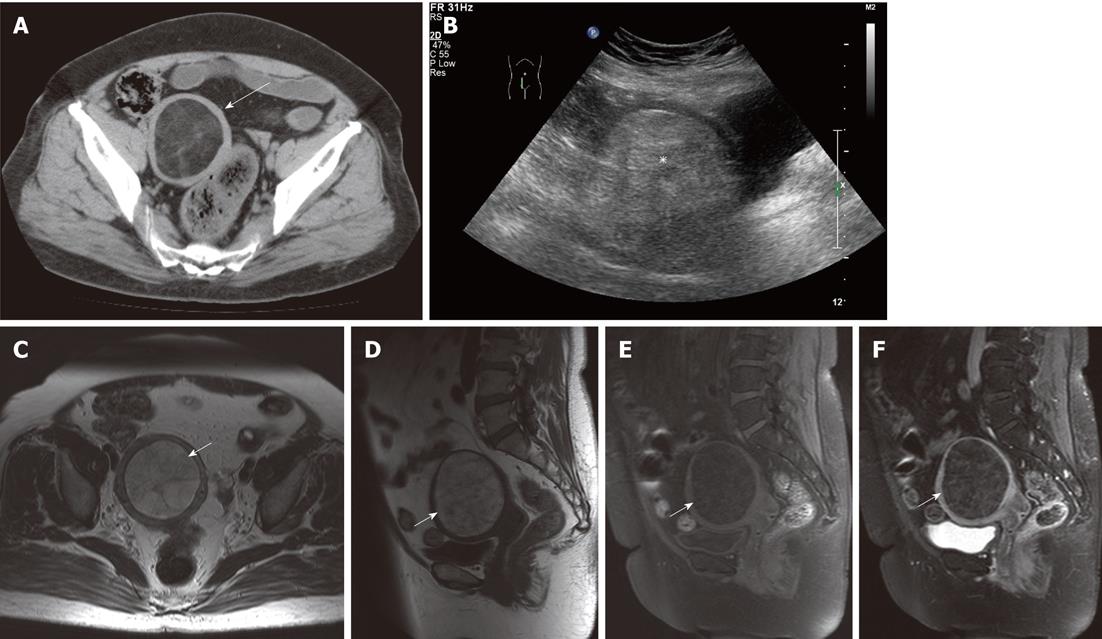
Figure 2 Computed tomography, ultrasound and magnetic resonance images of lipomatous uterine tumor in a 61-year-old woman.
A: Computed tomography axial image of the pelvis with no contrast shows a hypodense lesion in the uterine fundus with thin internal septa (long arrow); B: Ultrasound in longitudinal view reveals a rather homogeneous and hyperechoic lesion (asterisk) in the uterus, just superior to the urinary bladder; C-F: Magnetic resonance imaging (MRI) images of the lesion. T1-weighted MRI images in axial plane (C) and in sagittal plane (D) show a T1 hyperintense lesion in the uterine fundus with thin hypointense septa (short arrows); E: Suppression of signal is seen in the T1-weighted fat-suppressed sequence, suggestive of fatty component of the lesion; F: Thin enhancing septa are seen inside the lesion after gadolinium contrast is administered.
Figure 3 Computed tomography images of uterine lipoma in a 72-year-old woman.
A and B: Axial computed tomography images without contrast (A) and after intravenous contrast (B) show a non-enhancing hypodense lesion (long arrows) in left side of the uterine fundus. Small amount of soft tissue density (short arrows) is noted inside the lesion; C and D: Coronal (C) and Sagittal (D) reformatted images also reveal the relationship of the lesion with the uterus.
- Citation: Chu CY, Tang YK, Chan TSA, Wan YH, Fung KH. Diagnostic challenge of lipomatous uterine tumors in three patients. World J Radiol 2012; 4(2): 58-62
- URL: https://www.wjgnet.com/1949-8470/full/v4/i2/58.htm
- DOI: https://dx.doi.org/10.4329/wjr.v4.i2.58


