Copyright
©2011 Baishideng Publishing Group Co.
World J Radiol. May 28, 2011; 3(5): 125-134
Published online May 28, 2011. doi: 10.4329/wjr.v3.i5.125
Published online May 28, 2011. doi: 10.4329/wjr.v3.i5.125
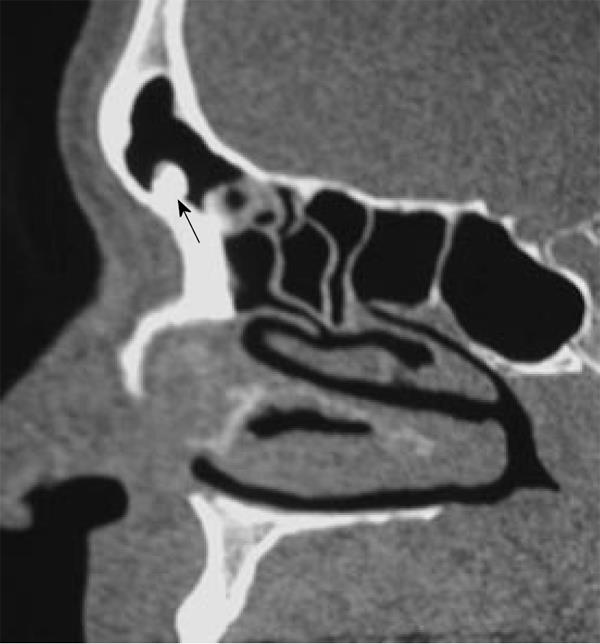
Figure 1 Compact Osteoma.
Axial computed tomography scan of the paranasal sinus shows a pathognomonic dense sclerotic mass (arrow) in the frontal sinus.
Figure 2 Osteoblastoma.
A: Coronal computed tomography shows a nonspecific expansile lesion (arrows) seen in the the right frontoethmoid air cells with extension into the right orbit. It shows ossific foci; B: Coronal T2-weighted image shows a well-defined mass (arrows) in the right ethmoid air cells with extension into the right orbit. It shows nonspecific intermediate to low signal intensity with signal void regions of calcifications and areas of high signal intensity; C: Axial contrast T1-weighted image shows inhomogeneous patterns of enhancement of the lesion (arrows).
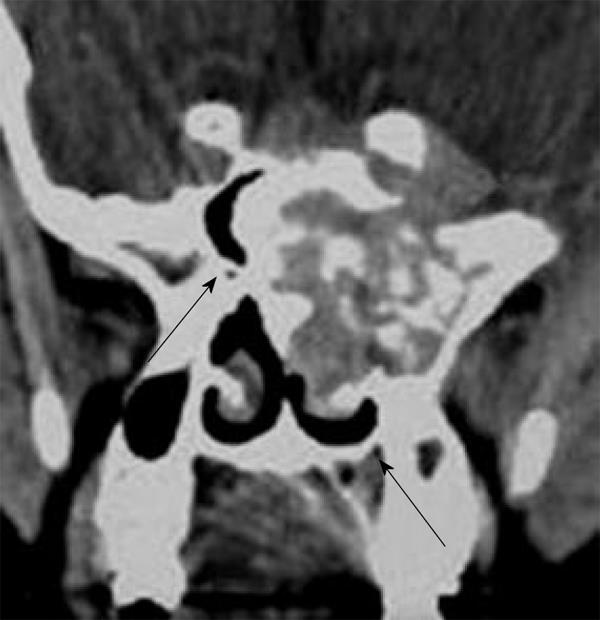
Figure 3 Chondromyxoid fibroma.
Coronal computed tomography shows expanded mass in the sphenoid sinus with pathognomonic discrete areas of calcification (arrows).
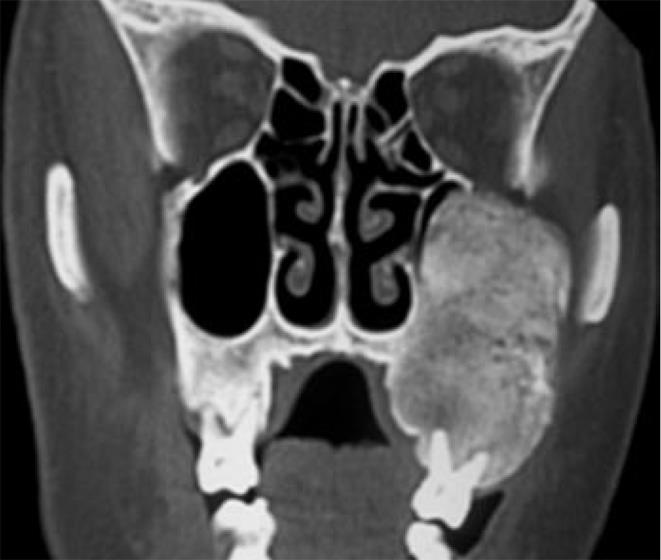
Figure 4 Fibrous dysplasia.
Coronal computed tomography scan shows a well-defined expansile bony lesion involving the left maxilla with characteristic ground glass appearance.
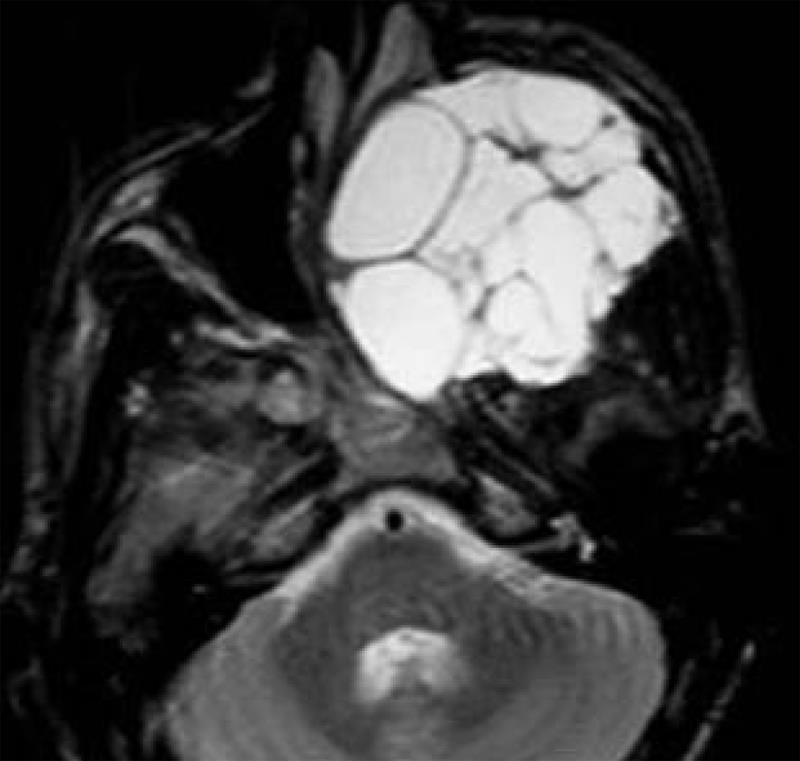
Figure 5 Aneurysmal bone cyst.
Axial T2-weighted image shows an expans
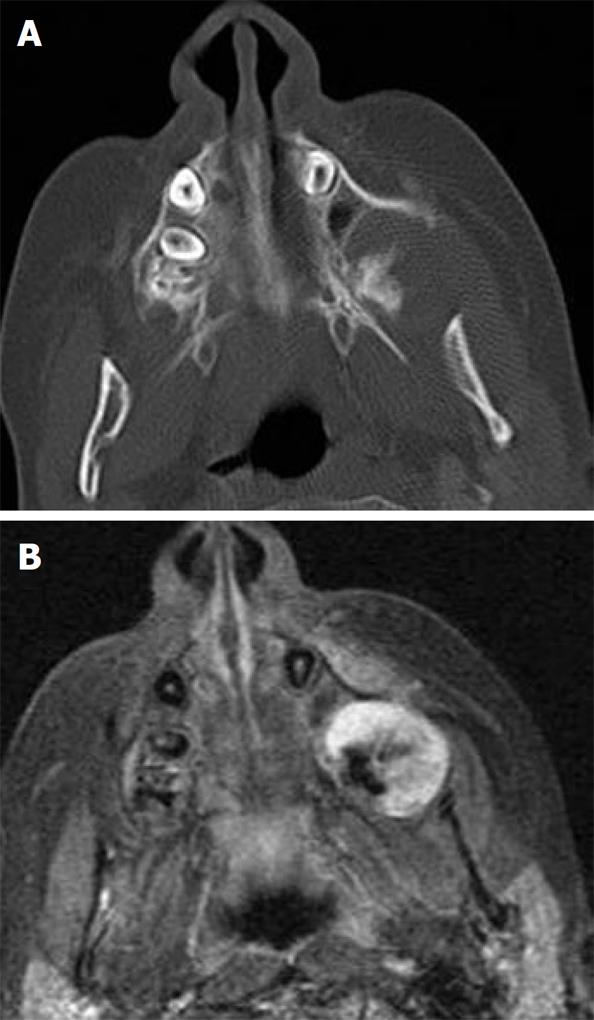
Figure 6 Osteosarcoma.
A: Axial computed tomography shows a rather irregular characteristic spiculated mass in the left alveolar margin of the maxilla adjacent to the lateral pterygoid plate; B: Axial contrast T1-weighted image shows inhomogeneous enhancement of the mass with non-enhanced signal void regions of calcification (Courtesy of Castillo M).
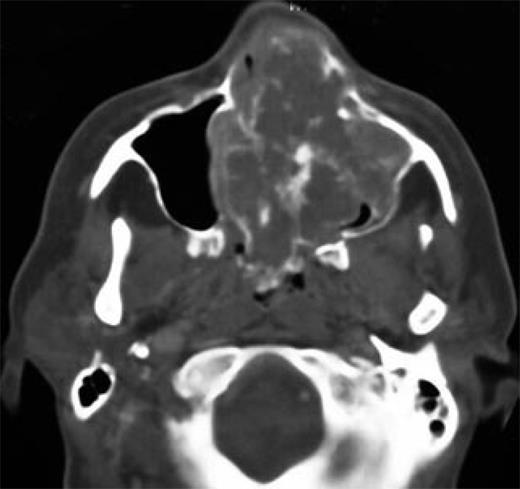
Figure 7 Chondrosarcoma.
Axial computed tomography shows bulky mass in the nasal cavity and left maxillary sinus with characteristic stippled and amorphous areas of calcification (arrows).
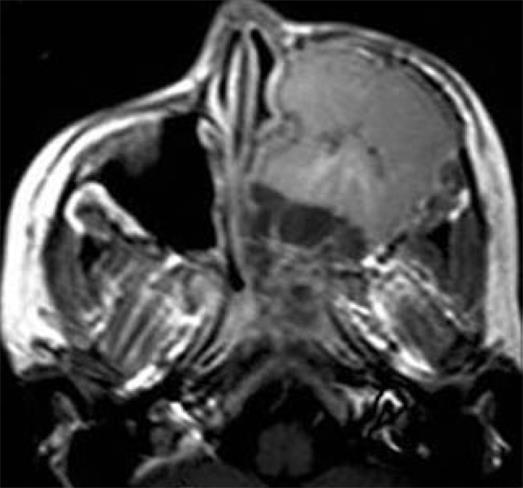
Figure 8 Ewing Sarcoma.
Axial contrast T1-weighted image shows a large destructive mass occupying the entire left maxillary sinus. The mass shows inhomogeneous non-specific pattern of contrast enhancement.
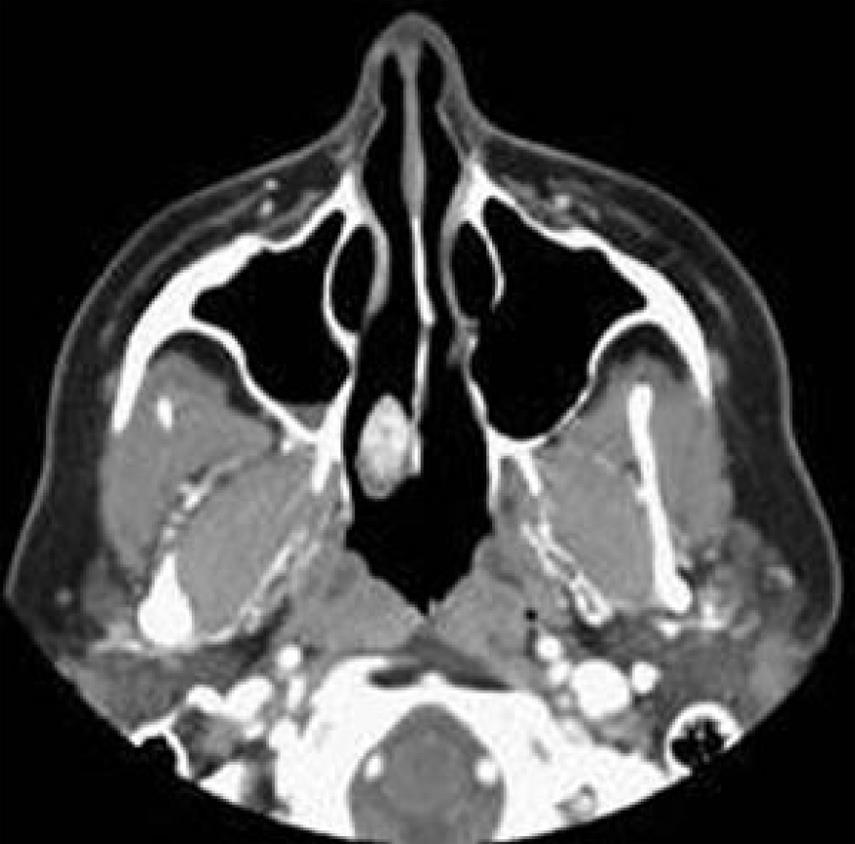
Figure 9 Hemangioendothelioma.
Axial computed tomography shows a non-specific sclerotic enhanced lesion related to the posterior part of the nasal septum on the right side (Courtesy of Castillo M).
- Citation: Razek AAKA. Imaging appearance of bone tumors of the maxillofacial region. World J Radiol 2011; 3(5): 125-134
- URL: https://www.wjgnet.com/1949-8470/full/v3/i5/125.htm
- DOI: https://dx.doi.org/10.4329/wjr.v3.i5.125


