Copyright
©2011 Baishideng Publishing Group Co.
World J Radiol. Nov 28, 2011; 3(11): 266-272
Published online Nov 28, 2011. doi: 10.4329/wjr.v3.i11.266
Published online Nov 28, 2011. doi: 10.4329/wjr.v3.i11.266
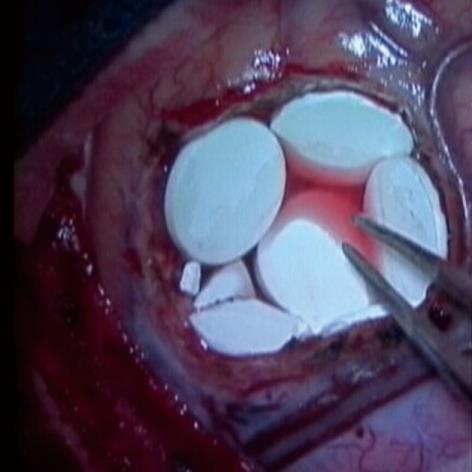
Figure 1 Intracavitary Gliadel wafer placement.
This image, taken at time of Gliadel wafer placement in the operating room, demonstrates the lining of wafers (white round structures) along the wall of the resection cavity site.
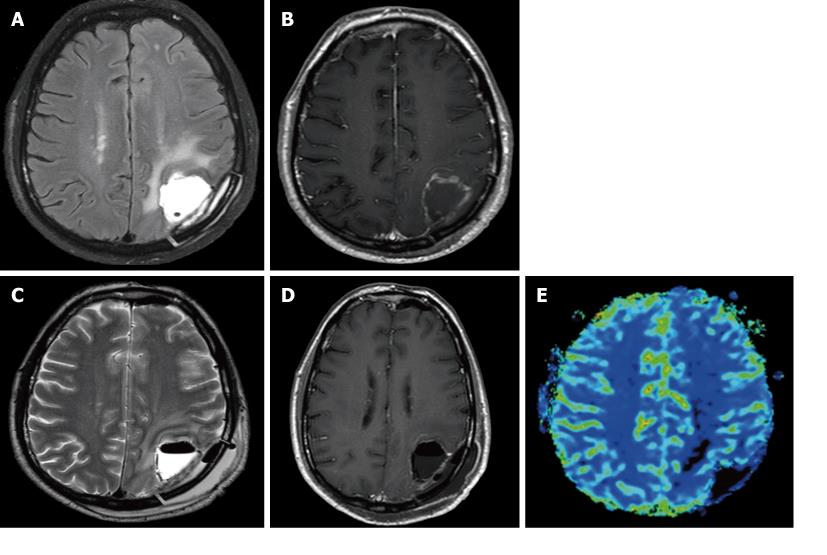
Figure 2 Magnetic resonance imaging appearance in a 54-year-old male patient without tumor progression (Patient 1).
A: Post-operative day 7, (A) T2 weighted image (T2WI) (TR, 3000 ms; TE, 80 ms) and (B) post-contrast T1 weighted image (T1WI) (TR, 509 ms; TE, 14 ms) demonstrate increase in T2 hyperintensity and enhancement, respectively, surrounding the resection cavity site compared to the baseline post-operative images (not shown); C, D: Post-operative day 20, (C) T2WI (TR, 3000 ms; TE, 80 ms) and (D) T1WI (TR, 509 ms; TE, 14 ms) demonstrate a decrease in T2 hyperintensity and enhancement, respectively, surrounding the resection cavity site; E: MR perfusion [relative cerebral blood volume (rCBV) maps] do not show any increase in rCBV confirming previous that findings were due to post-treatment changes (pseudoprogression) rather than recurrence.
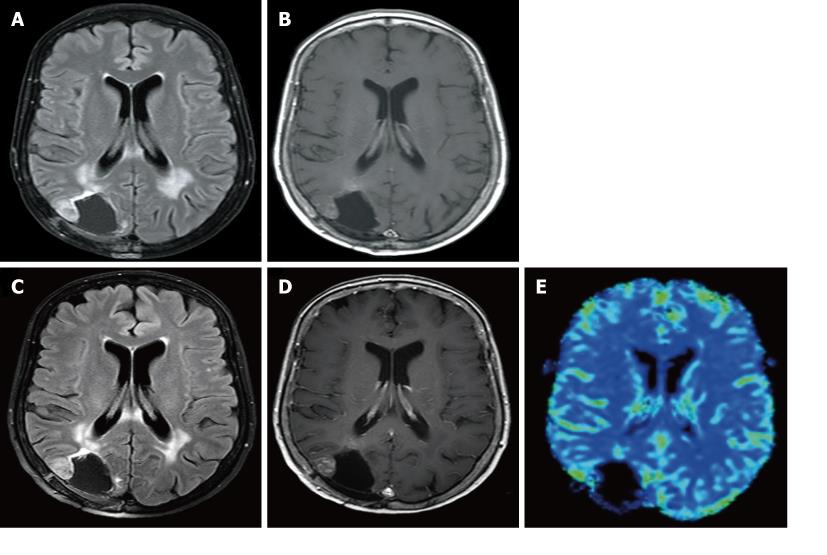
Figure 3 MR appearance in a 59-year-old male patient with tumor progression (Patient 2).
A: One month post-operative, (A) FLAIR (TR, 11,000 ms; TE, 140 ms; TI, 2600 ms) and (B) T1 weighted image (T1WI) (TR,509 ms; TE, 14 ms) demonstrate an increase in FLAIR hyperintensity and enhancement, respectively, surrounding the resection cavity site. Five months post-operative; C, D: (C) FLAIR (TR, 11,000 ms; TE, 140 ms; TI, 2600 ms) and (D) T1WI (TR,509 ms; TE, 14 ms) demonstrate a further increase in FLAIR hyperintensity and enhancement, respectively, surrounding the resection cavity site; E: MR perfusion (rCBV maps) demonstrates increased rCBV in the right posterolateral, anterior and medial aspects (arrows) of the resection cavity site confirming true tumor recurrence rather than post-treatment changes.
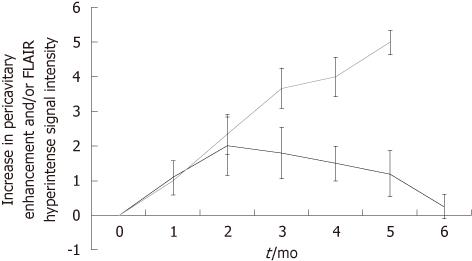
Figure 4 Graphic illustration.
Post-treatment changes and time course. This diagram illustrates a progressive increase in pericavitary enhancement and FLAIR hyperintensity that occurs within the first 2 mo of Gliadel wafer deposition. At the 2 mo mark, all patients (5/8) without recurrence demonstrated a steady decline in post-treatment changes on their magnetic resonance imaging (MRI) relative to the immediate prior examination (dark gray-black line). All (3/8) patients who had recurrence demonstrated a continued increase in enhancement and FLAIR hyperintensity relative to their immediate prior MRI study (light gray line).
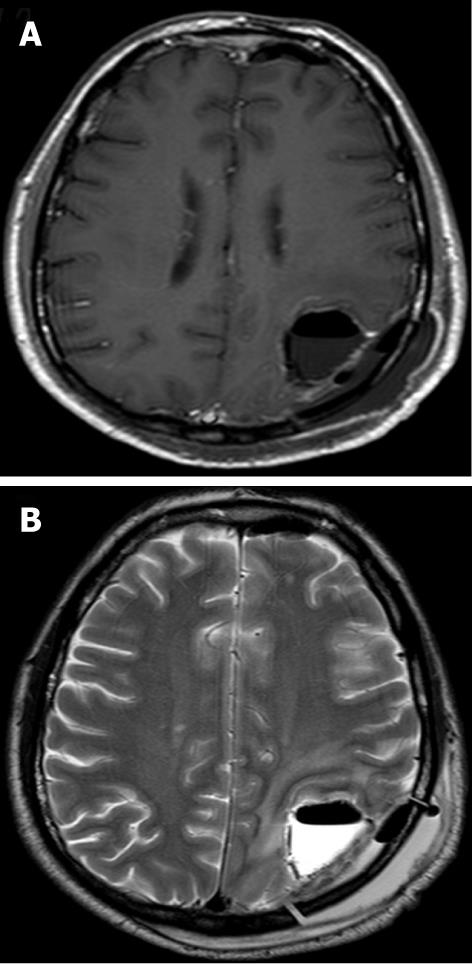
Figure 5 Appearance of Gliadel wafers in the acute phase.
A: Axial post-contrast T1 weighted image (TR, 509 ms; TE, 14 ms) demonstrates non-enhancing T1 hypointense linear structures (arrows) reflecting the Gliadel wafers in the resection cavity site. Post-treatment changes are also seen; B: Axial T2-weighted image (TR, 3000 ms; TE, 80 ms) demonstrates the wafers (arrows) to also be hypointense on T2 and are well seen within the T2 hyperintense fluid-filled resection cavity.
Figure 6 Appearance of Gliadel wafers in the subacute phase.
A, B: (A) Axial pre-contrast and (B) post-contrast T1-weighted image (TR, 509 ms; TE, 14 ms) demonstrate non-enhancing T1 hyperintense linear structures (arrows) reflecting the Gliadel wafers in the resection cavity site. Involuting post-treatment changes are also seen; C: Axial T2-weighted image (TR, 3000 ms; TE, 80 ms) demonstrates the wafers (arrows) to remain T2 hypointense. A small susceptibility artifact is seen in the anterior margin of the resection cavity site.
- Citation: Colen RR, Zinn PO, Hazany S, Do-Dai D, Wu JK, Yao K, Zhu JJ. Magnetic resonance imaging appearance and changes on intracavitary Gliadel wafer placement: A pilot study. World J Radiol 2011; 3(11): 266-272
- URL: https://www.wjgnet.com/1949-8470/full/v3/i11/266.htm
- DOI: https://dx.doi.org/10.4329/wjr.v3.i11.266


