Copyright
©2010 Baishideng Publishing Group Co.
World J Radiol. Aug 28, 2010; 2(8): 329-333
Published online Aug 28, 2010. doi: 10.4329/wjr.v2.i8.329
Published online Aug 28, 2010. doi: 10.4329/wjr.v2.i8.329
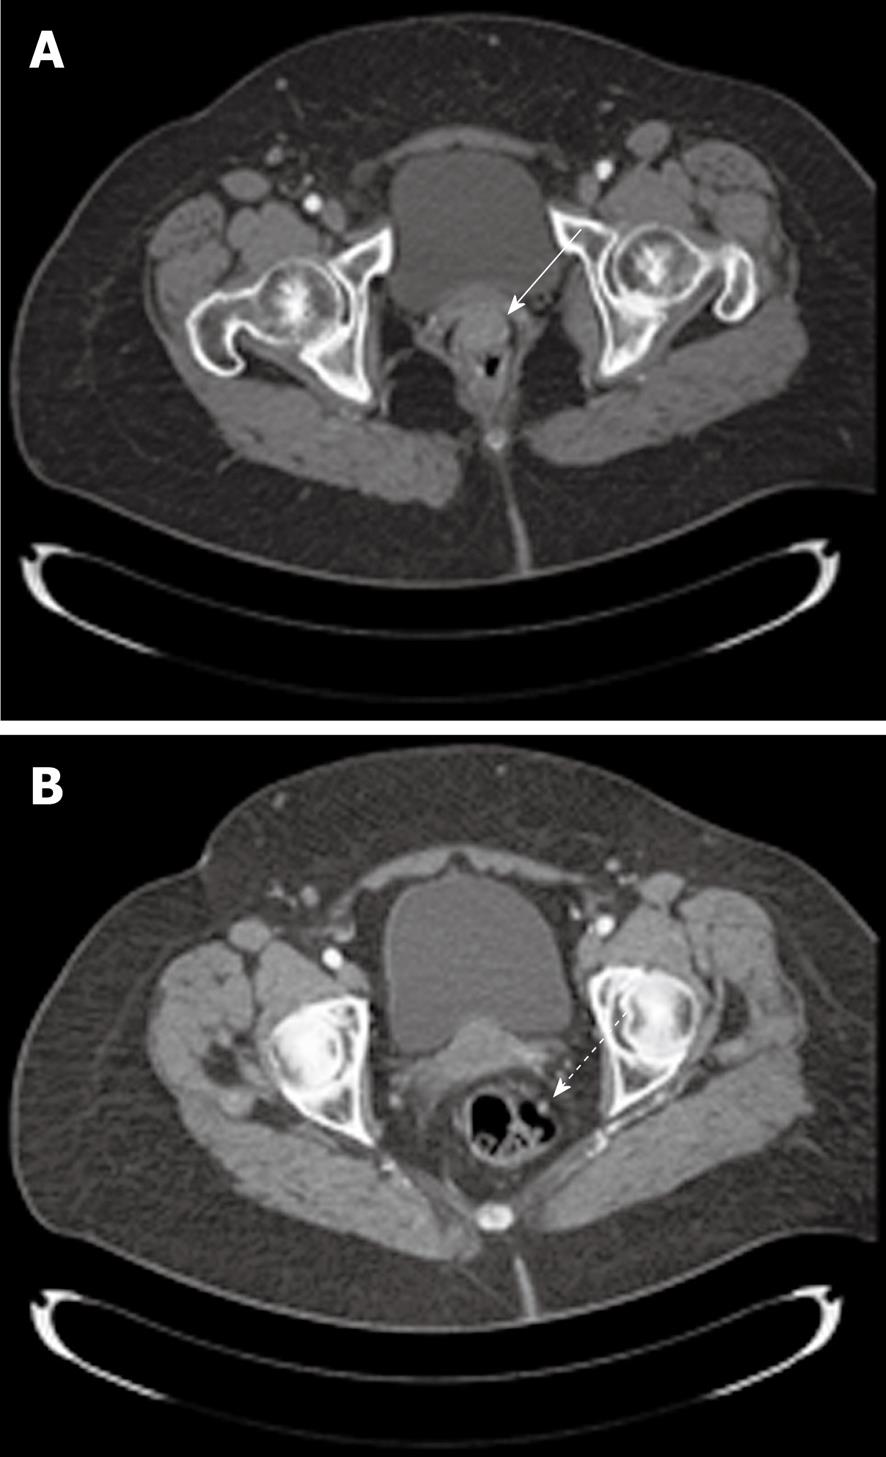
Figure 1 Pre-treatment computed tomography scans.
A: The tumour mass (white arrow) occupying the anterior rectal wall; B: A small, possibly involved node on the left rectal wall (white dashed arrow).
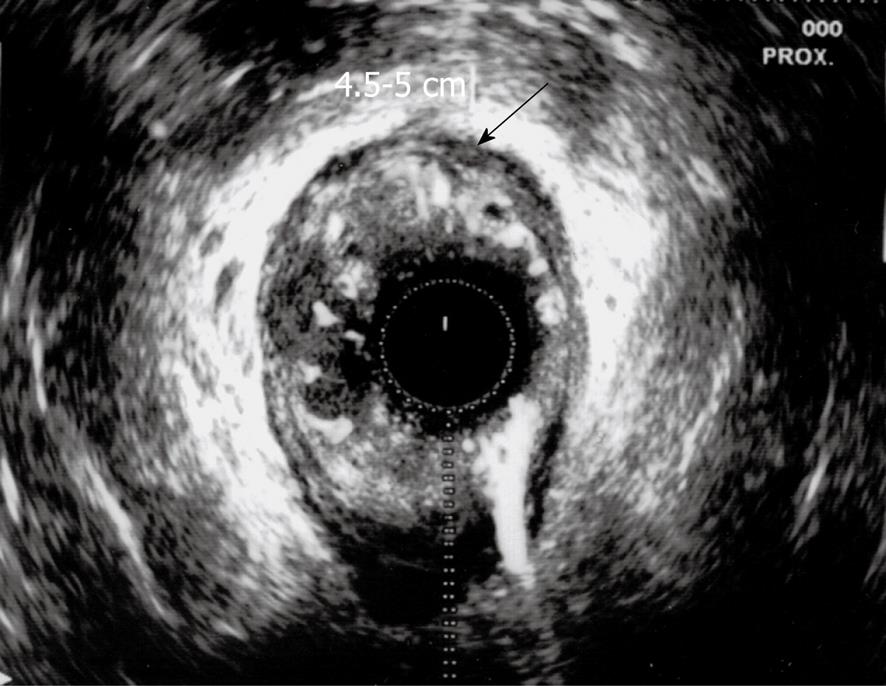
Figure 2 Pre-treatment endorectal ultrasound scan showing the inferior aspect of the mass located 4.
5-5 cm from the anal margin (black arrow).
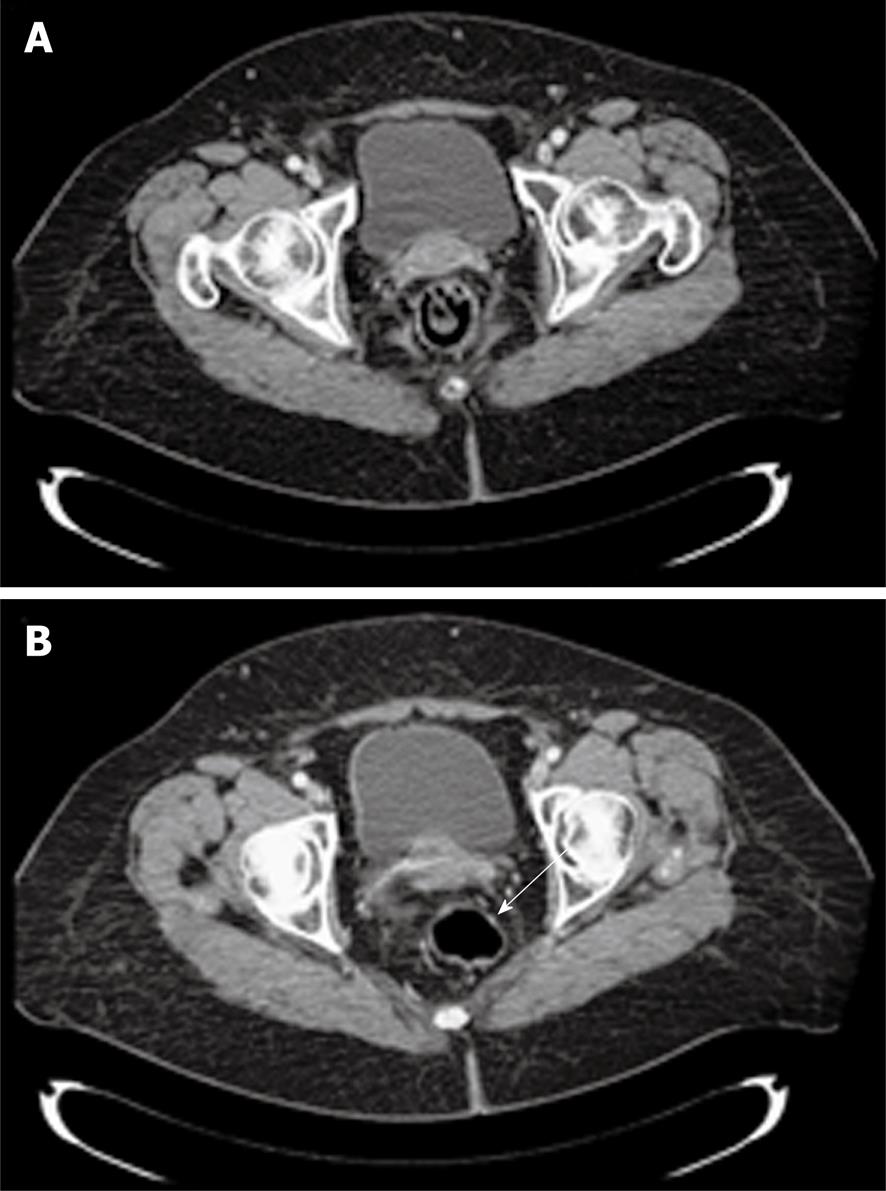
Figure 3 Computed tomography scan performed after chemoradiation treatment.
A: The anterior rectal wall appeared free of disease; B: The previously detected node appeared greatly reduced in size (white arrow).
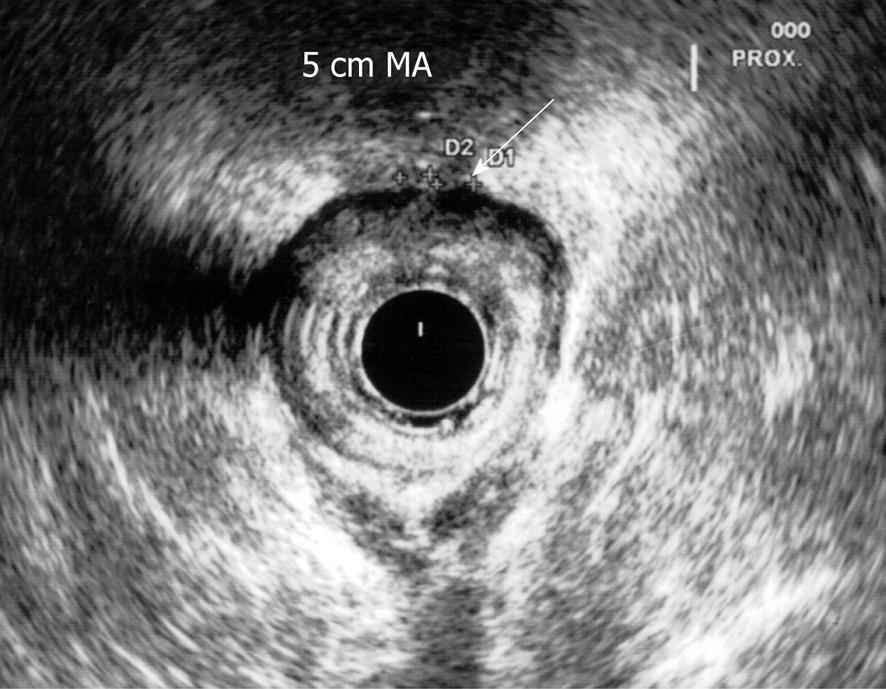
Figure 4 Endorectal ultrasound performed 12 wk after the end of chemoradiation.
The tumour mass appeared reduced in size and hard to identify (white arrow). MA: Margin from anal verge.
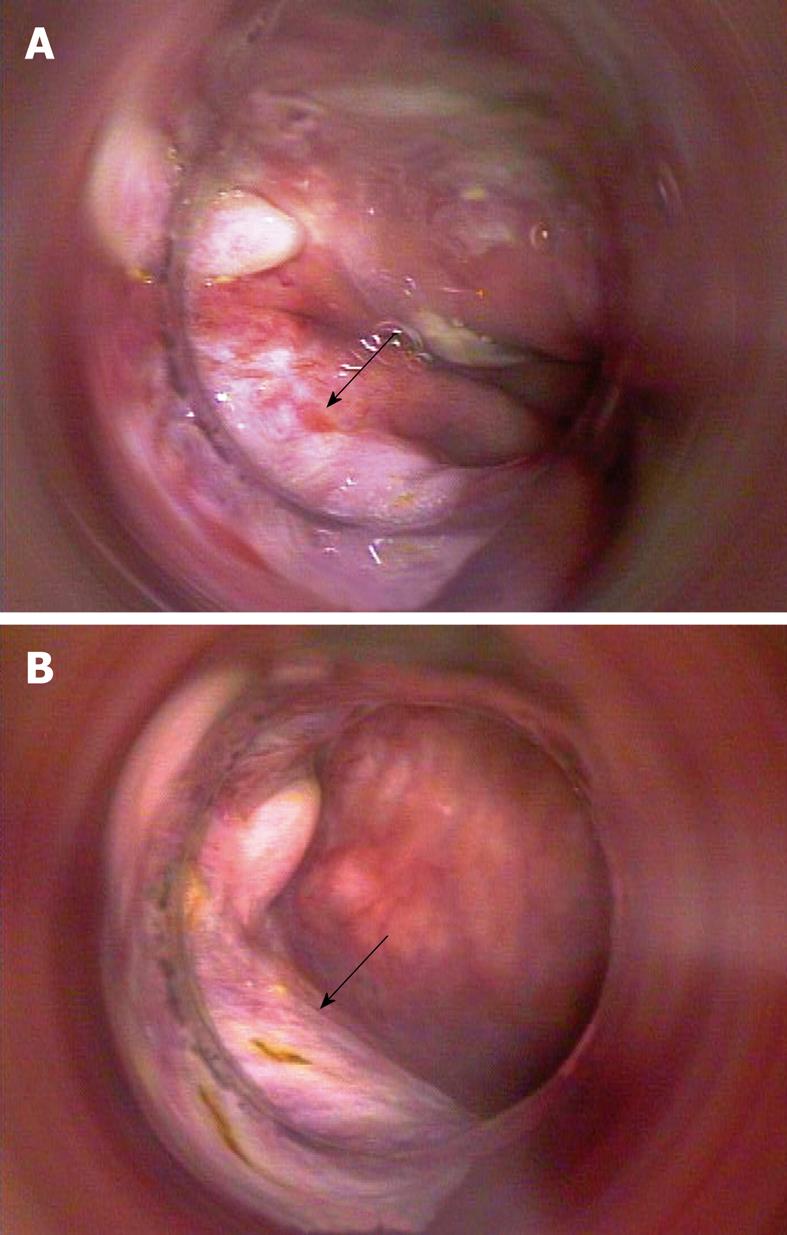
Figure 5 Images of proctoscopy (A, B) conducted 4 mo after the end of chemoradiation, which revealed the presence of a plain white scar at the site of previous disease (black arrows).
- Citation: Iannacone E, Dionisi F, Musio D, Caiazzo R, Raffetto N, Banelli E. Chemoradiation as definitive treatment for primary squamous cell cancer of the rectum. World J Radiol 2010; 2(8): 329-333
- URL: https://www.wjgnet.com/1949-8470/full/v2/i8/329.htm
- DOI: https://dx.doi.org/10.4329/wjr.v2.i8.329


