Copyright
©The Author(s) 2025.
World J Radiol. Jun 28, 2025; 17(6): 107281
Published online Jun 28, 2025. doi: 10.4329/wjr.v17.i6.107281
Published online Jun 28, 2025. doi: 10.4329/wjr.v17.i6.107281
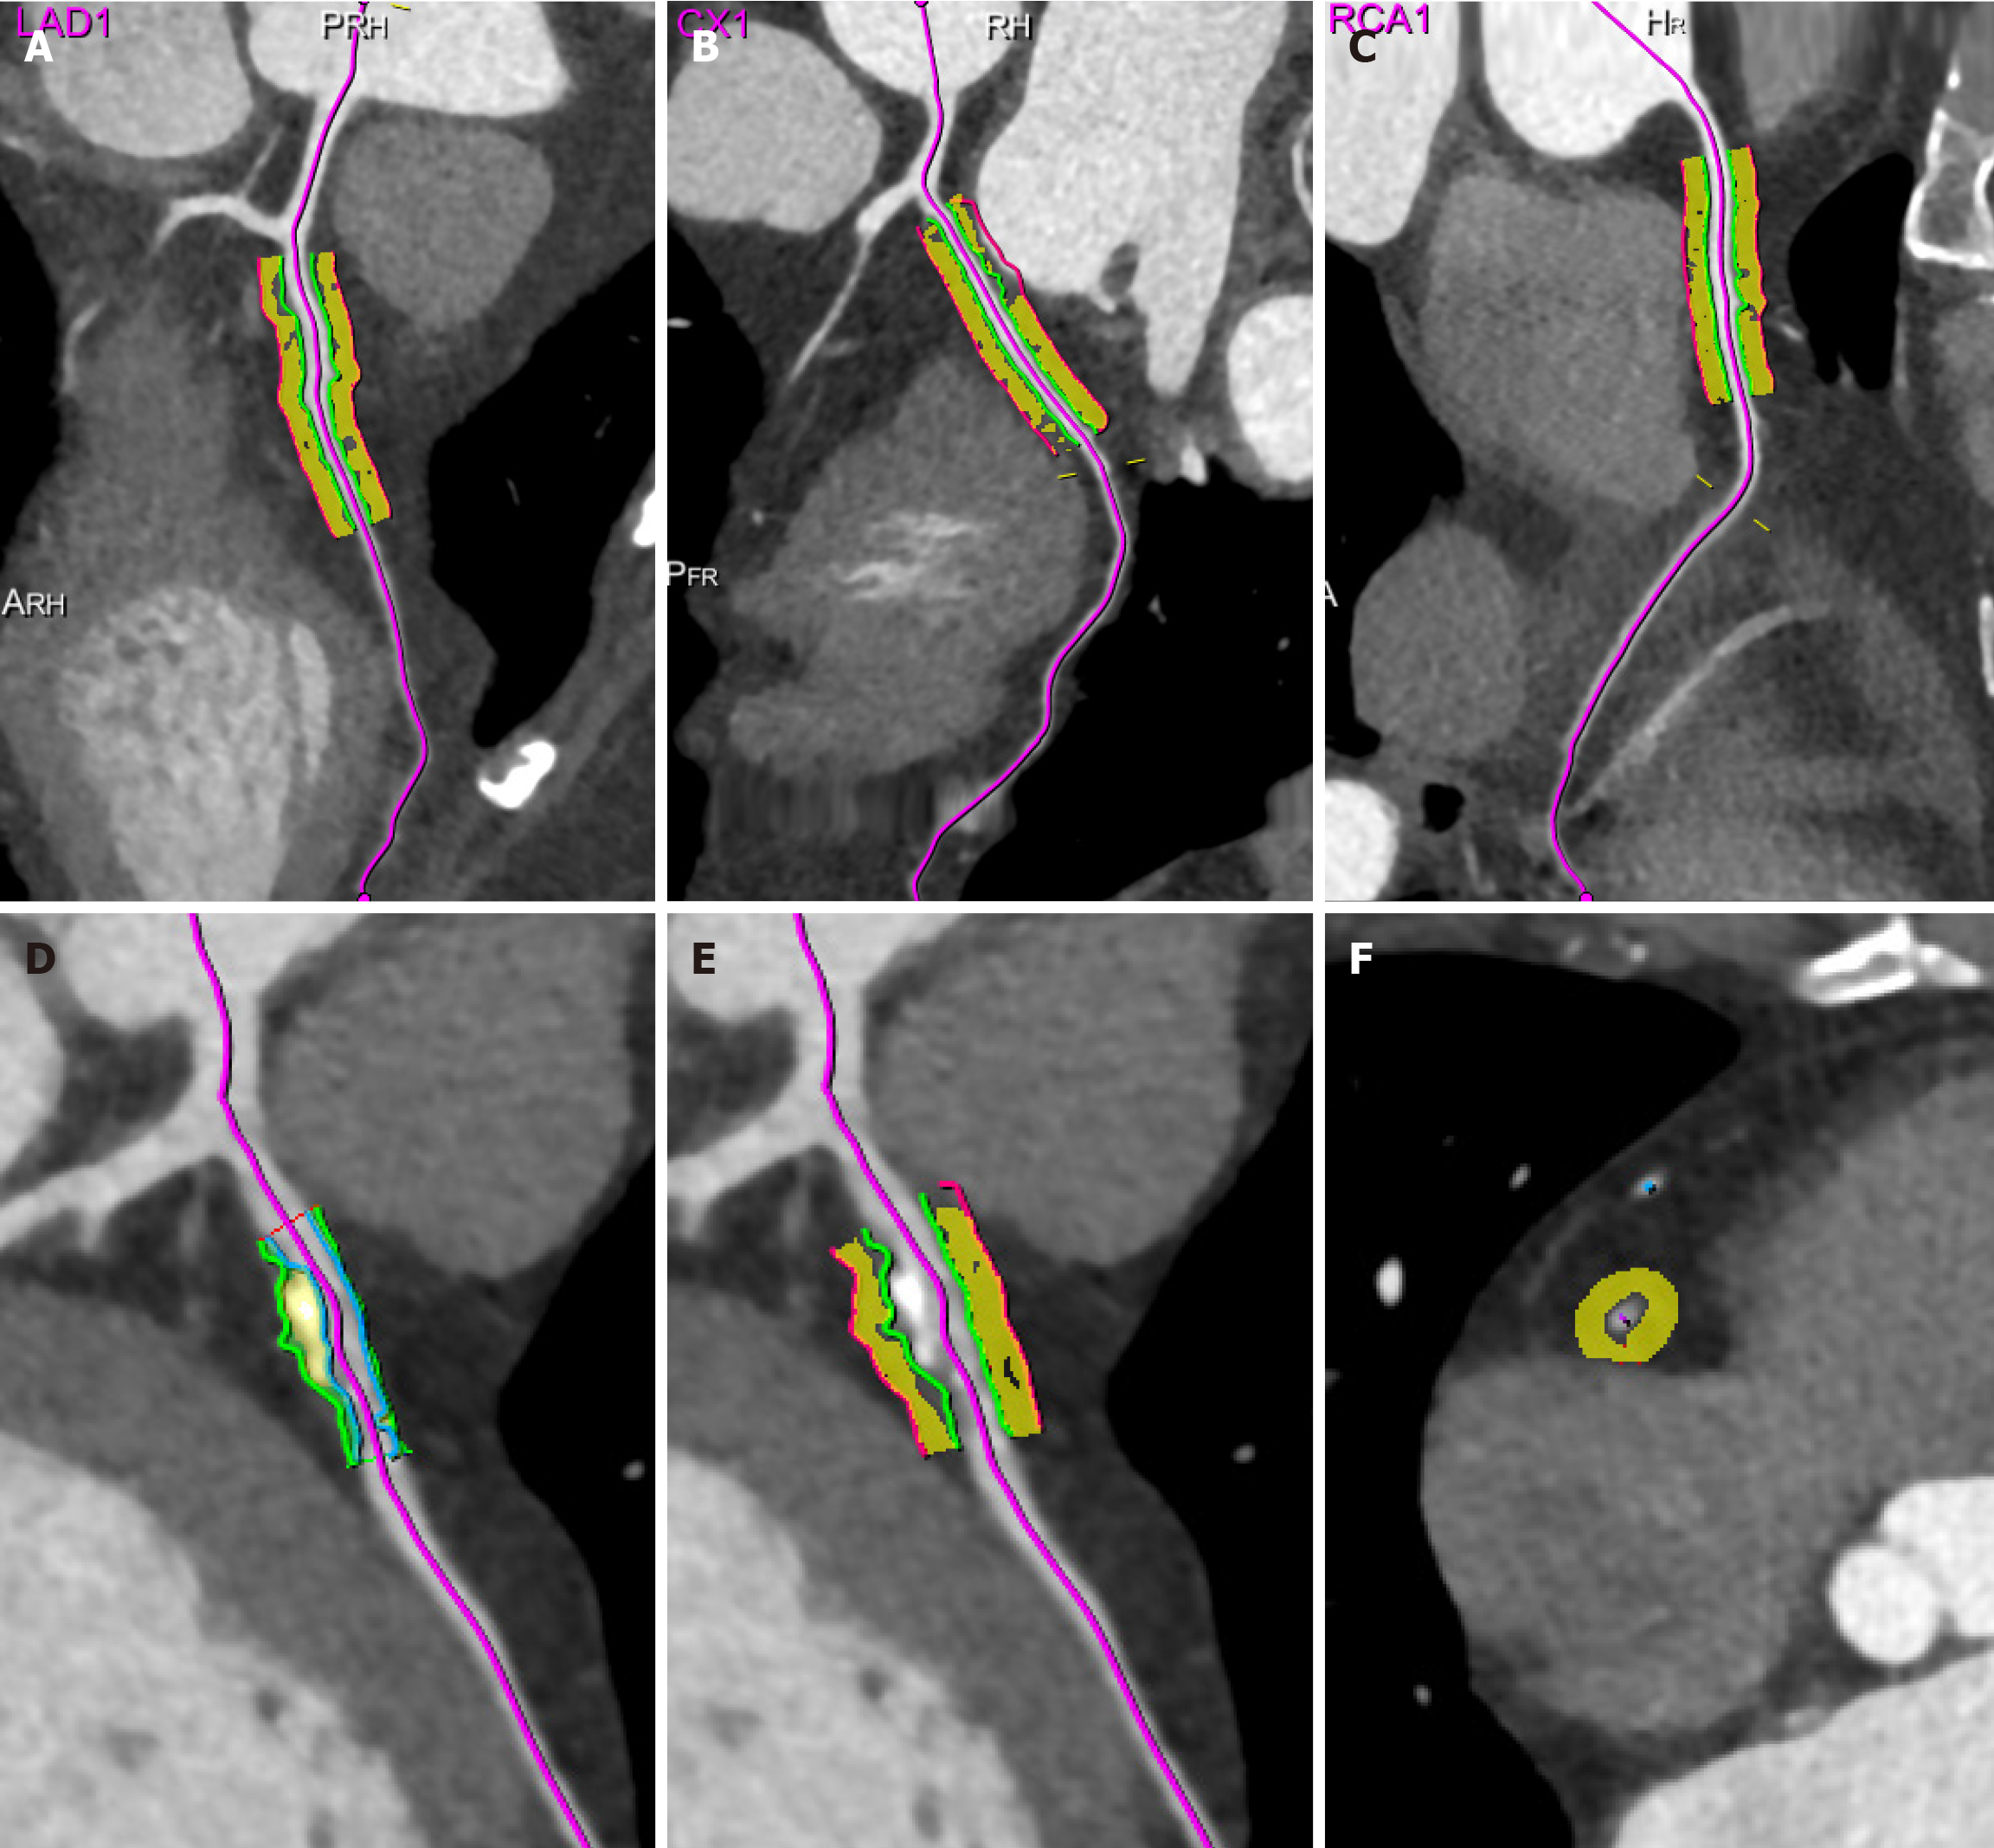
Figure 1 Pericoronary adipose tissue attenuation measurement in proximal 40 mm segments and lesion-specific regions.
A-C: Schematic of pericoronary adipose tissue (PCAT) attenuation measurement in the proximal 40 mm segments of the three coronary arteries (left anterior descending artery, left circumflex artery, right coronary artery); D and E: Schematic of lesion-specific PCAT attenuation measurement at the site of coronary lesions; F: Cross-sectional PCAT measurement. The measurement radial range is defined as the PCAT within a distance equal to the vessel diameter. LAD: Left anterior descending; CX: Circumflex; RCA: Right coronary artery.
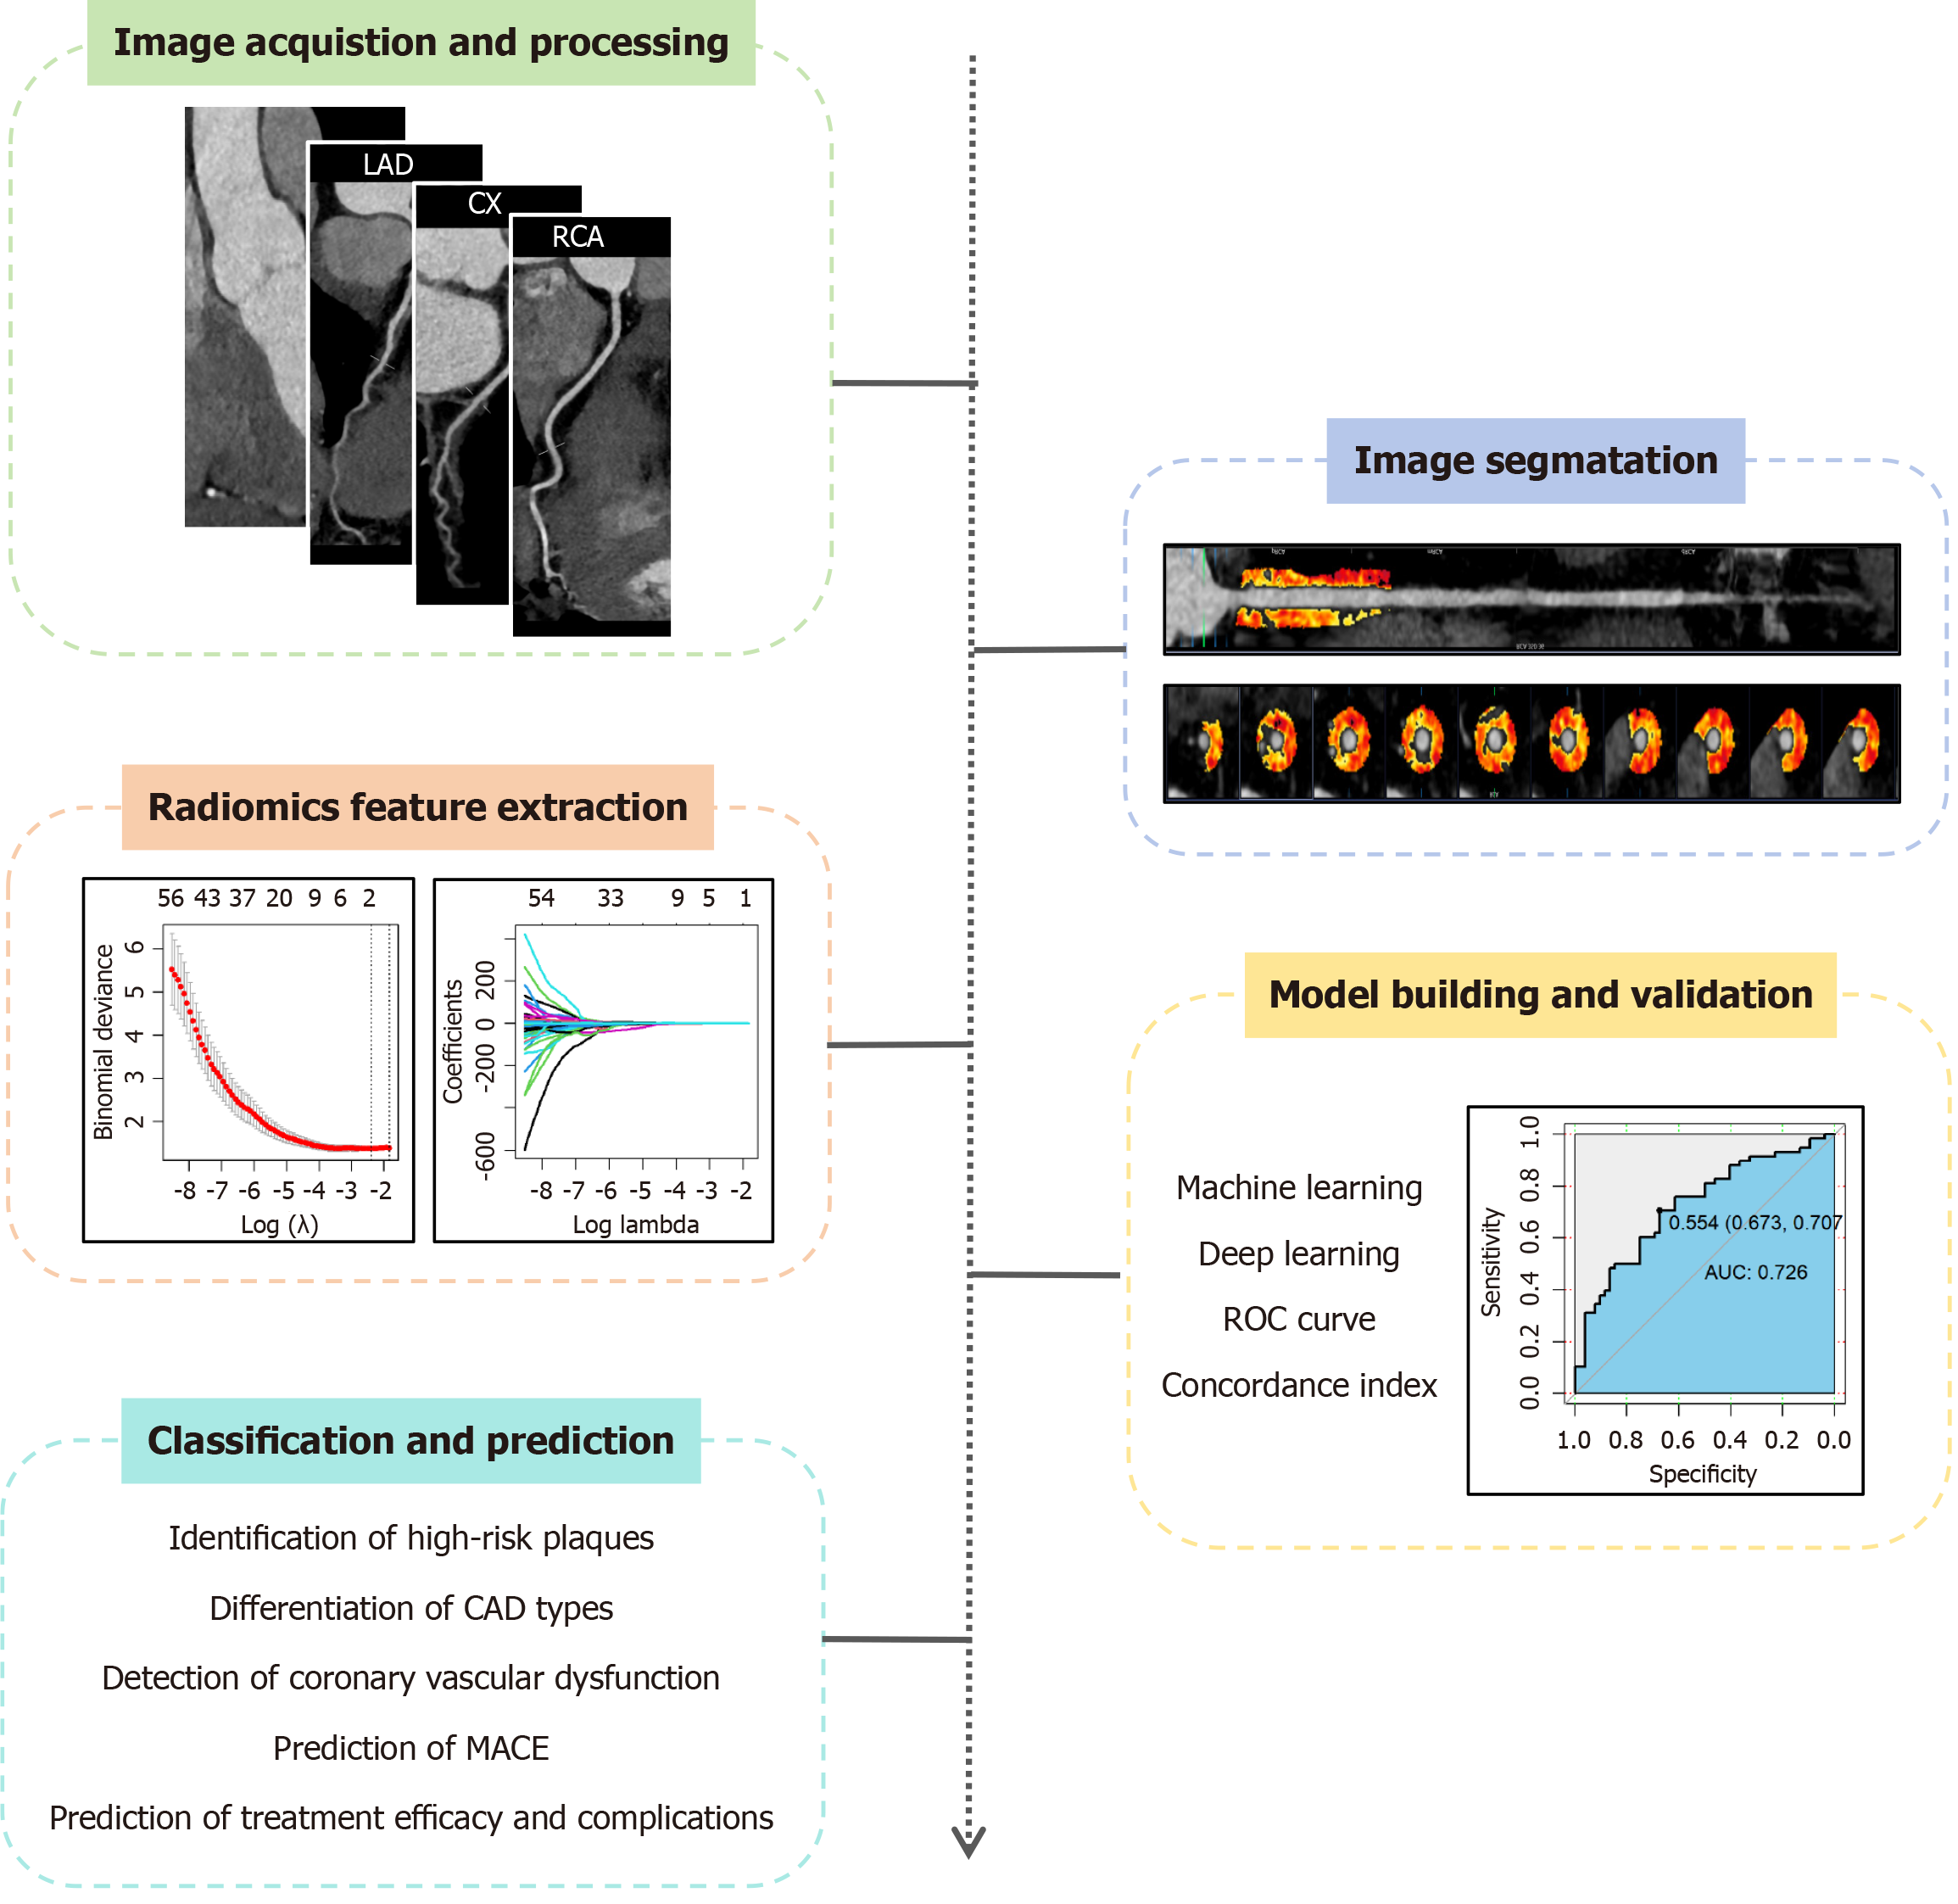
Figure 2 Workflow diagram of pericoronary adipose tissue radiomics.
LAD: Left anterior descending; CX: Circumflex; RCA: Right coronary artery; CAD: Coronary artery disease; MACE: Major adverse cardiac event; ROC: Receiver operating characteristic; AUC: Area under the curve.
- Citation: Wang LL, Xiong YB, Feng XY, Liu YY, Su KX, Jiang SY, Wang SY, Zhou L, Li SK, Guo DD, Li R. Computed tomography-based assessment of pericoronary adipose tissue in cardiovascular diseases: Diagnostic and prognostic implications. World J Radiol 2025; 17(6): 107281
- URL: https://www.wjgnet.com/1949-8470/full/v17/i6/107281.htm
- DOI: https://dx.doi.org/10.4329/wjr.v17.i6.107281


