Copyright
©The Author(s) 2021.
World J Radiol. May 28, 2021; 13(5): 137-148
Published online May 28, 2021. doi: 10.4329/wjr.v13.i5.137
Published online May 28, 2021. doi: 10.4329/wjr.v13.i5.137
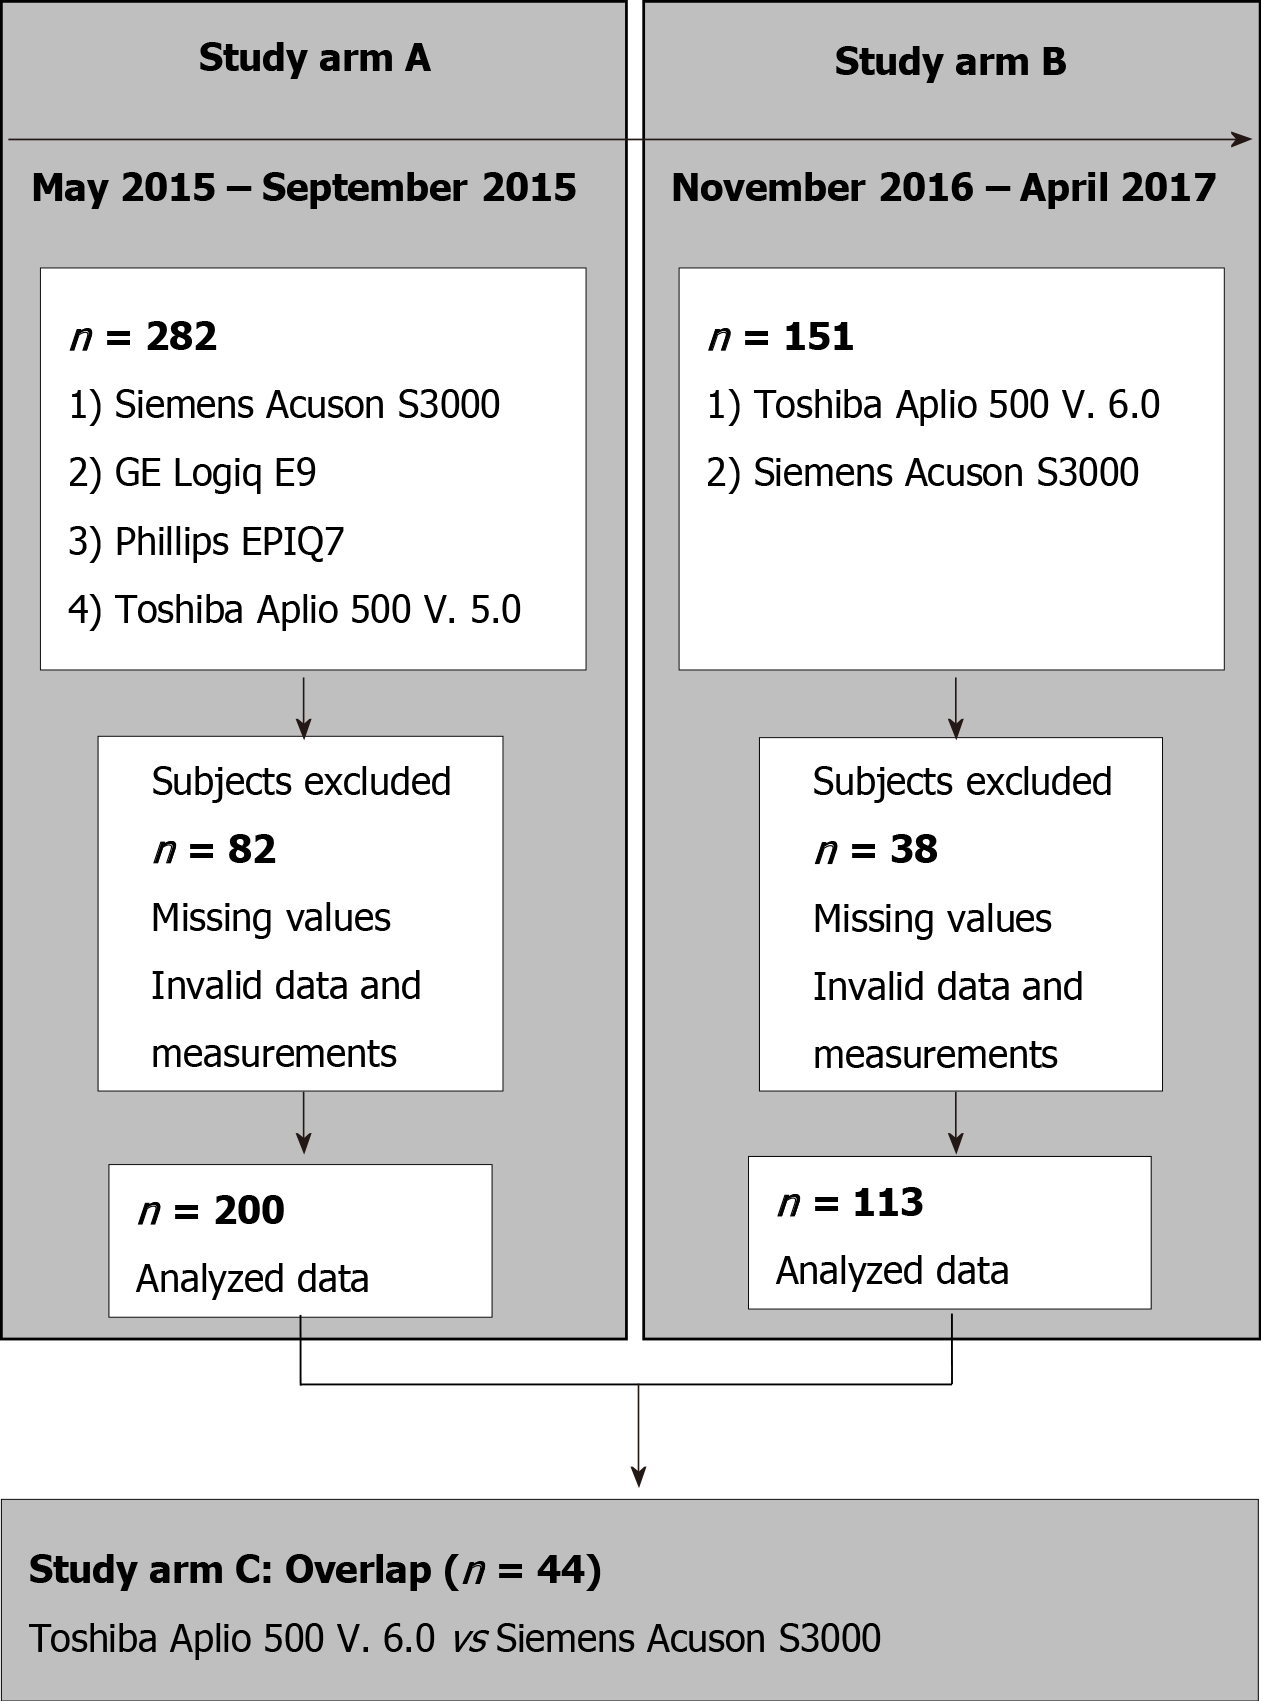
Figure 1 Flow chart of study arm inclusion and exclusion.
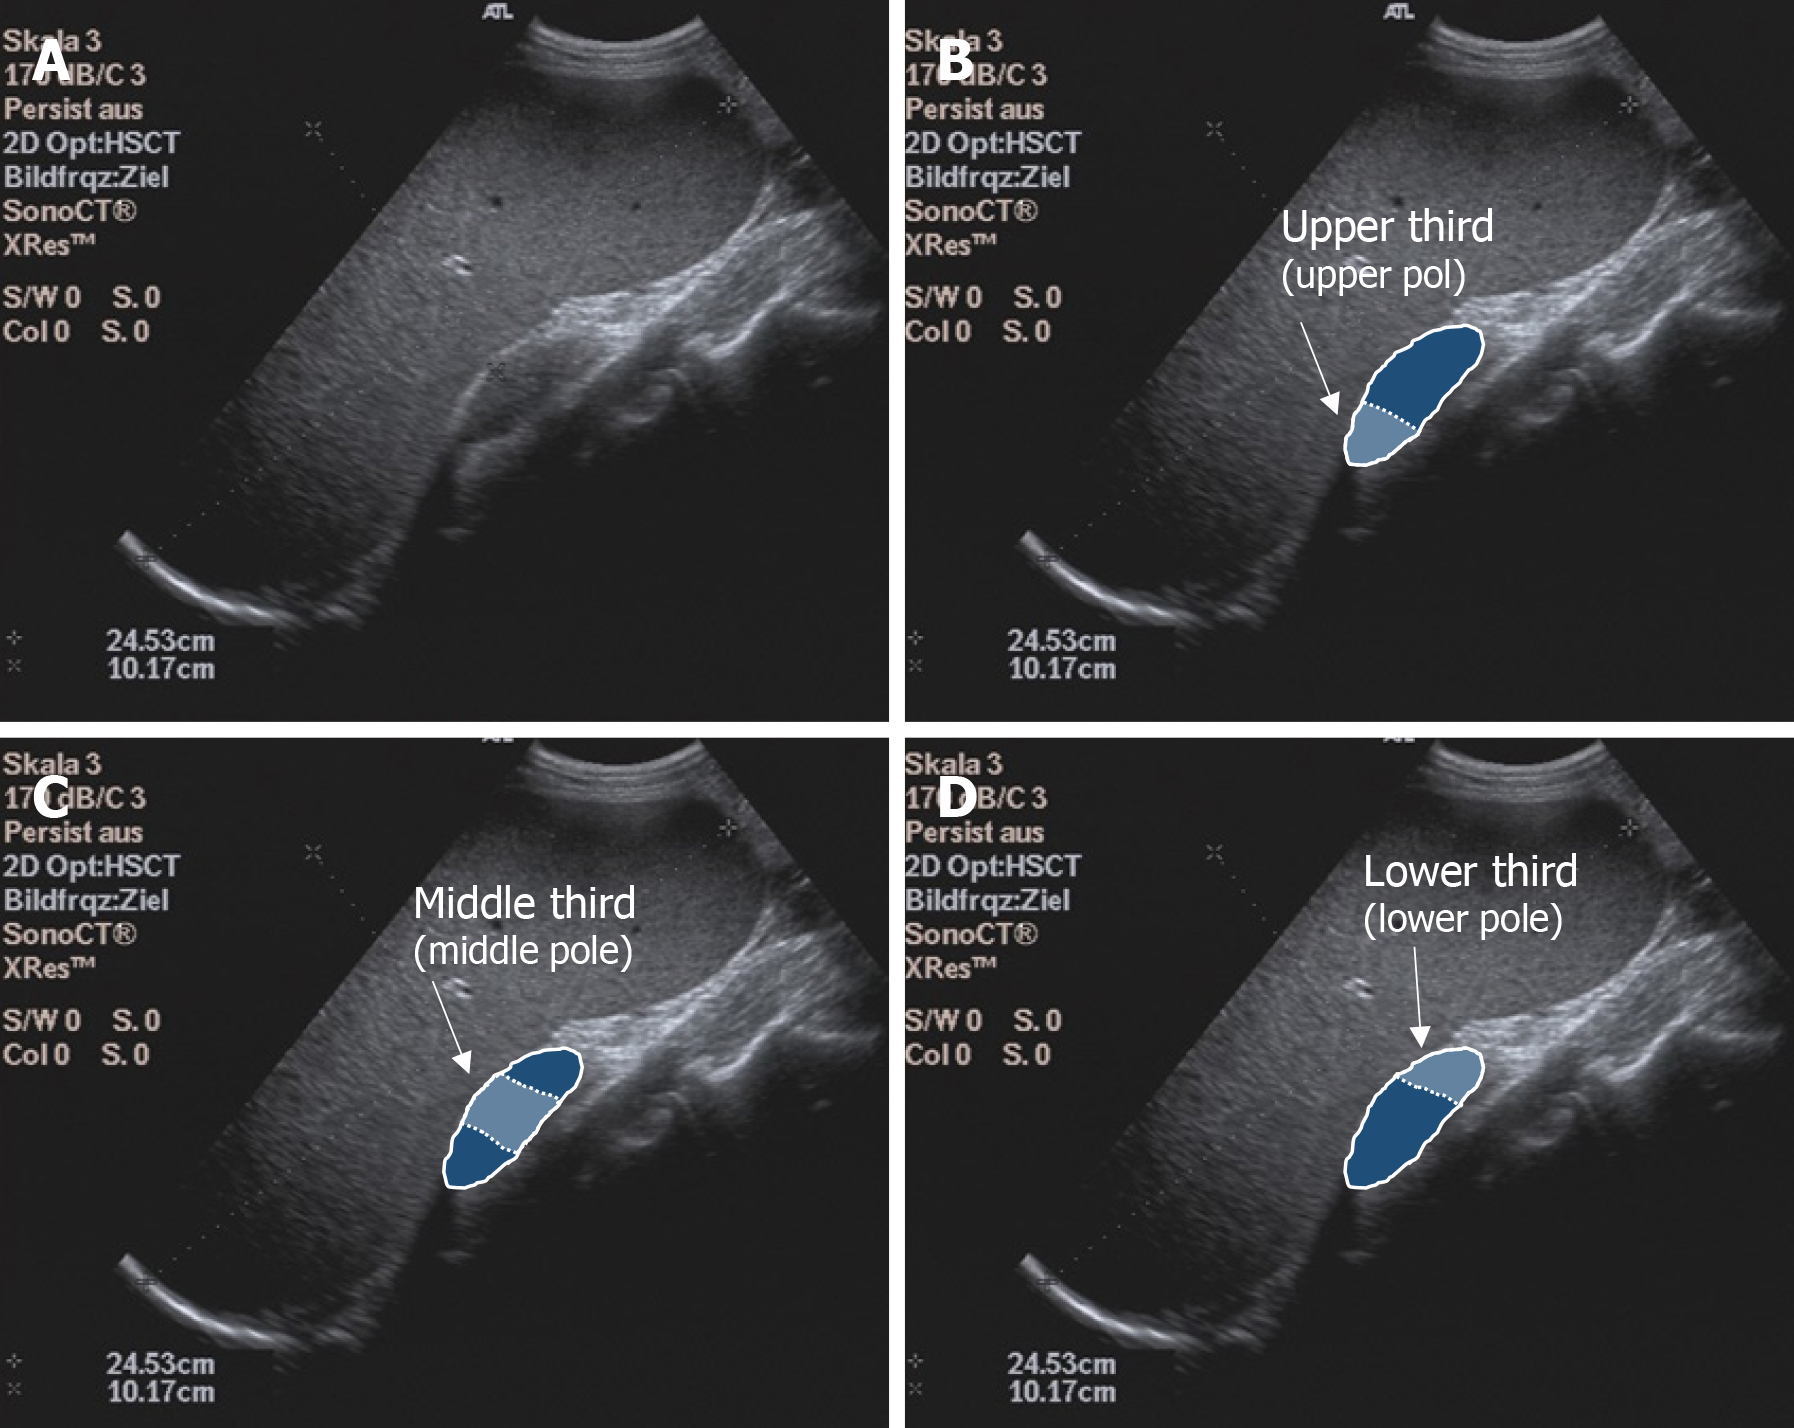
Figure 2 Illustration of the examination of the spleen.
A: B-Mode Ultrasound image of the spleen; B: Upper spleen pole; C: Middle spleen pole; and D: Lower spleen pole.
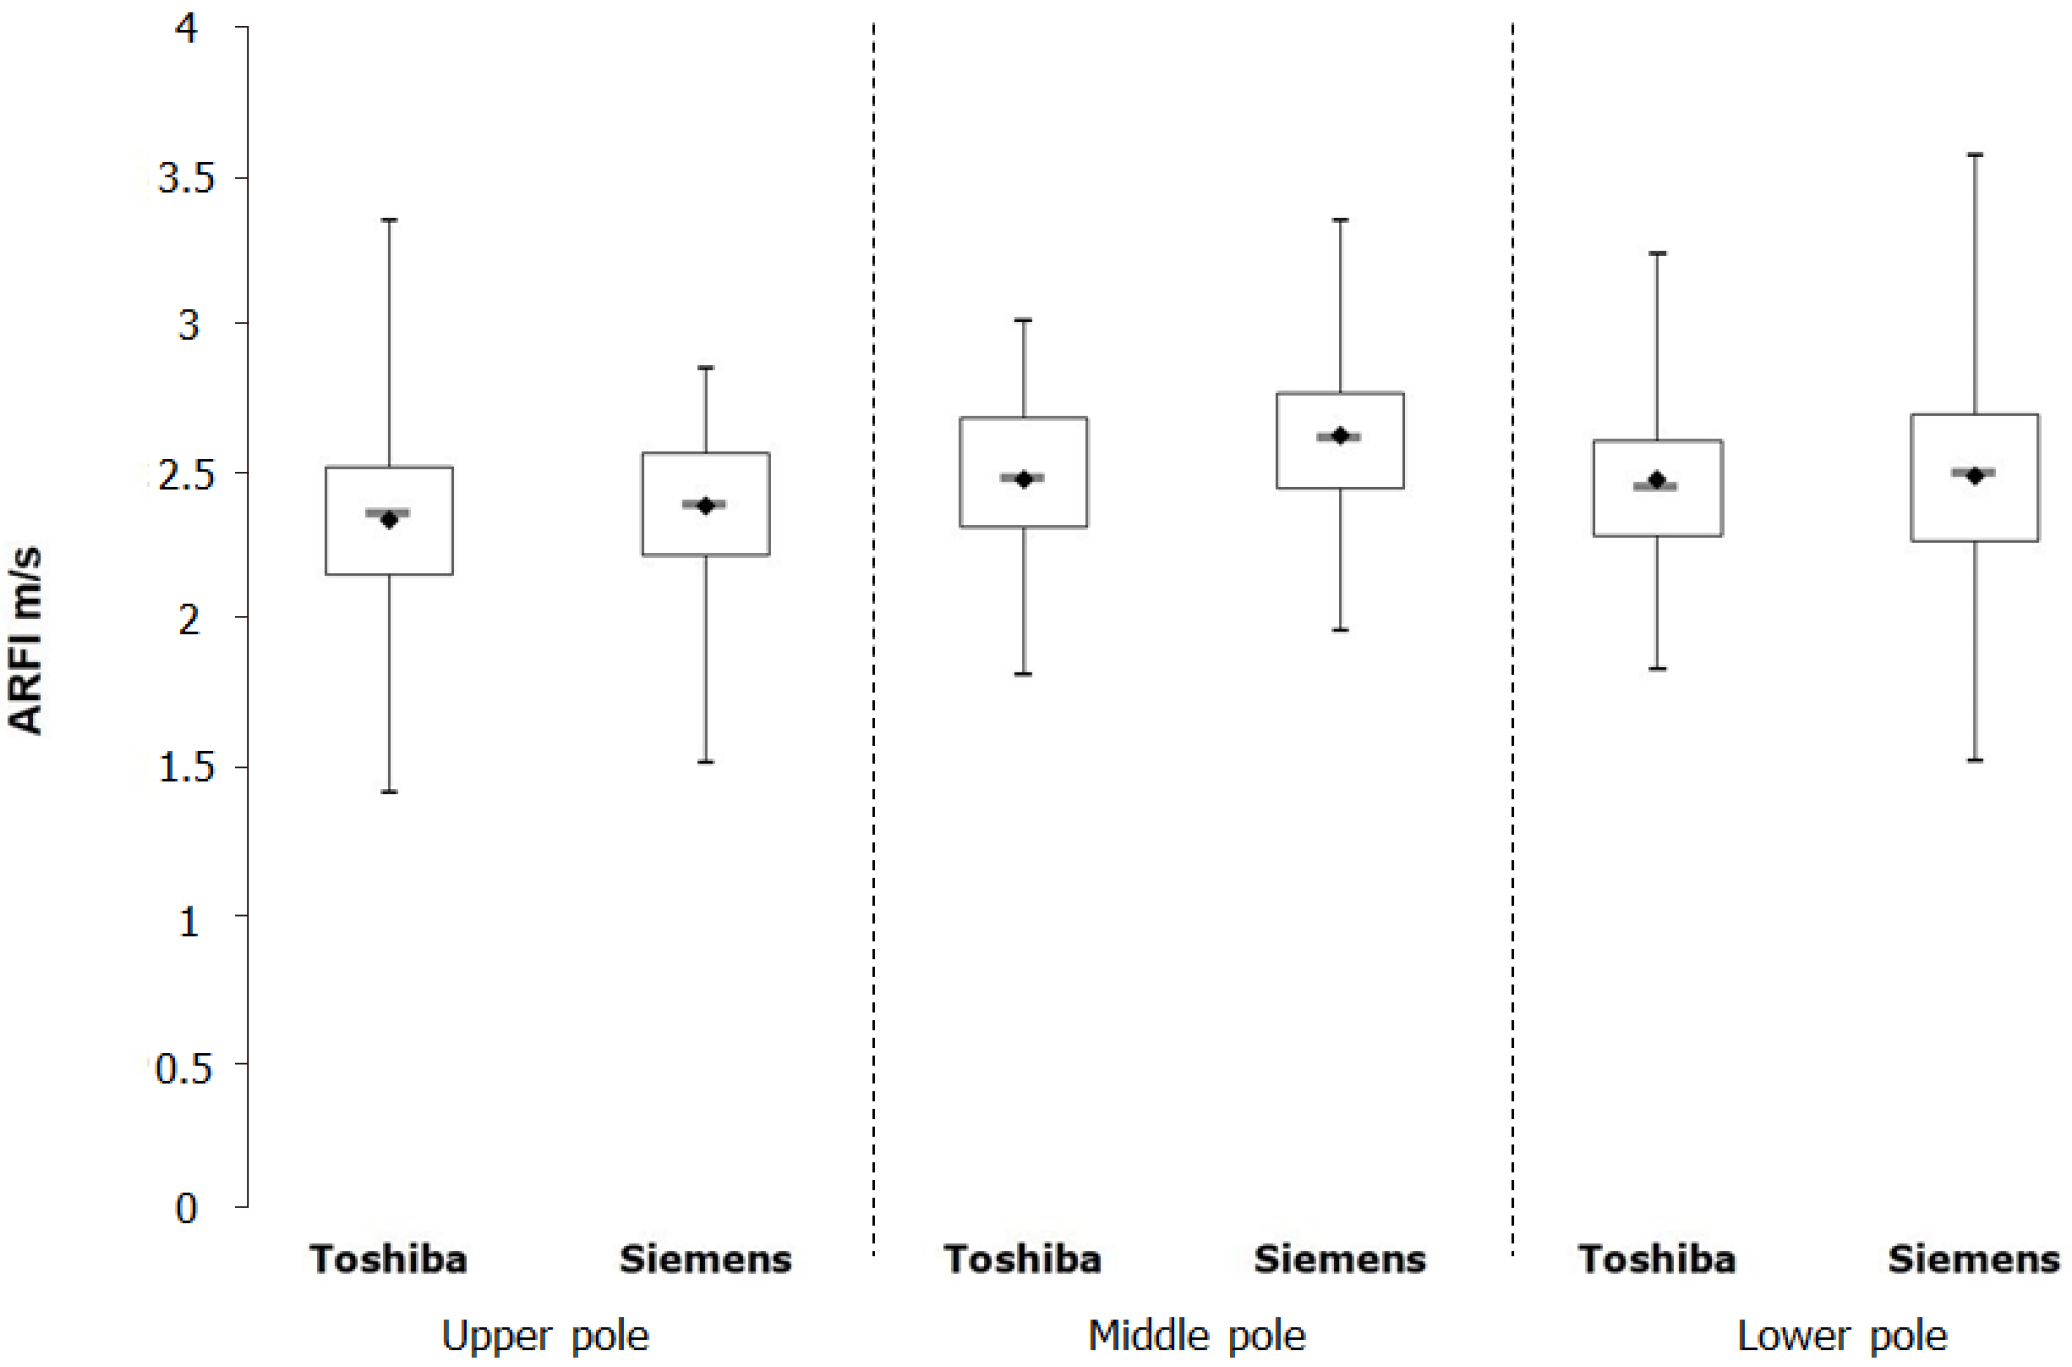
Figure 3 Boxplot diagram illustrating the measurements on the Toshiba Aplio 400 version 6.
0 and Siemens devices for the different splenic sections. ARFI: Acoustic radiation force impulse.
- Citation: Nowotny F, Schmidberger J, Schlingeloff P, Binzberger A, Kratzer W. Comparison of point and two-dimensional shear wave elastography of the spleen in healthy subjects. World J Radiol 2021; 13(5): 137-148
- URL: https://www.wjgnet.com/1949-8470/full/v13/i5/137.htm
- DOI: https://dx.doi.org/10.4329/wjr.v13.i5.137


