Copyright
©The Author(s) 2020.
World J Radiol. Sep 28, 2020; 12(9): 195-203
Published online Sep 28, 2020. doi: 10.4329/wjr.v12.i9.195
Published online Sep 28, 2020. doi: 10.4329/wjr.v12.i9.195
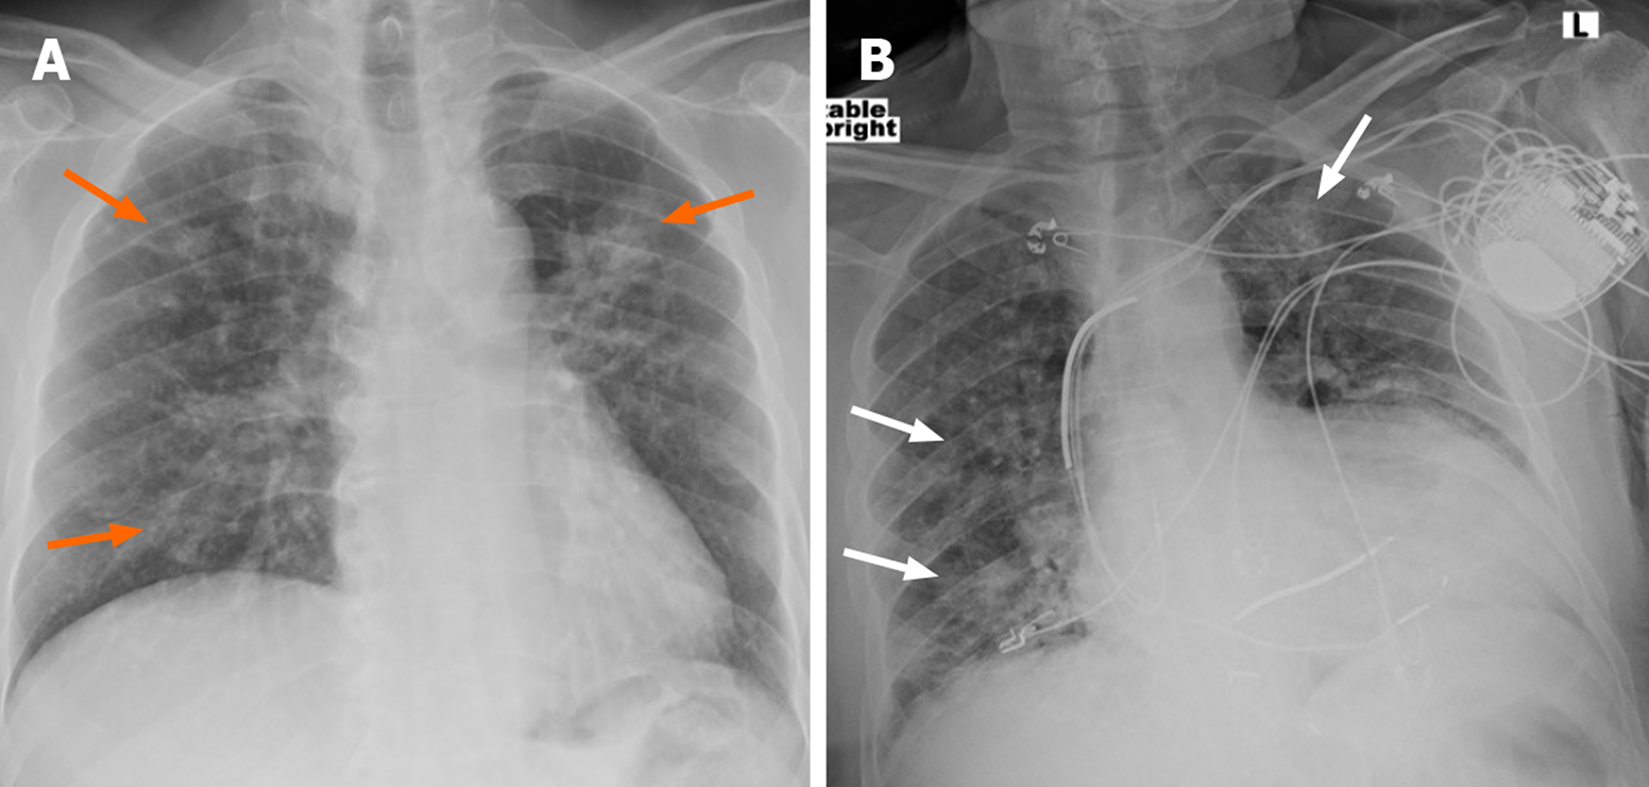
Figure 1 Chest radiography.
A: A 57 year old male with coronavirus disease 2019 (COVID-19) infection shows multifocal bilateral air-space opacities (orange arrows) in both lungs; B: Another 74 years old male came with cough and dyspnoea in emergency department shows hazy airspace opacities in both lung parenchymas (white arrows) who later turned out to be positive for COVID-19. A left chest wall AICD device is also seen.
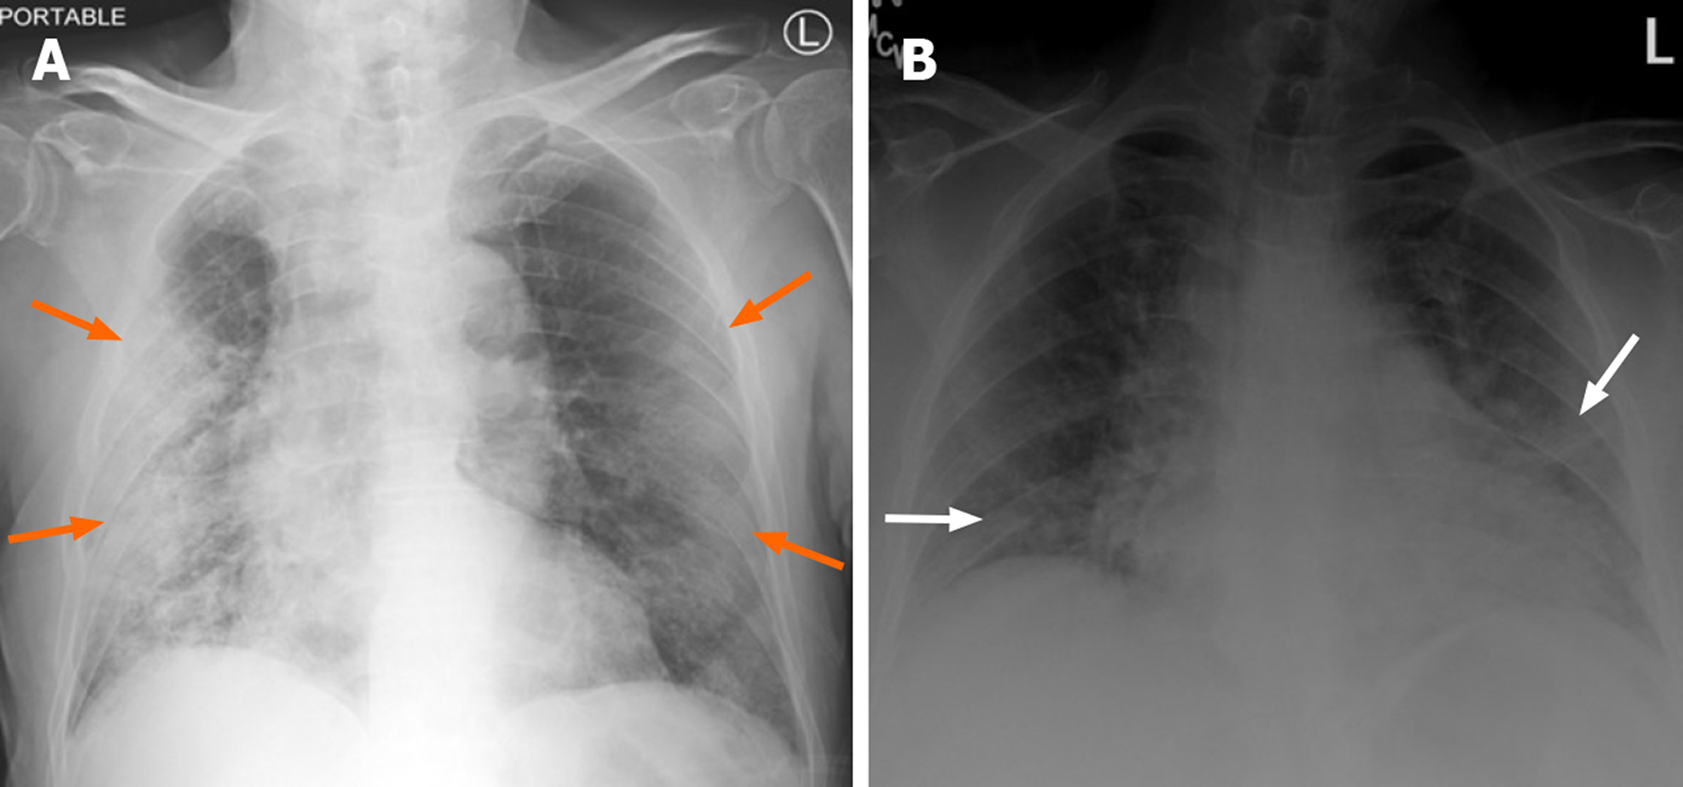
Figure 2 Chest radiography.
A: A 62 year old male presented with fever, cough and shortness of breath with coronavirus disease 2019 infection shows large air-space opacities with subpleural and peripheral predominance (orange arrows) in both lungs; B: A 61 years old female came with known cardiomegaly and congestive heart failure presented with cough shows patchy hazy airspace opacities in both lung parenchymas (white arrows).
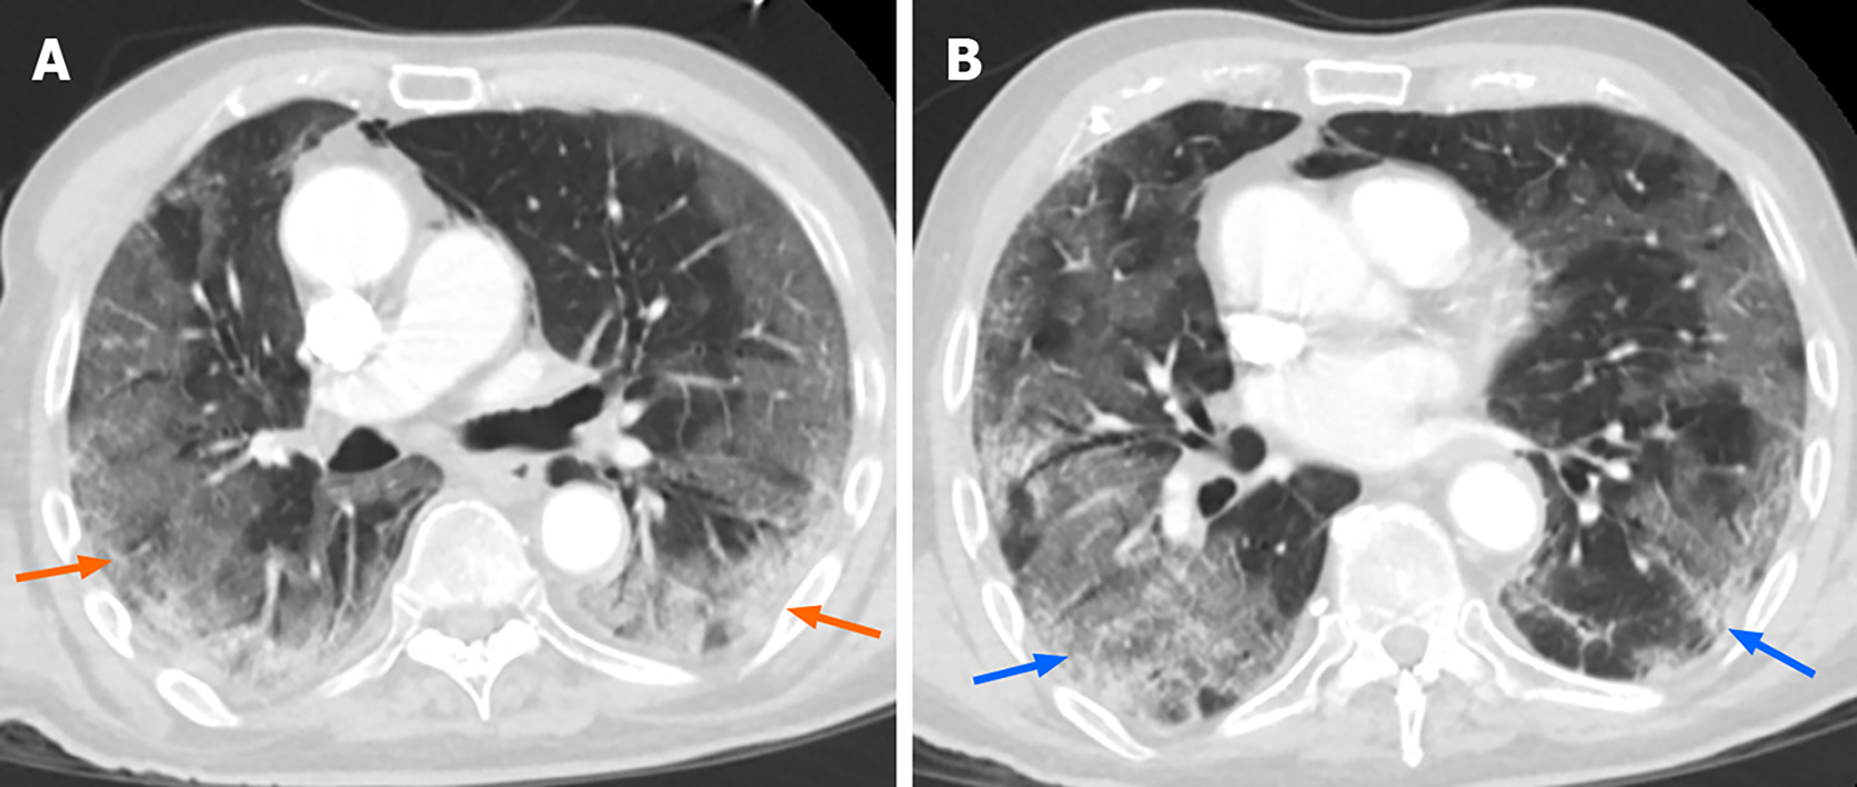
Figure 3 Postcontrast axial computed tomography chest in lung windows (A and B) show bilateral basal and peripheral consolidative opacities with patchy ground glass opacities in crazy-paving pattern in coronavirus disease 2019 infected 63 year old patient (orange and blue arrows).
Figure 4 Another coronavirus disease 2019 infected 57 year old patient shows patchy ground glass opacities in both lower lobes without crazy-paving pattern (orange arrows) in postcontrast axial computed tomography chest in lung windows (A-C).
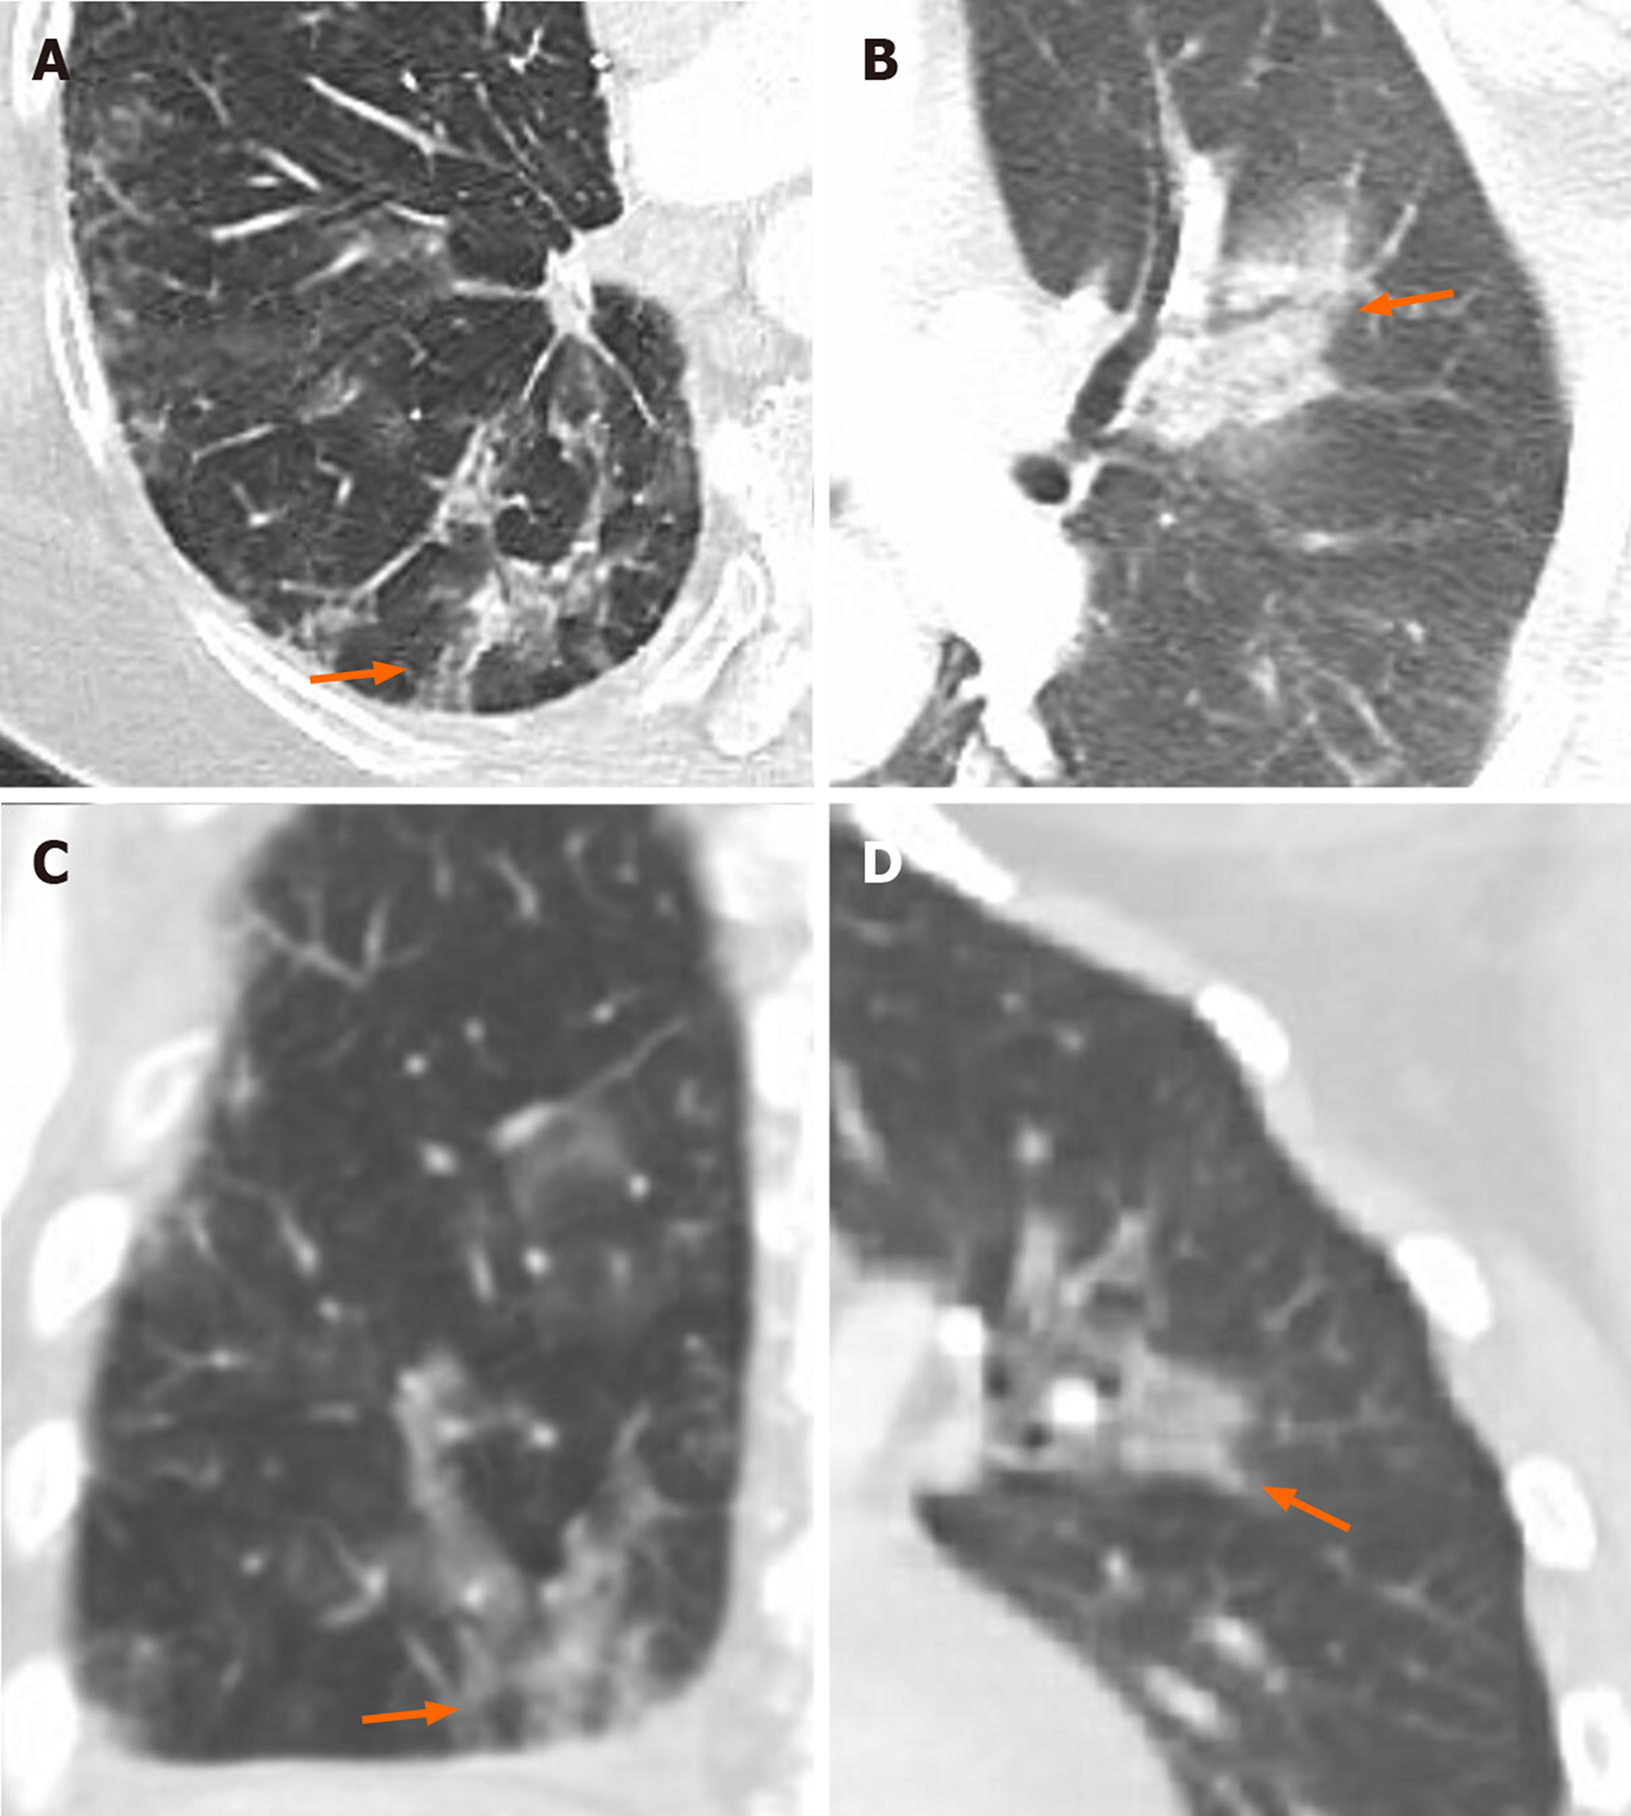
Figure 5 Multifocal patchy peribronchovascular ground glass to consolidative opacities in both lung parenchymas (orange arrows) in enlarged axial (A and B) and coronal (C and D) computed tomography chest in lung window.
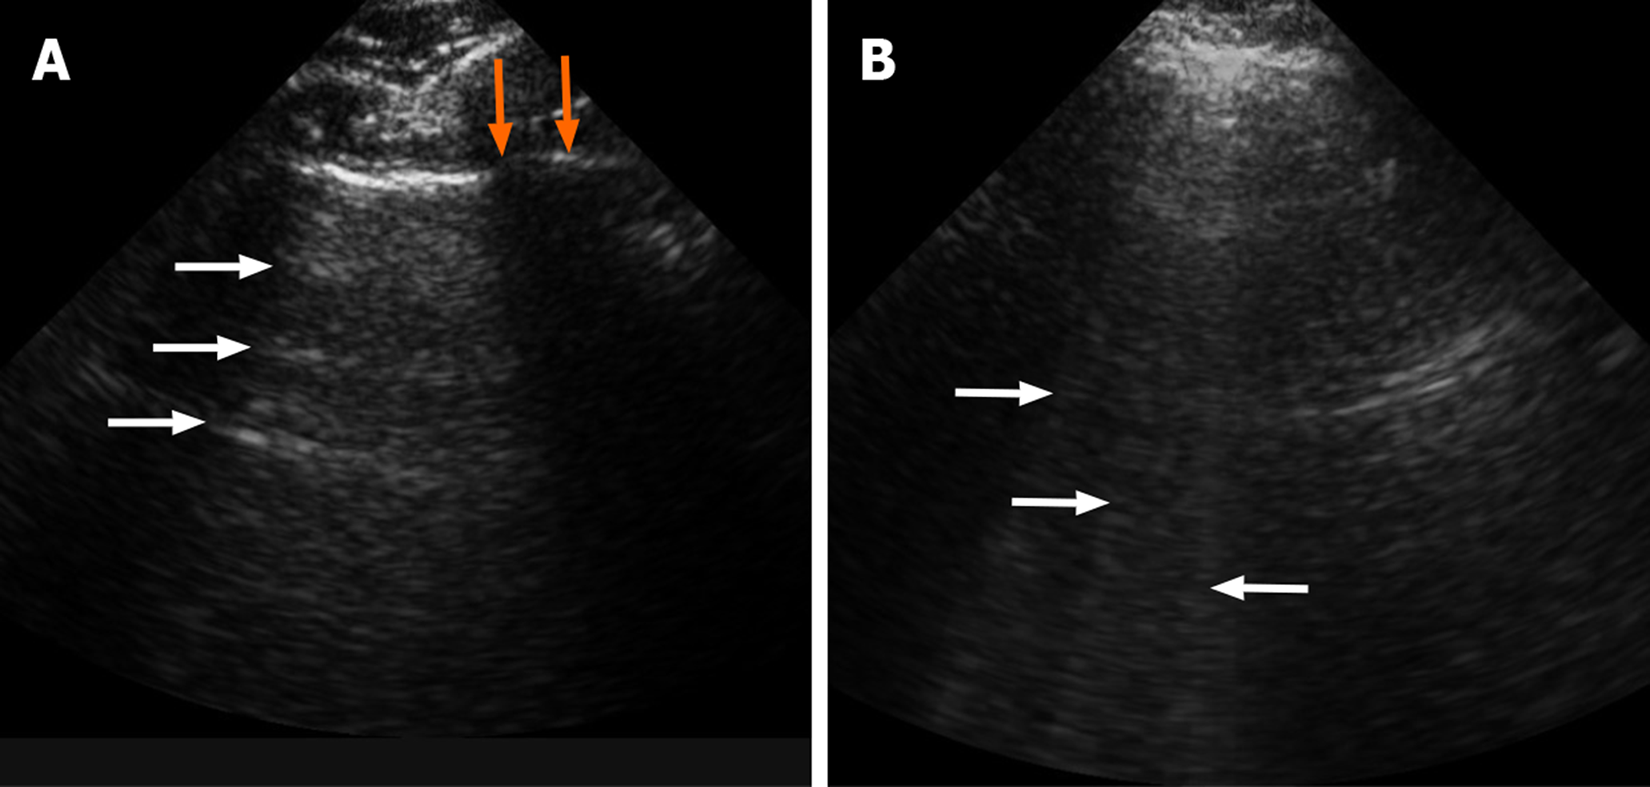
Figure 6 Ultrasonography imaging of the lung ultrasound of the normal lung shows horizontal artifacts, so called “A” lines (white arrows).
(A) and vertical heterogenous defect or so called vertical “B” lines in case of patient with consolidation and/or atelectasis (B). Also note normal rib shadow in figure A (orange arrows).
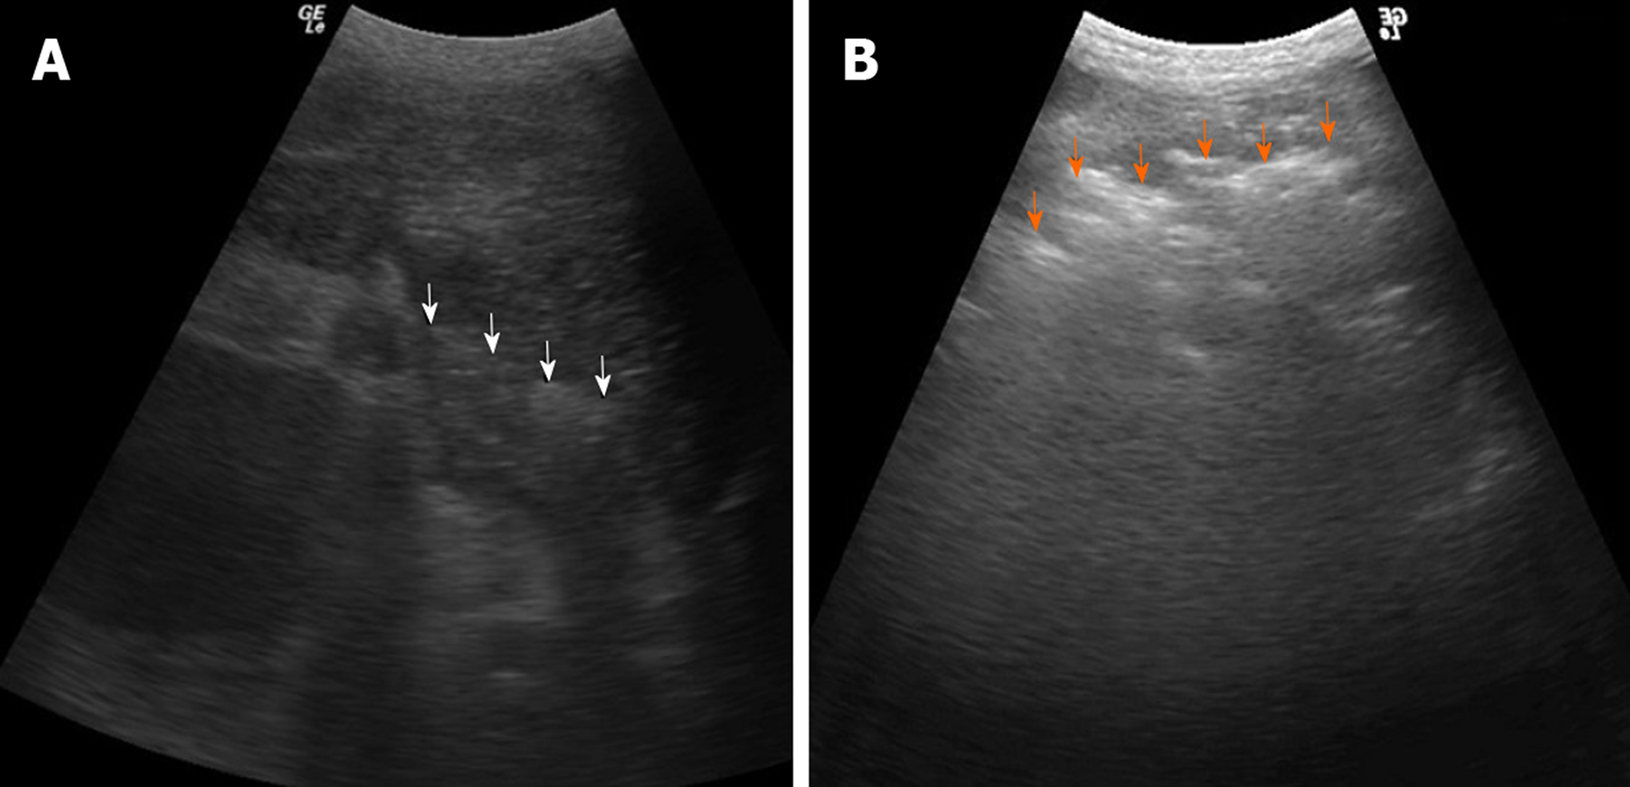
Figure 7 Ultrasonography imaging of the coronavirus disease 2019 positive patient shows shredded appearance, also known as “shred sign” seen with white arrows in left lung base (A) and orange arrows in right lung base (B).
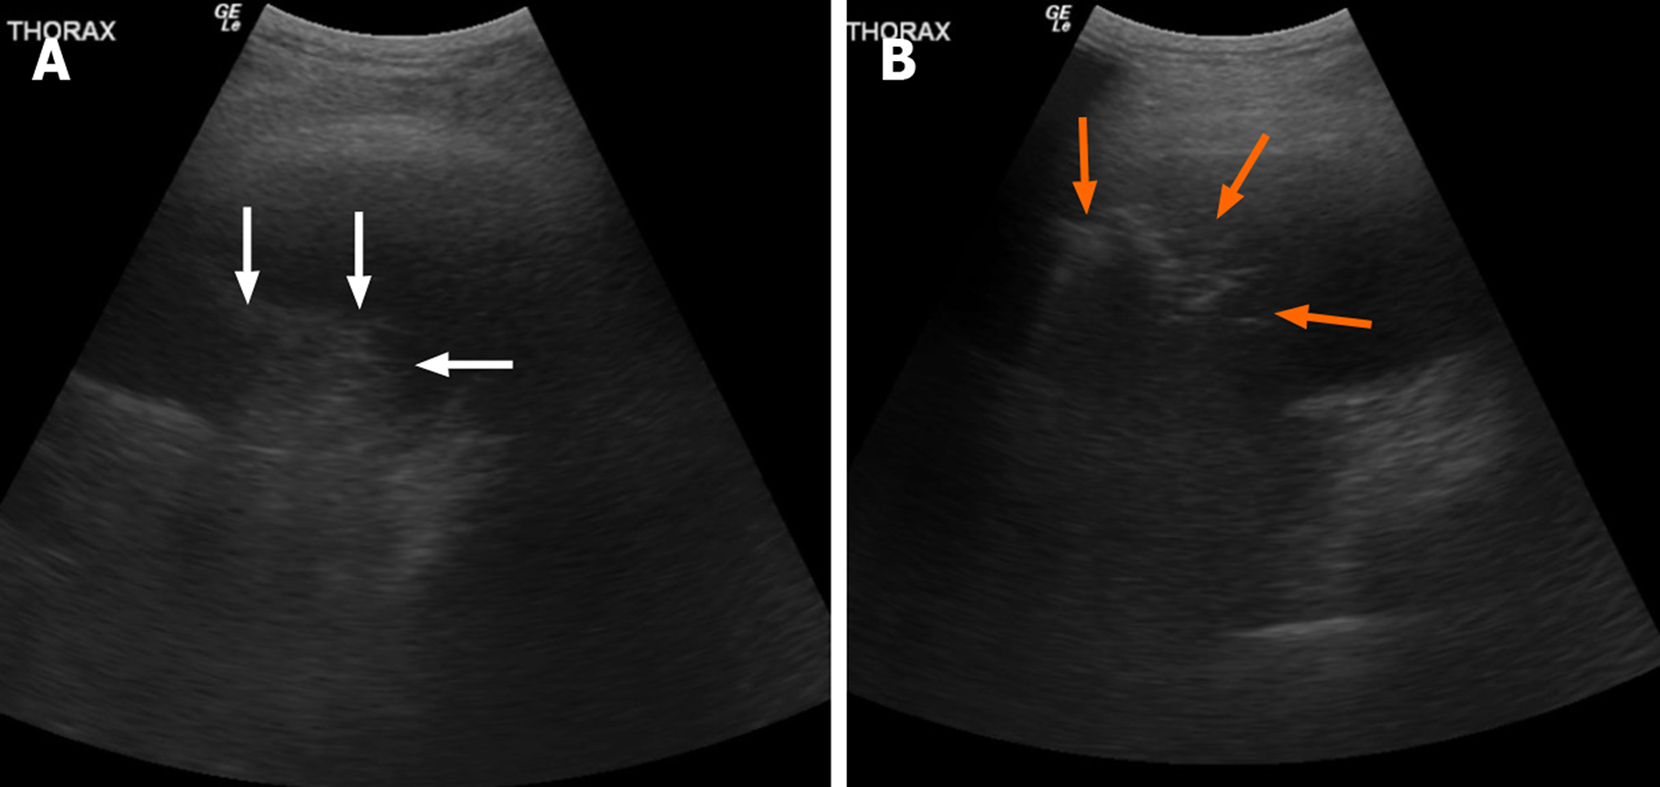
Figure 8 Ultrasonography imaging example of “hepatic pattern” or ”tissue pattern” of the consolidated lung (white arrows) with associated pleural effusion in right lung base (A).
Another example of ultrasonography “shred sign” of pneumonia (orange arrows) with adjacent pleural effusion in left lung base (B).
- Citation: Gandhi D, Ahuja K, Grover H, Sharma P, Solanki S, Gupta N, Patel L. Review of X-ray and computed tomography scan findings with a promising role of point of care ultrasound in COVID-19 pandemic. World J Radiol 2020; 12(9): 195-203
- URL: https://www.wjgnet.com/1949-8470/full/v12/i9/195.htm
- DOI: https://dx.doi.org/10.4329/wjr.v12.i9.195


