Copyright
©2014 Baishideng Publishing Group Inc.
World J Cardiol. Oct 26, 2014; 6(10): 1127-1130
Published online Oct 26, 2014. doi: 10.4330/wjc.v6.i10.1127
Published online Oct 26, 2014. doi: 10.4330/wjc.v6.i10.1127
Figure 1 Movies.
A: Intracardiac echocardiography (ICE) imaging showing right ventricle (RV) aneurysmal dilatation; B: At ICE, left ventricle was of normal size but with diffuse parietal hypertrophy and a mild pericardial effusion around the mitral valve plane; C: Right ventricular (RV) angiography in right anterior oblique projection.
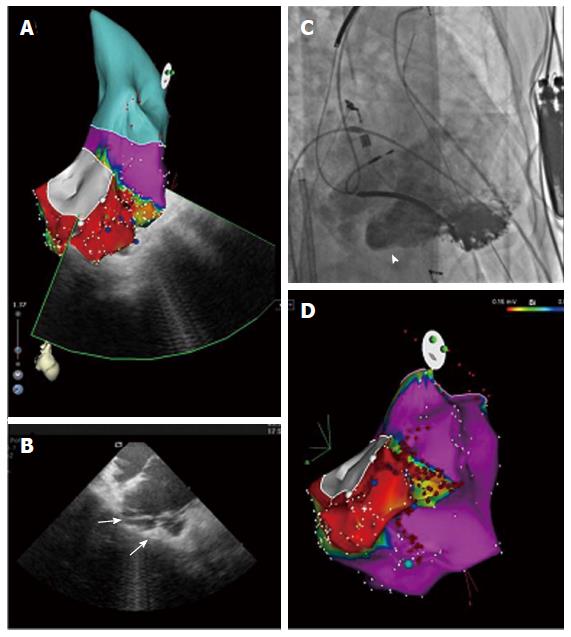
Figure 2 Right ventricle imaging.
A: Bipolar voltage map of the right ventricle (RV) in right anterior oblique view. The bipolar potential voltage values were normal in the whole ventricle (purple) except for a wide area (red) around the inferior-lateral portion of tricuspid valve; B: Intracardiac echo fan intersecting the low-voltage area, showing aneurysmal dilatation (arrows) characterized by thin walls and irregular multiple trabeculae; C: RV angiography confirming the presence of the aneurysmal dilatation (head arrow); D: substrate map in right anterior oblique view showing the RF lesion points. CA was guided by substrate map and was performed all along the borders of the aneurysm and extended to the peri-aneurysmal area leading to abolishment of all abnormal electrical activities.
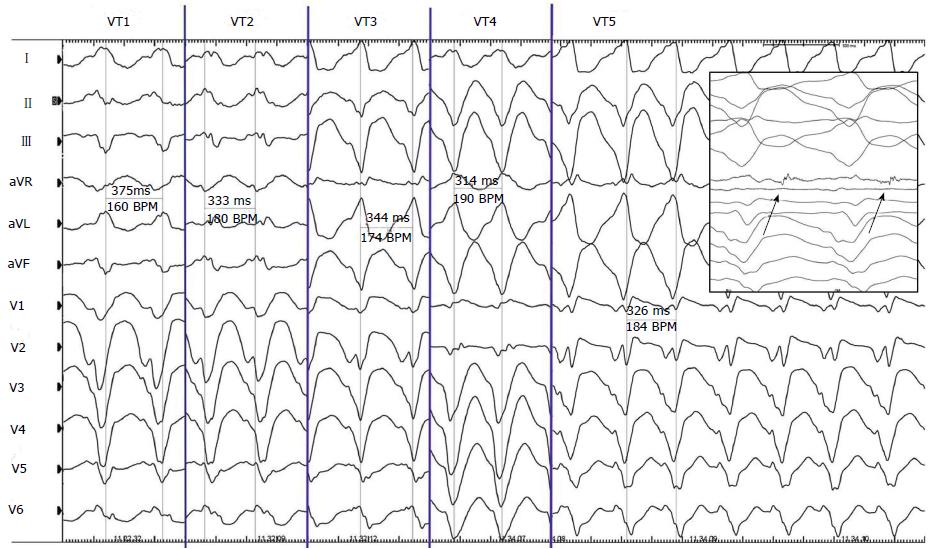
Figure 3 Cycle and QRS morphologies of all the 5 sustained ventricular tachyarrhythmias observed and mapped during the procedure.
In the box it is possible to appreciate the mid-diastolic potential (arrows) recorded during ventricular tachyarrhythmias (VT) 5. BPM: Beat per minute.
- Citation: Casella M, Carbucicchio C, Russo E, Pizzamiglio F, Golia P, Conti S, Costa F, Russo AD, Tondo C. Electrical storm in systemic sclerosis: Inside the electroanatomic substrate. World J Cardiol 2014; 6(10): 1127-1130
- URL: https://www.wjgnet.com/1949-8462/full/v6/i10/1127.htm
- DOI: https://dx.doi.org/10.4330/wjc.v6.i10.1127


