Copyright
©2011 Baishideng Publishing Group Co.
World J Cardiol. Nov 26, 2011; 3(11): 339-350
Published online Nov 26, 2011. doi: 10.4330/wjc.v3.i11.339
Published online Nov 26, 2011. doi: 10.4330/wjc.v3.i11.339
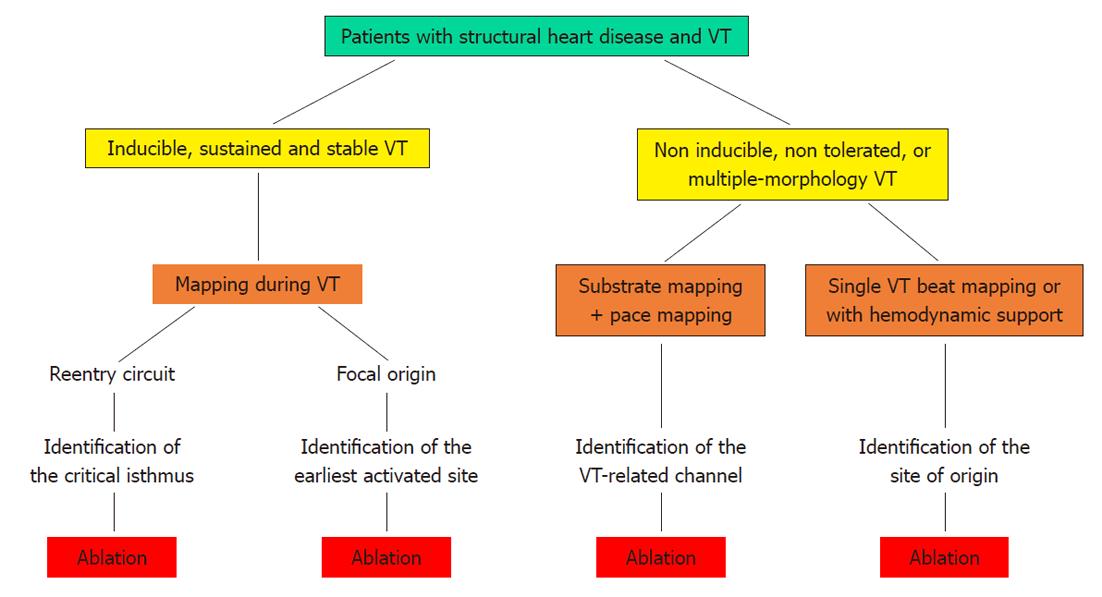
Figure 1 Strategies for catheter ablation of ventricular tachycardia.
Flow-chart of the possible strategies for catheter ablation of ventricular tachycardia (see text for further explanation). VT: Ventricular tachycardia.
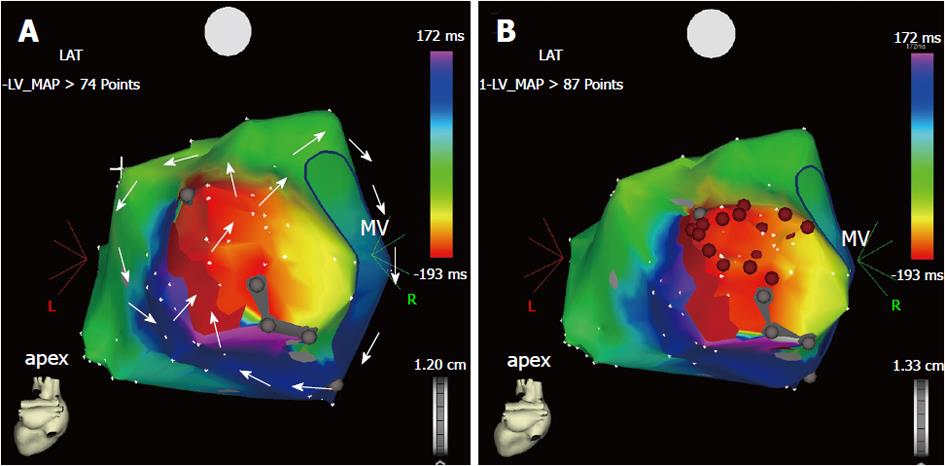
Figure 2 Three-dimensional electroanatomic map during macroreentrant ventricular tachycardia (A, B).
Postero-anterior view of the electroanatomic activation map of the left ventricular endocardium, reconstructed during ventricular tachycardia with a cycle length of 380 ms in a patient with postinfarction ischemic cardiomyopathy. A: The ventricular tachycardia is sustained by a reentry circuit, which has been fully reconstructed during point-by-point mapping. The reentry course is shown by the sequence of colors from red to purple (arrows). There are two reentrant loops: one rotates clockwise around the mitral annulus, whereas the other has a counter-clockwise course in the lateral wall of the left ventricle. Both loops share the mid-diastolic isthmus, the dark red area between two electrically silent areas (gray dots) where the two arrowed circles meet each other; B: Sequential radiofrequency energy applications (red dots) were delivered linearly to transect the critical isthmus and produce a line of block between the two electrically silent areas and the mitral annulus. No arrhythmia was inducible at the end of the procedure and the patient had no recurrence at the mid-term follow-up. MV: Mitral valve.
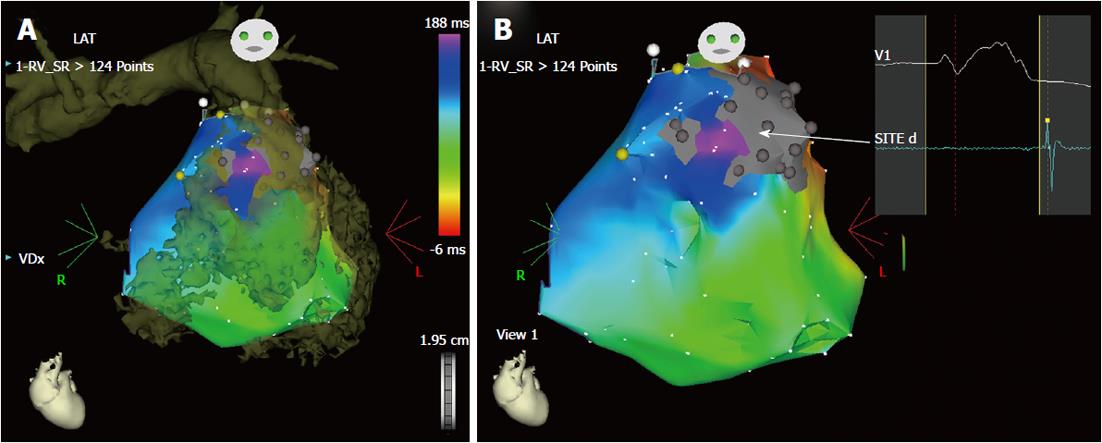
Figure 3 Imaging integration for ablation of ventricular tachycardia (A, B).
Example of integration of a computed tomography image in the three-dimensional electroanatomic system. This patient had ventricular tachycardia years after multiple surgical corrections for tetralogy of fallot with pulmonary artery stenosis. He was referred for multiple recurrences of drug-refractory ventricular tachycardia with two morphologies, both with left bundle branch morphology and inferior axis deviation. However, no arrhythmia was inducible during the electrophysiology testing. Therefore, the ablation strategy was based on substrate mapping in sinus rhythm with imaging integration (Figure 4). A: The three-dimensional rendering of the computed tomography (image in brown) of the right ventricle and pulmonary artery is superimposed on the electroanatomic mapping of the right ventricle in sinus rhythm. The merging of the two images helps reconstruct the geometry of the heart chamber and, particularly in this case, clarifies the anatomy of the right ventricular outflow tract, identifying precisely the pulmonary valve annulus, an essential landmark for ablation. The right ventricle appears hypertrophic and markedly dilated; B: The activation map in sinus rhythm is shown in the antero-posterior projection without the integrated image. There is a markedly delayed activation in the anterior wall of the outflow tract (in purple), in a channel between two electrically silent areas (in gray) related to previous surgery (ventriculotomy and positioning of a prosthetic patch). This channel (arrow) shows late bipolar recordings, after the end of the surface QRS (panel on right hand side) and could possibly be related to one morphology of ventricular tachycardia. During sinus rhythm, the earliest activated site (in red) of the right ventricular endocardium is the ventricular septum, consistent with a breakthrough of activation from the left bundle branch in the presence of a complete right bundle branch block.
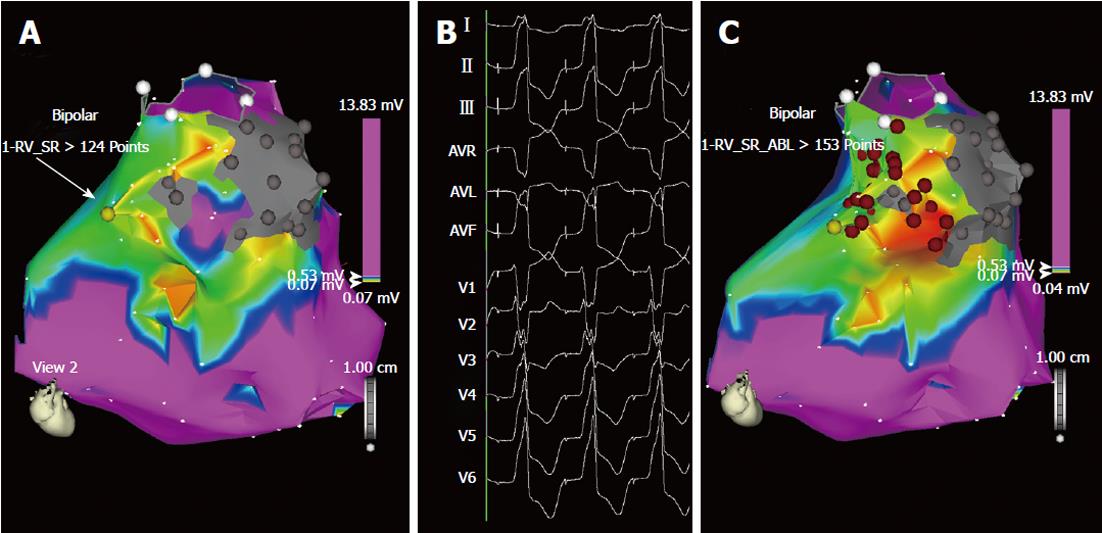
Figure 4 Ablation of “unmappable” ventricular tachycardia based on substrate mapping and pace-mapping (A, B).
Bipolar voltage mapping of the right ventricle in the same patient as in Figure 3. A: According to the settings used for this map, shown in antero-posterior view, the purple area has a bipolar voltage > 0.53 mV, while in the myocardium surrounding the two scars (in gray) the voltage is low, between 0.05 and 0.52 mV (colors from red to blue). In this area, pace-mapping is used to identify channels of low voltage and slow conduction possibly related to the two ventricular tachycardia morphologies clinically documented. In addition to the channel of slow conduction identified between the two scars during sinus rhythm (Figure 3), a second channel of low voltage and slow conduction is now identified by pacing at 600 ms cycle length in the area marked by the yellow dot (arrow); B: In this site, pacing reproduces one of the two ventricular tachycardia morphologies. Interestingly, the interval between the stimulus artifact and the onset of the QRS complex is markedly prolonged (125 ms) and this demonstrates the presence of slow conduction in this area; C: The same map is now shown in right anterior oblique view with two lines of radiofrequency energy applications (red dots) delivered to transect the two channels: one line is deployed between the two scars and the other between one scar and the pulmonary artery annulus (circle marked by white dots). No arrhythmia was inducible at the end of the procedure and the patient had no recurrences during follow-up.
- Citation: Ponti RD. Role of catheter ablation of ventricular tachycardia associated with structural heart disease. World J Cardiol 2011; 3(11): 339-350
- URL: https://www.wjgnet.com/1949-8462/full/v3/i11/339.htm
- DOI: https://dx.doi.org/10.4330/wjc.v3.i11.339


