Copyright
©2011 Baishideng Publishing Group Co.
World J Cardiol. Nov 26, 2011; 3(11): 339-350
Published online Nov 26, 2011. doi: 10.4330/wjc.v3.i11.339
Published online Nov 26, 2011. doi: 10.4330/wjc.v3.i11.339
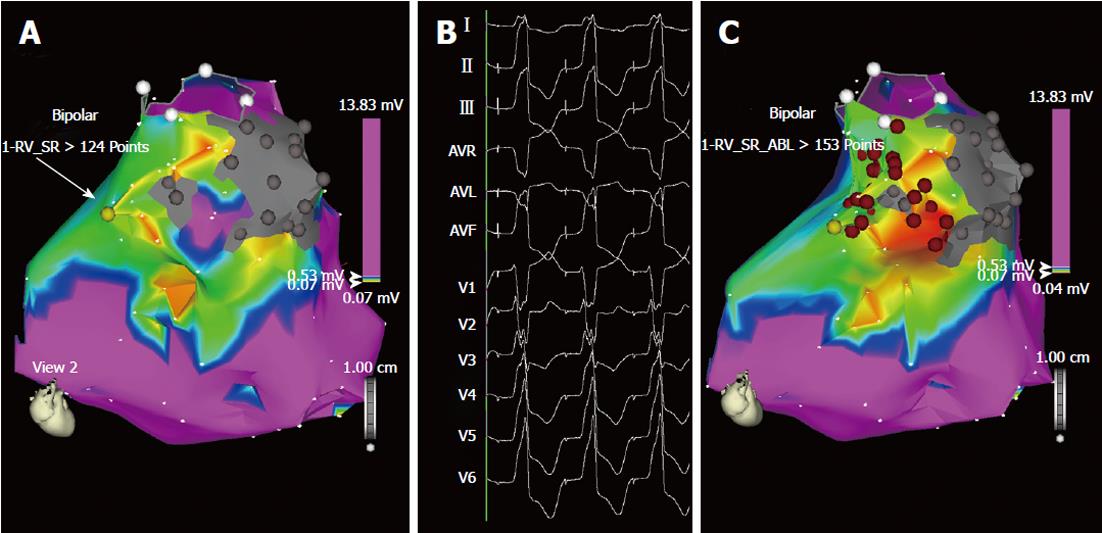
Figure 4 Ablation of “unmappable” ventricular tachycardia based on substrate mapping and pace-mapping (A, B).
Bipolar voltage mapping of the right ventricle in the same patient as in Figure 3. A: According to the settings used for this map, shown in antero-posterior view, the purple area has a bipolar voltage > 0.53 mV, while in the myocardium surrounding the two scars (in gray) the voltage is low, between 0.05 and 0.52 mV (colors from red to blue). In this area, pace-mapping is used to identify channels of low voltage and slow conduction possibly related to the two ventricular tachycardia morphologies clinically documented. In addition to the channel of slow conduction identified between the two scars during sinus rhythm (Figure 3), a second channel of low voltage and slow conduction is now identified by pacing at 600 ms cycle length in the area marked by the yellow dot (arrow); B: In this site, pacing reproduces one of the two ventricular tachycardia morphologies. Interestingly, the interval between the stimulus artifact and the onset of the QRS complex is markedly prolonged (125 ms) and this demonstrates the presence of slow conduction in this area; C: The same map is now shown in right anterior oblique view with two lines of radiofrequency energy applications (red dots) delivered to transect the two channels: one line is deployed between the two scars and the other between one scar and the pulmonary artery annulus (circle marked by white dots). No arrhythmia was inducible at the end of the procedure and the patient had no recurrences during follow-up.
- Citation: Ponti RD. Role of catheter ablation of ventricular tachycardia associated with structural heart disease. World J Cardiol 2011; 3(11): 339-350
- URL: https://www.wjgnet.com/1949-8462/full/v3/i11/339.htm
- DOI: https://dx.doi.org/10.4330/wjc.v3.i11.339


