
















Copyright: ©Author(s) 2026.
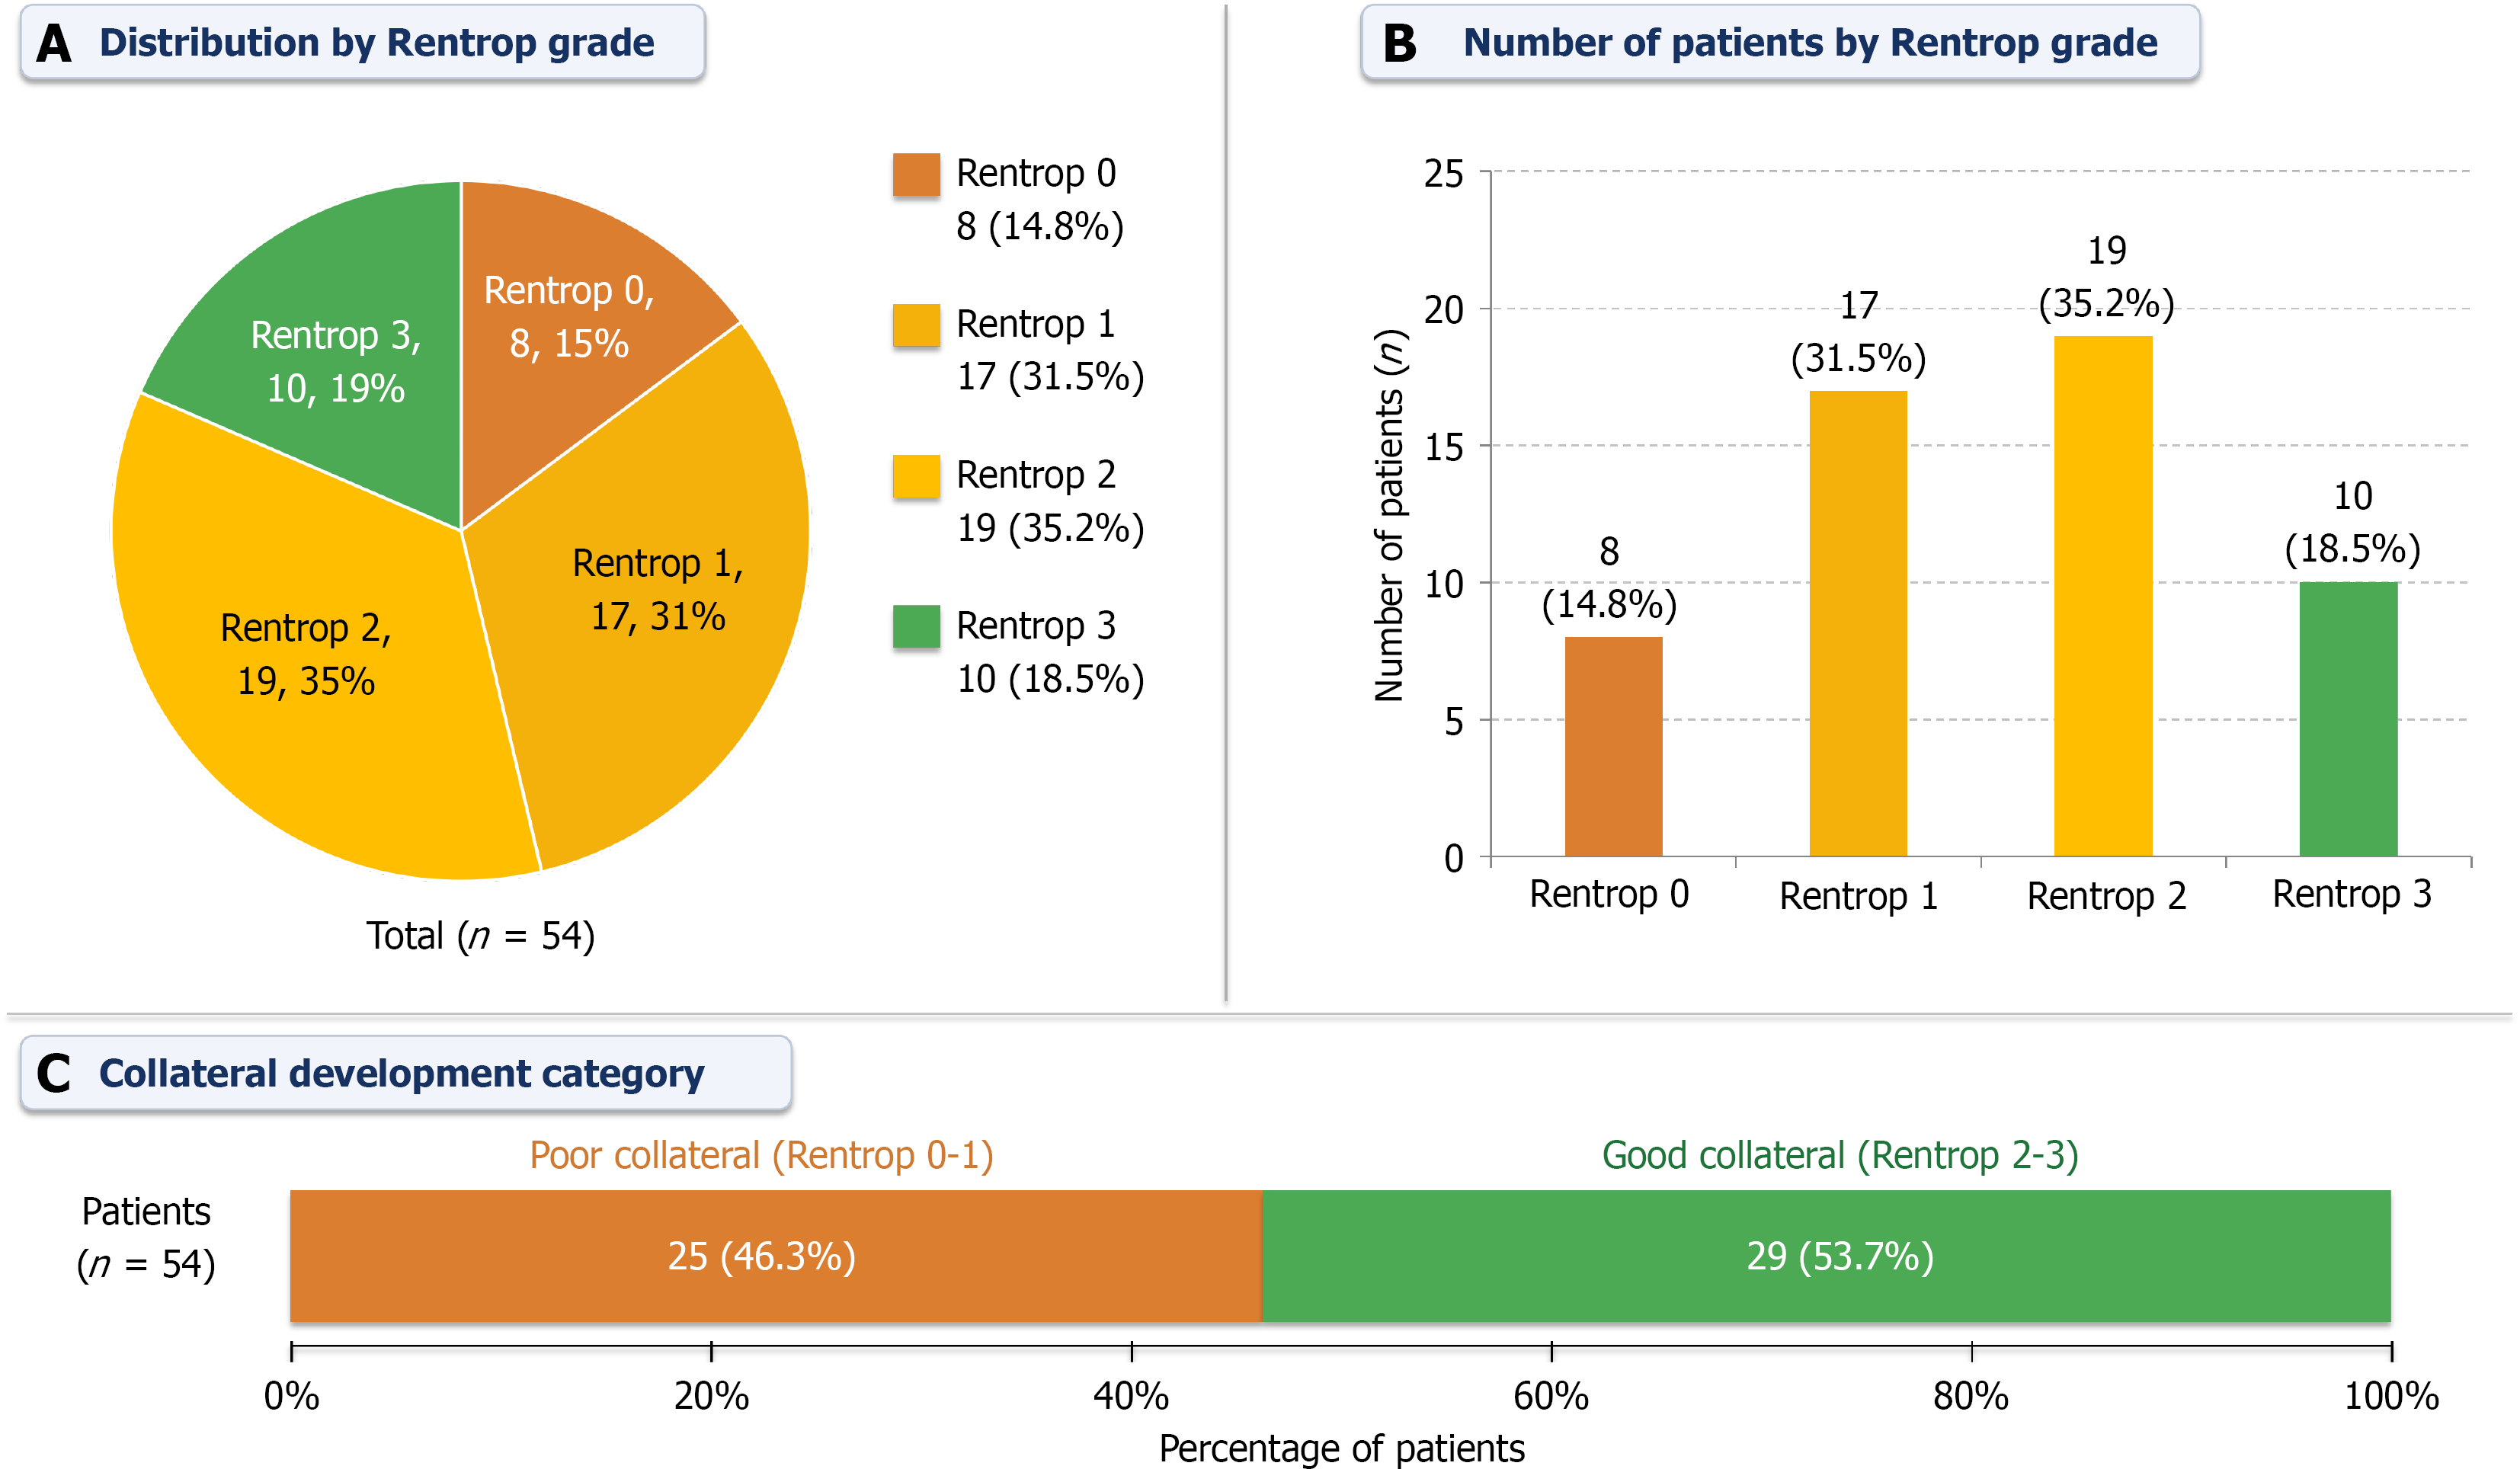
Figure 1 Distribution of coronary collateral grades in patients with chronic total occlusion.
A: Proportional distribution of Rentrop collateral grades; B: Number and percentage of patients in each Rentrop category; C: Classification of collateral circulation into poor collateralization (Rentrop 0-1) and good collateralization (Rentrop 2-3).
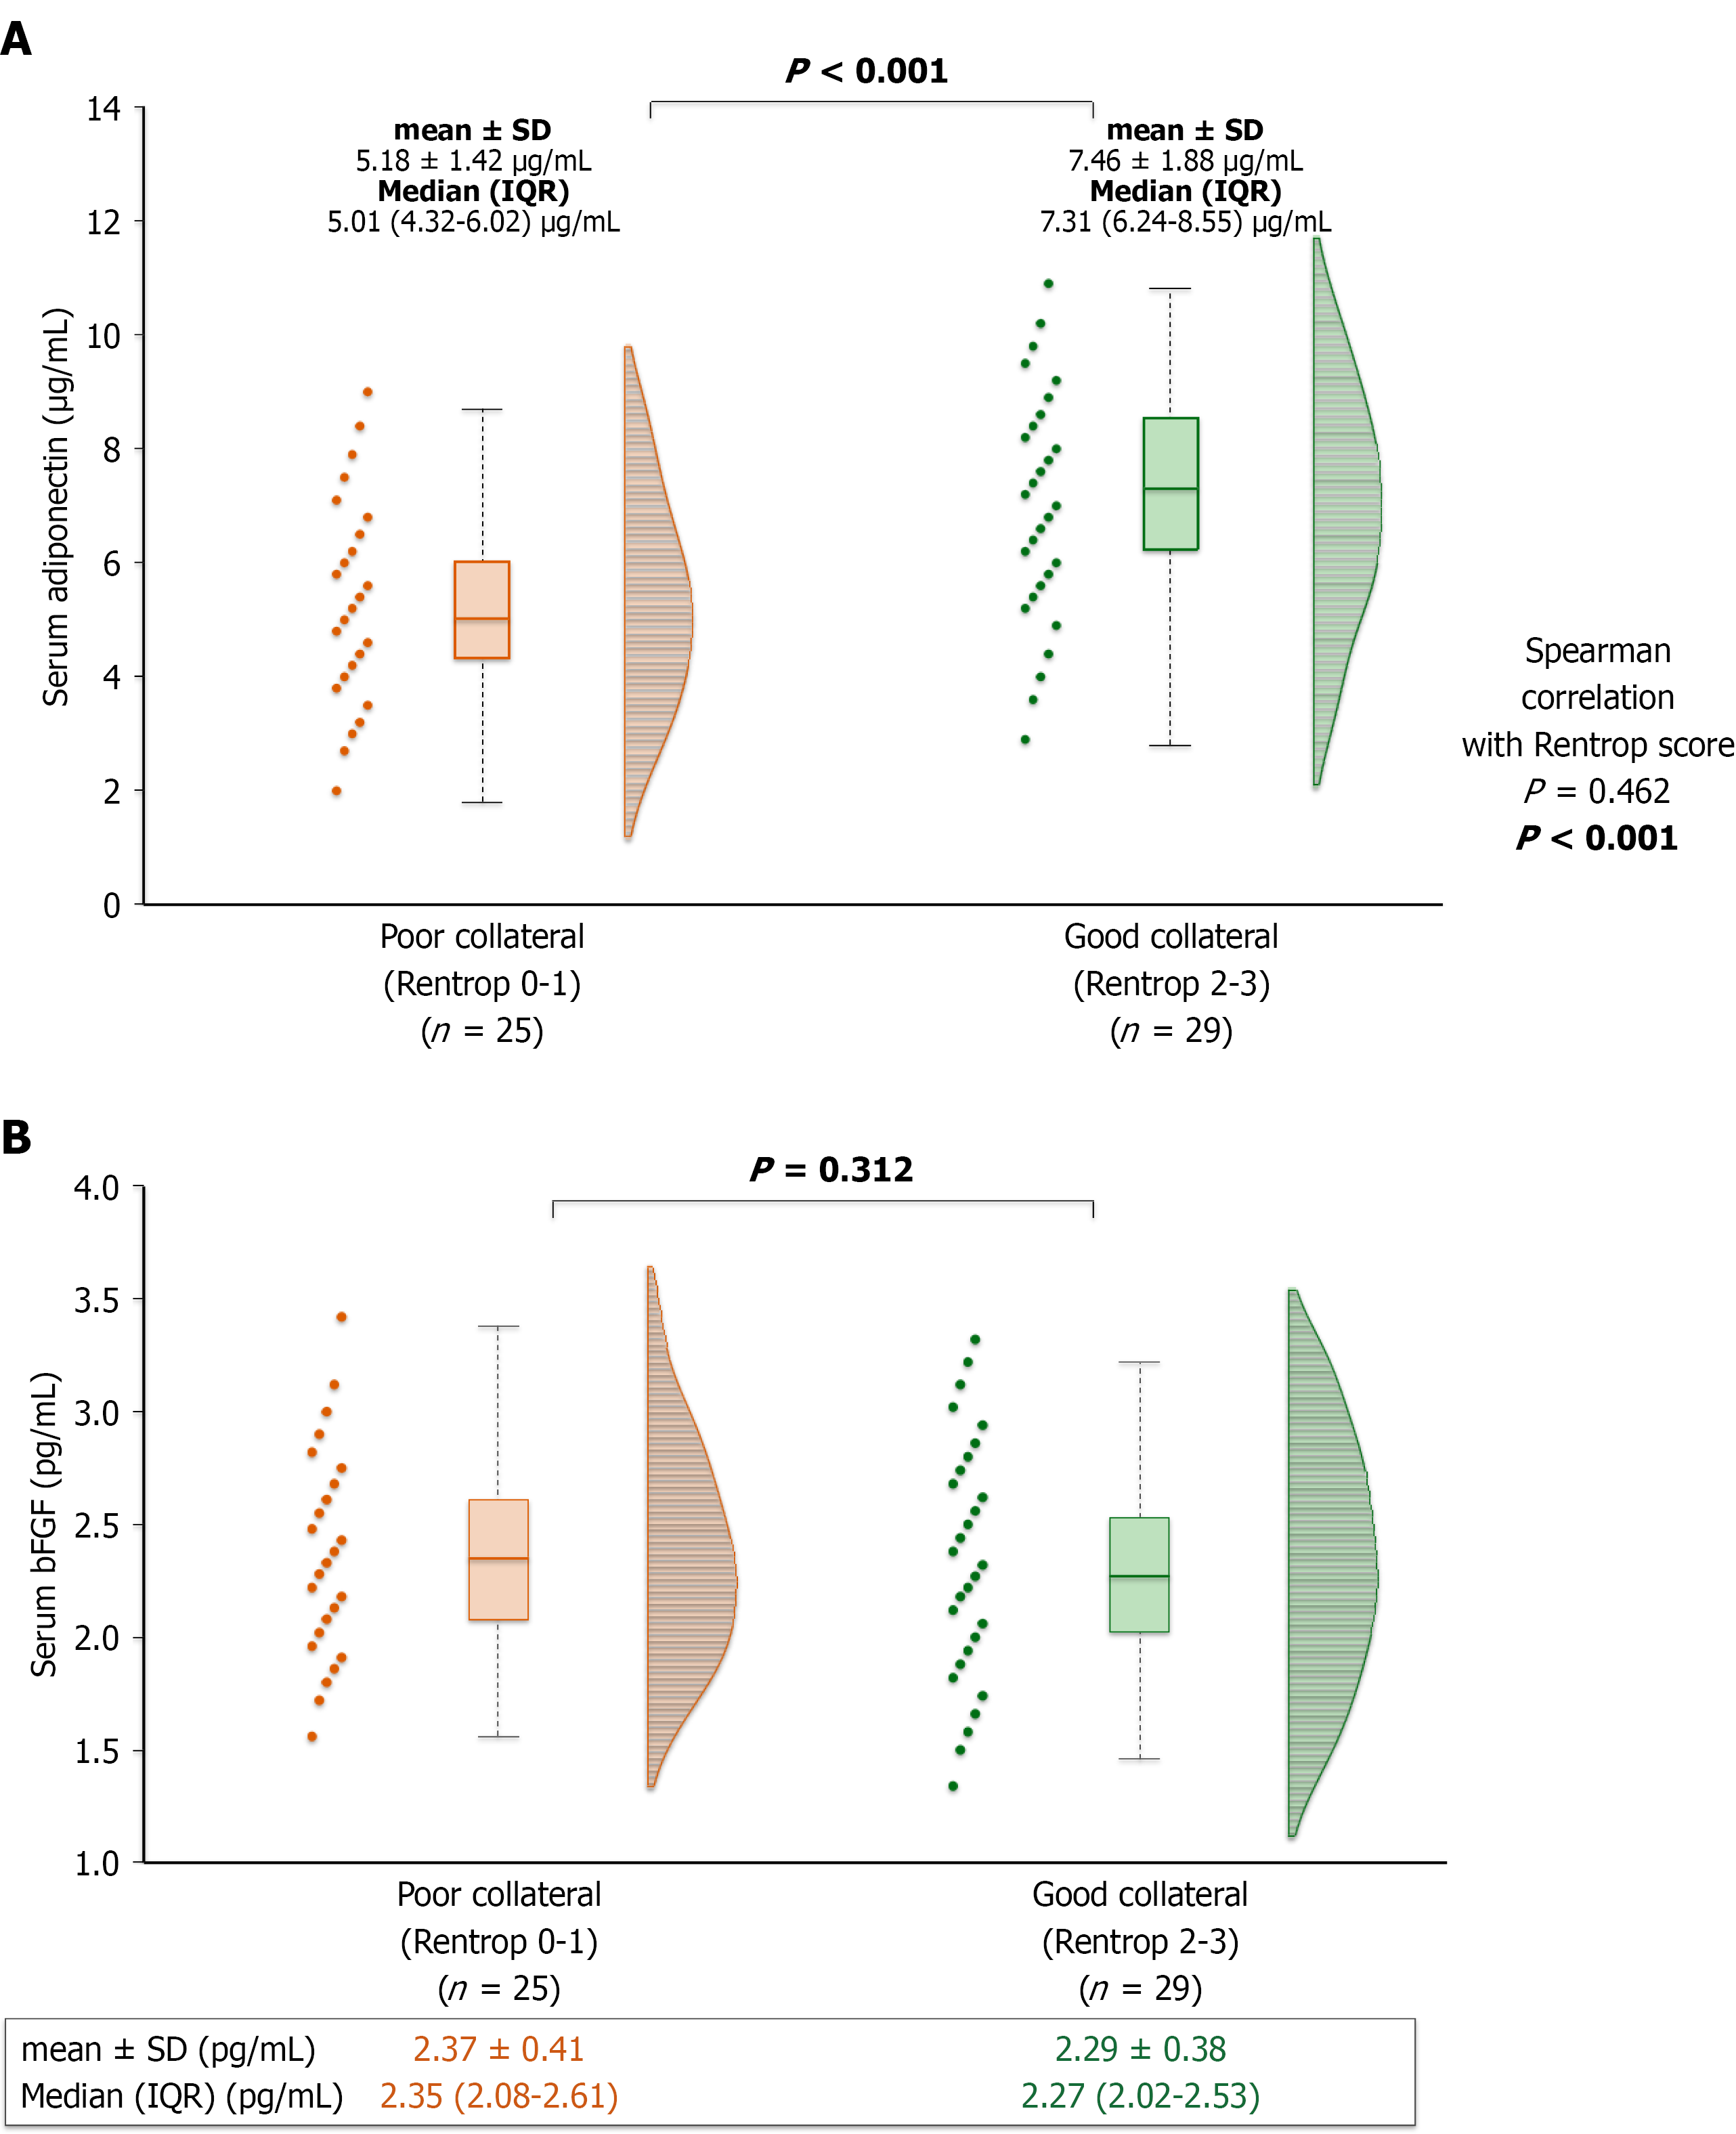
Figure 2 Serum adiponectin levels and basic fibroblast growth factor levels according to coronary collateral development in patients with chronic total occlusion.
A: Adiponectin levels; B: Basic fibroblast growth factor levels. IQR: Interquartile range; bFGF: Basic fibroblast growth factor.
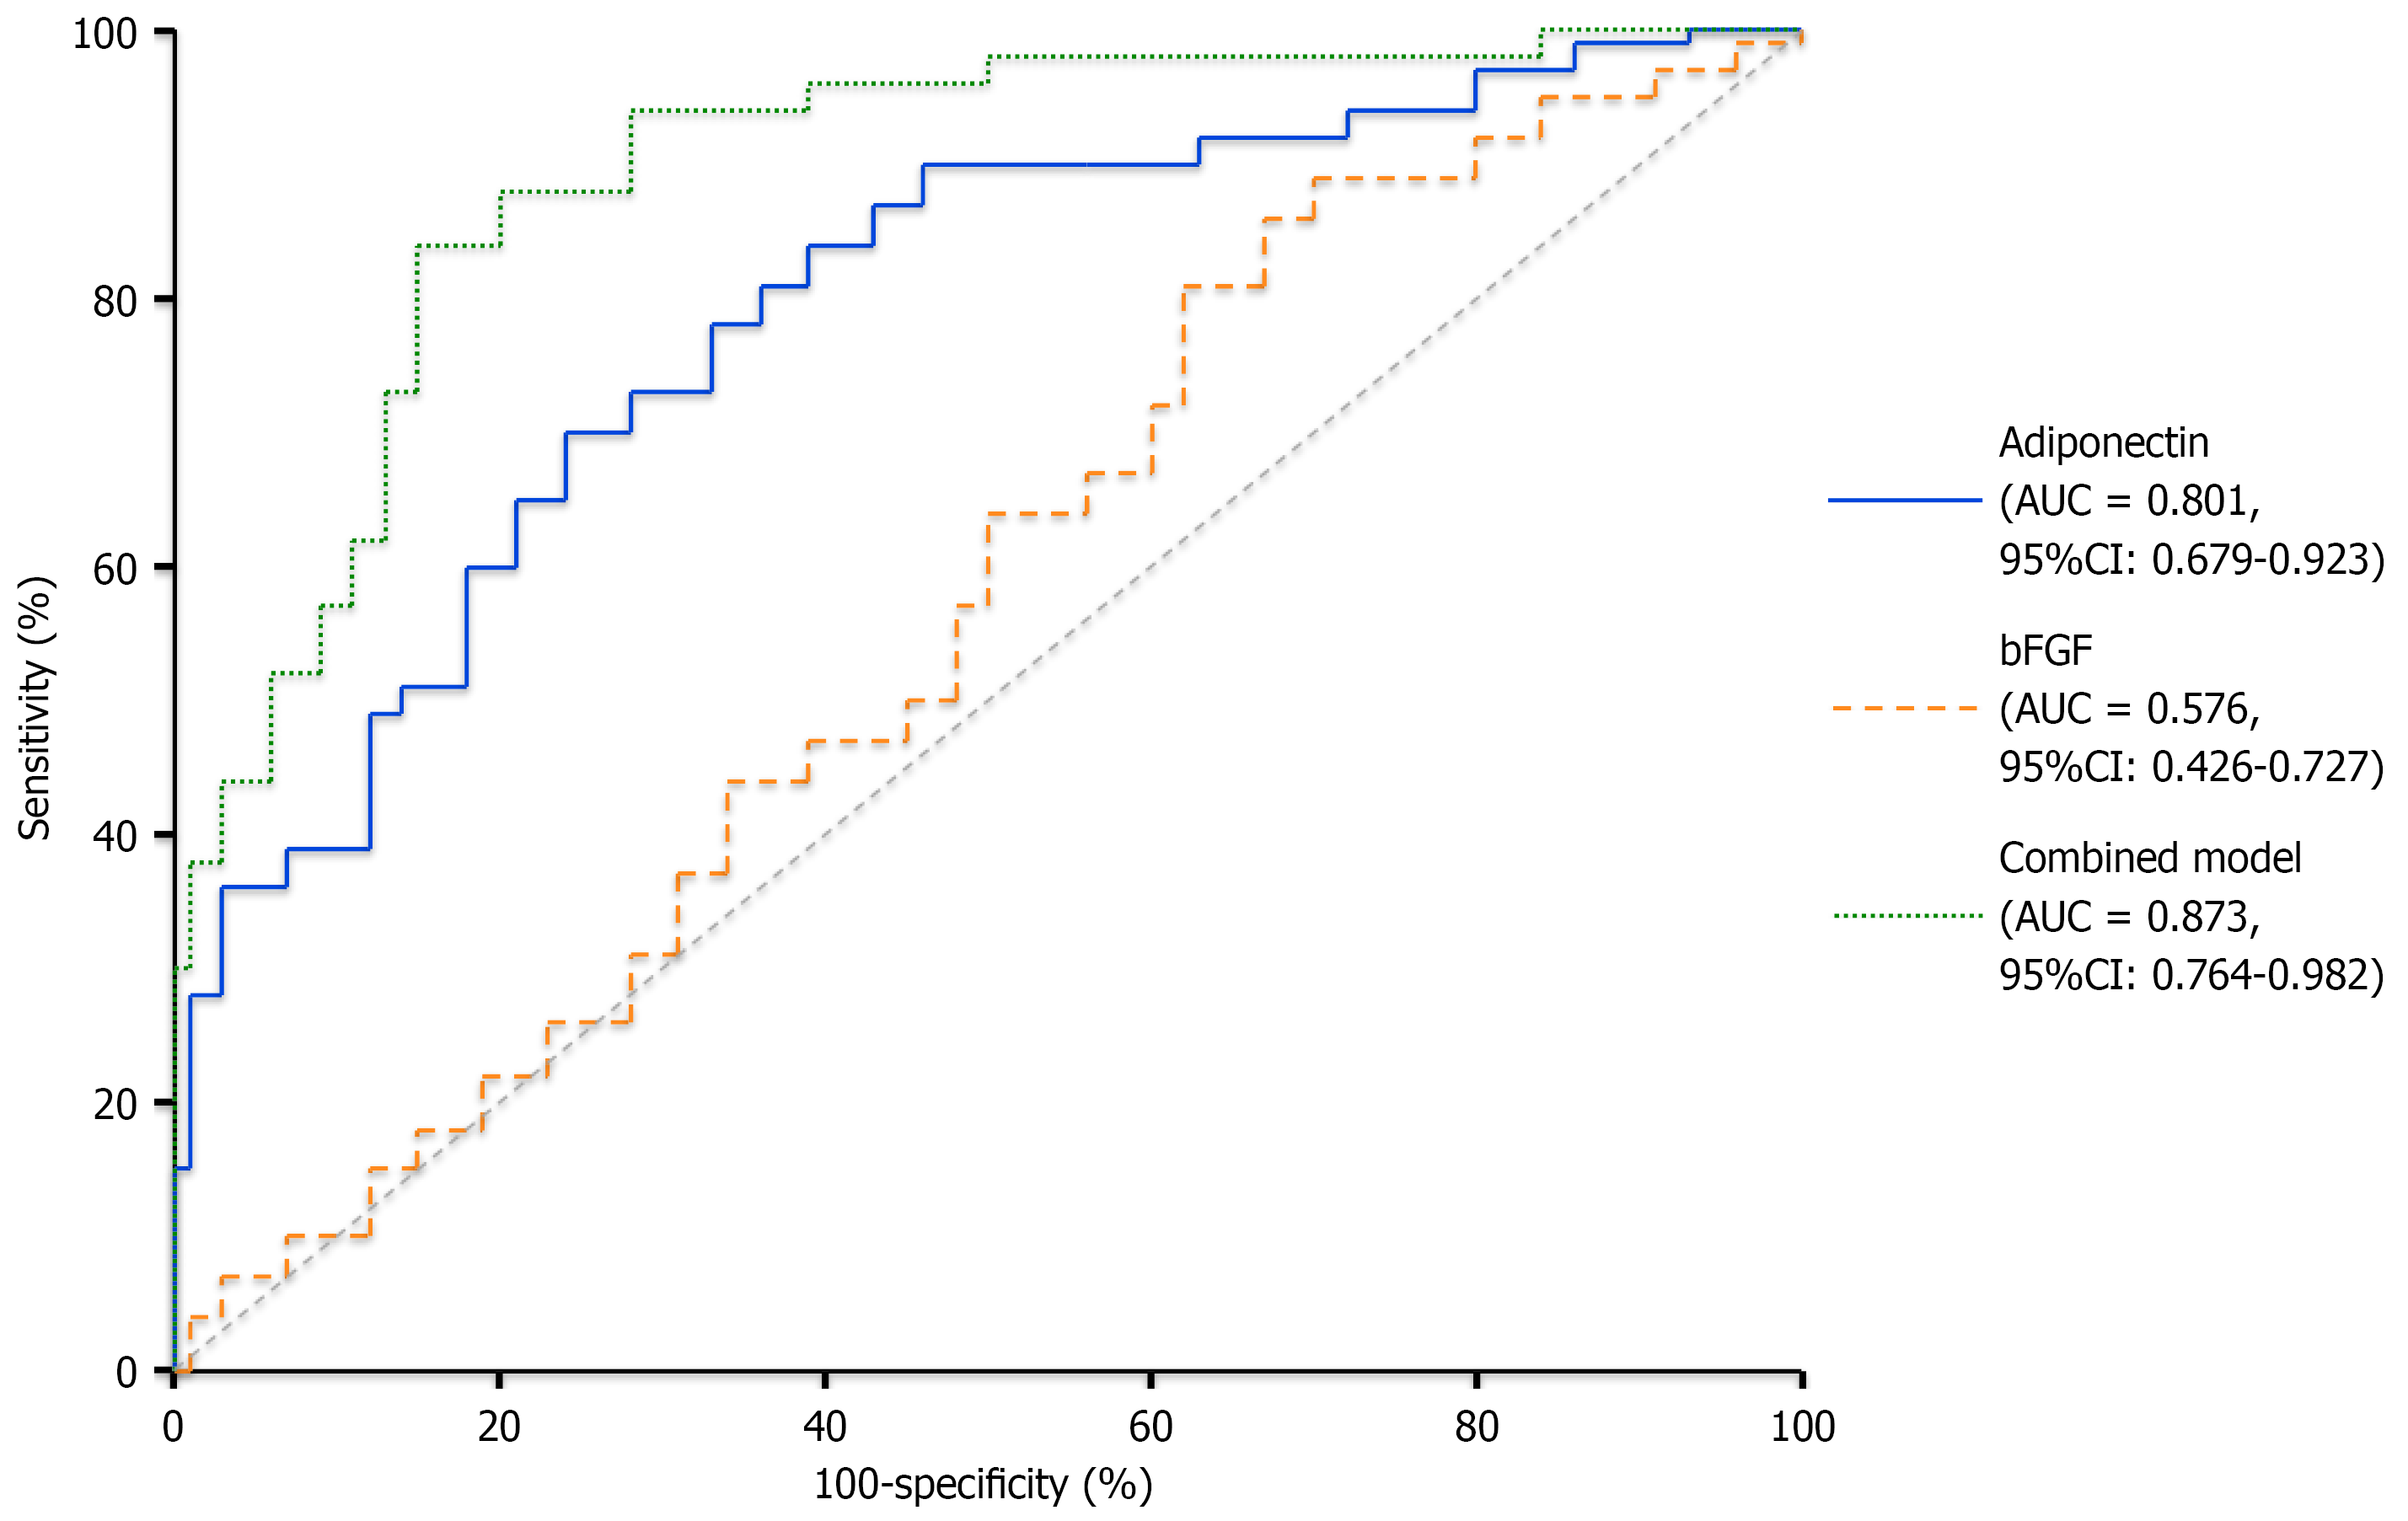
Figure 3 Receiver operating characteristic analysis of adiponectin and basic fibroblast growth factor for predicting good coronary collateral development.
AUC: Area under the curve; CI: Confidence interval.
- Citation: Gani A, Diah M, Riswan M, Muwardi, Heriadi. Adiponectin and basic fibroblast growth factor predict coronary collateral development in chronic total occlusion. World J Cardiol 2026; 18(9): 124634
- URL: https://www.wjgnet.com/1949-8462/full/v18/i9/124634.htm
- DOI: https://dx.doi.org/10.4330/wjc.124634