Copyright
©The Author(s) 2025.
World J Cardiol. Aug 26, 2025; 17(8): 110366
Published online Aug 26, 2025. doi: 10.4330/wjc.v17.i8.110366
Published online Aug 26, 2025. doi: 10.4330/wjc.v17.i8.110366
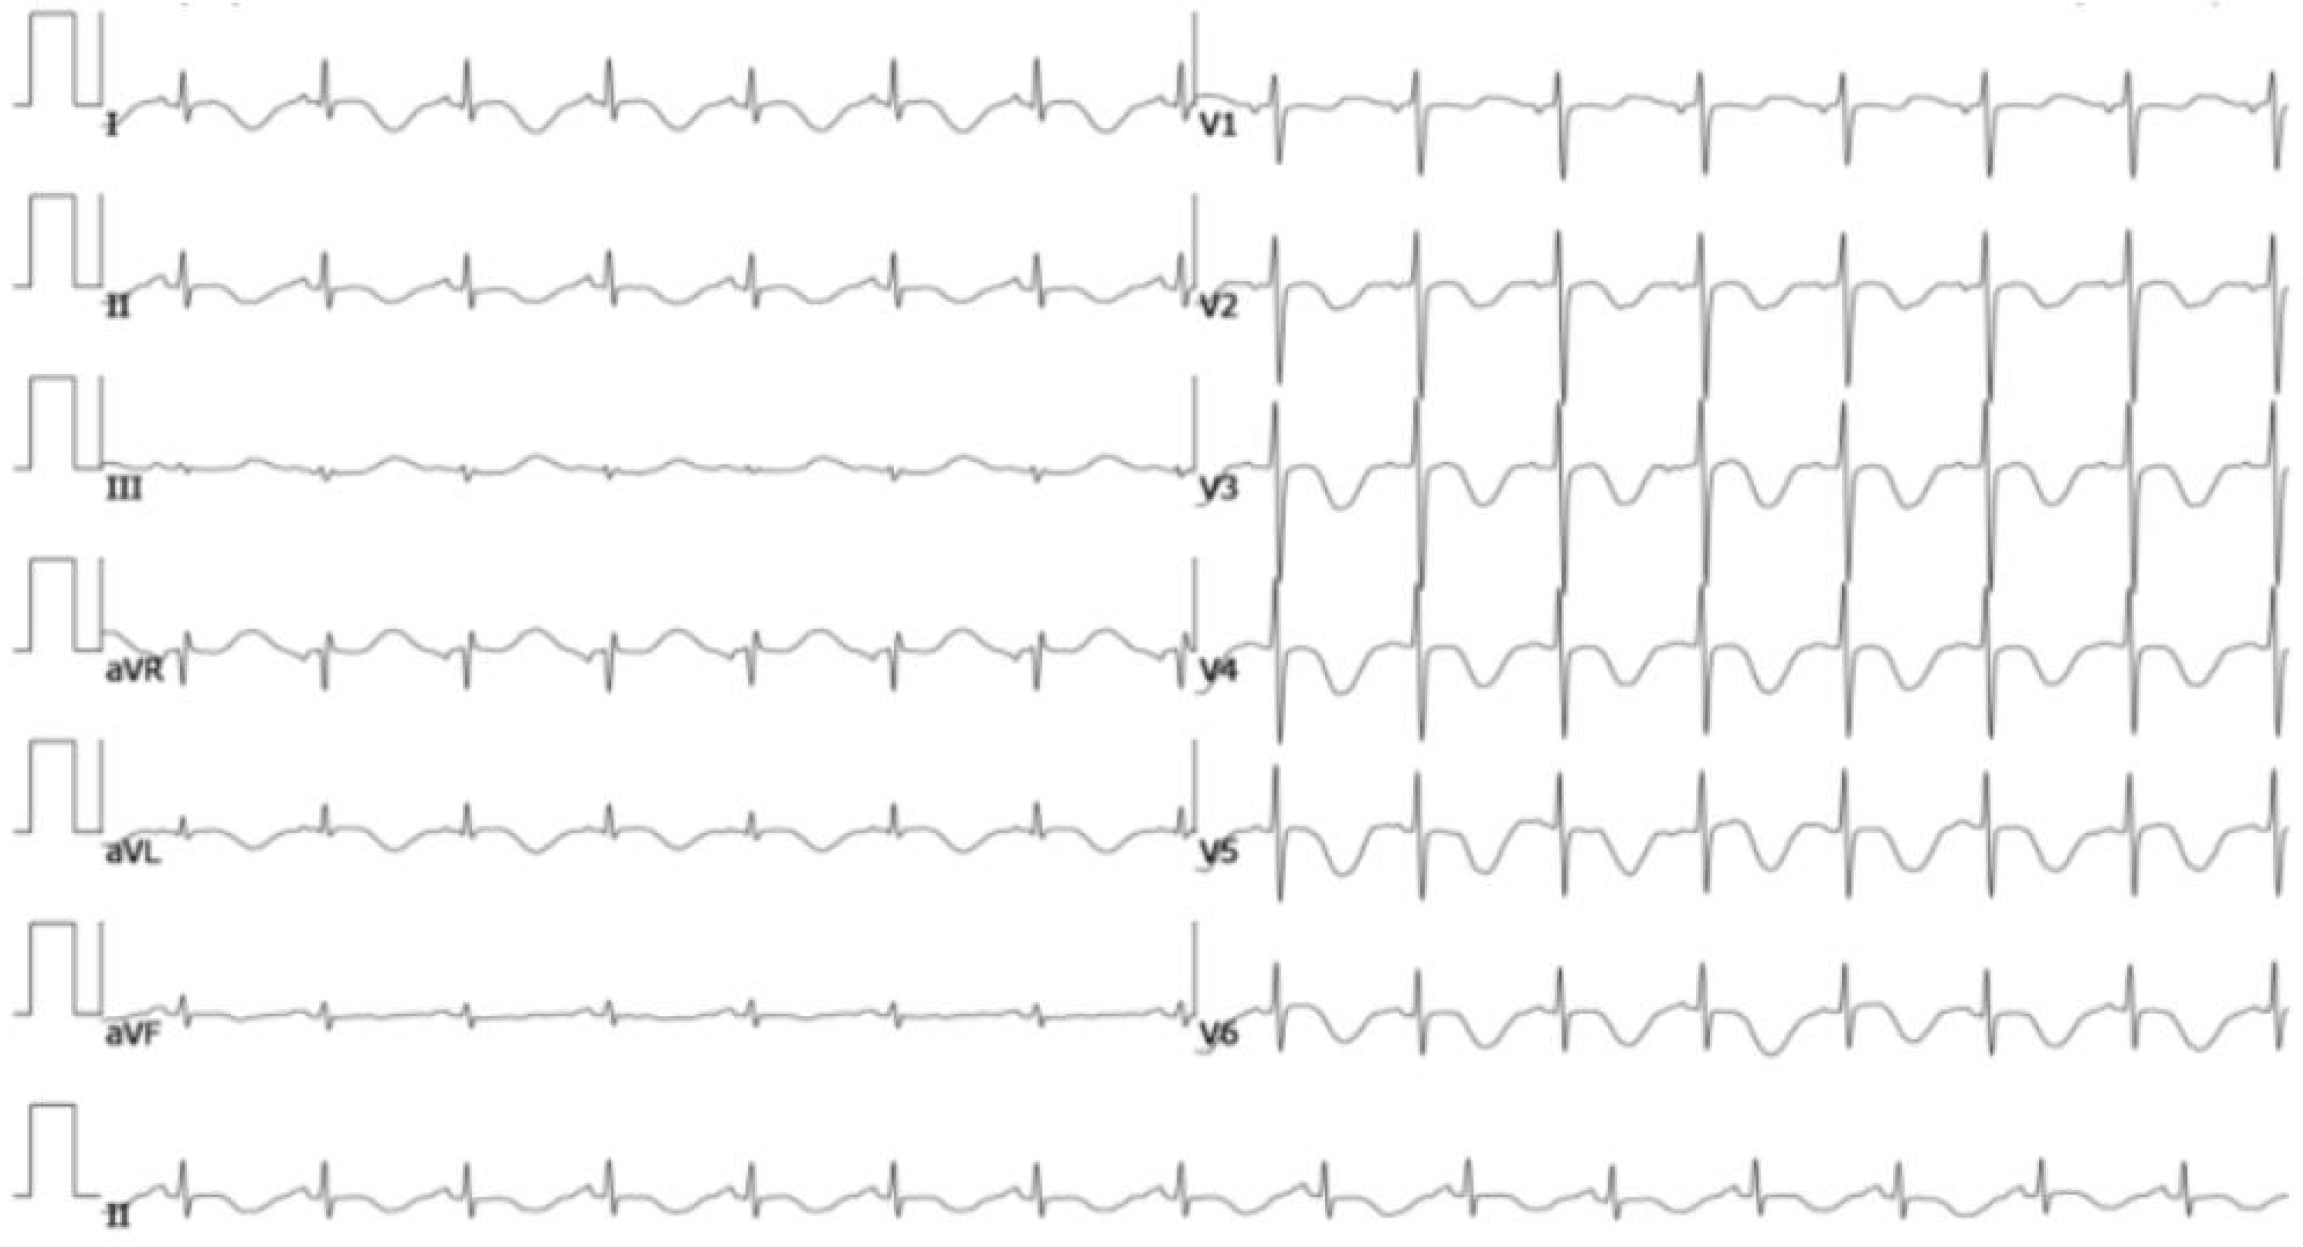
Figure 1
Electrocardiograph showed sinus tachycardia, T wave changing, and prolonged QT interval.
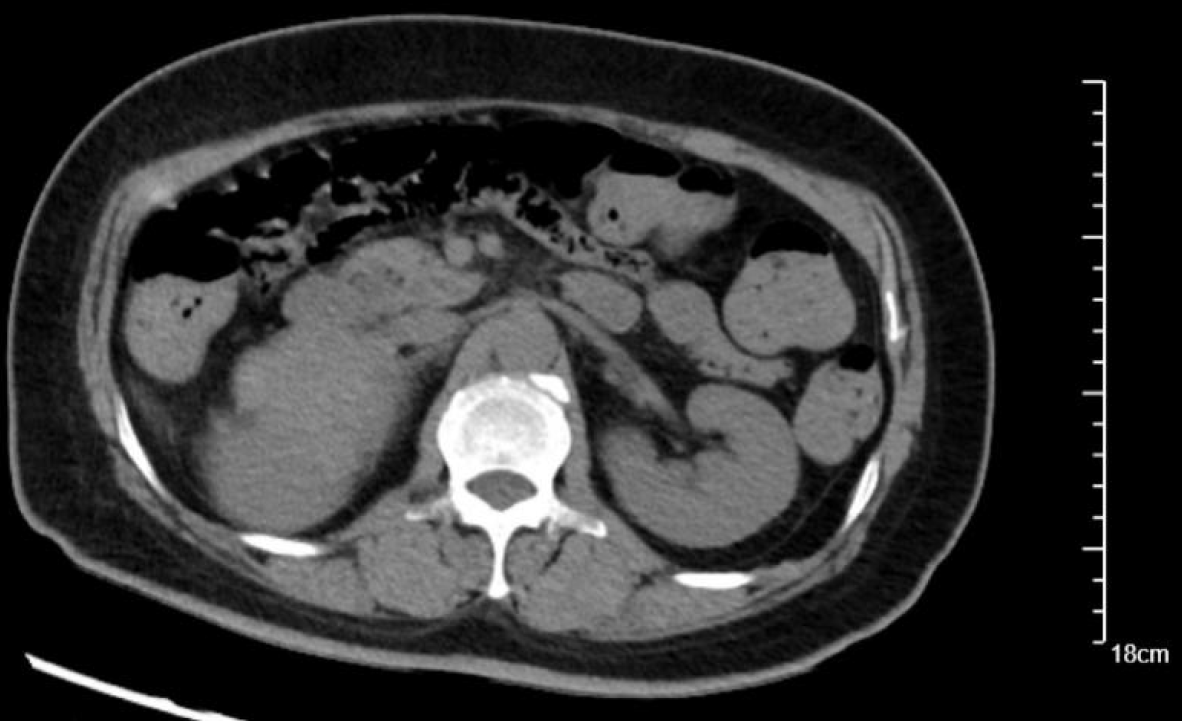
Figure 2
Abdominal enhanced computed tomography scan showing a mixed density 75 mm × 65 mm mass, in the right adrenal gland.
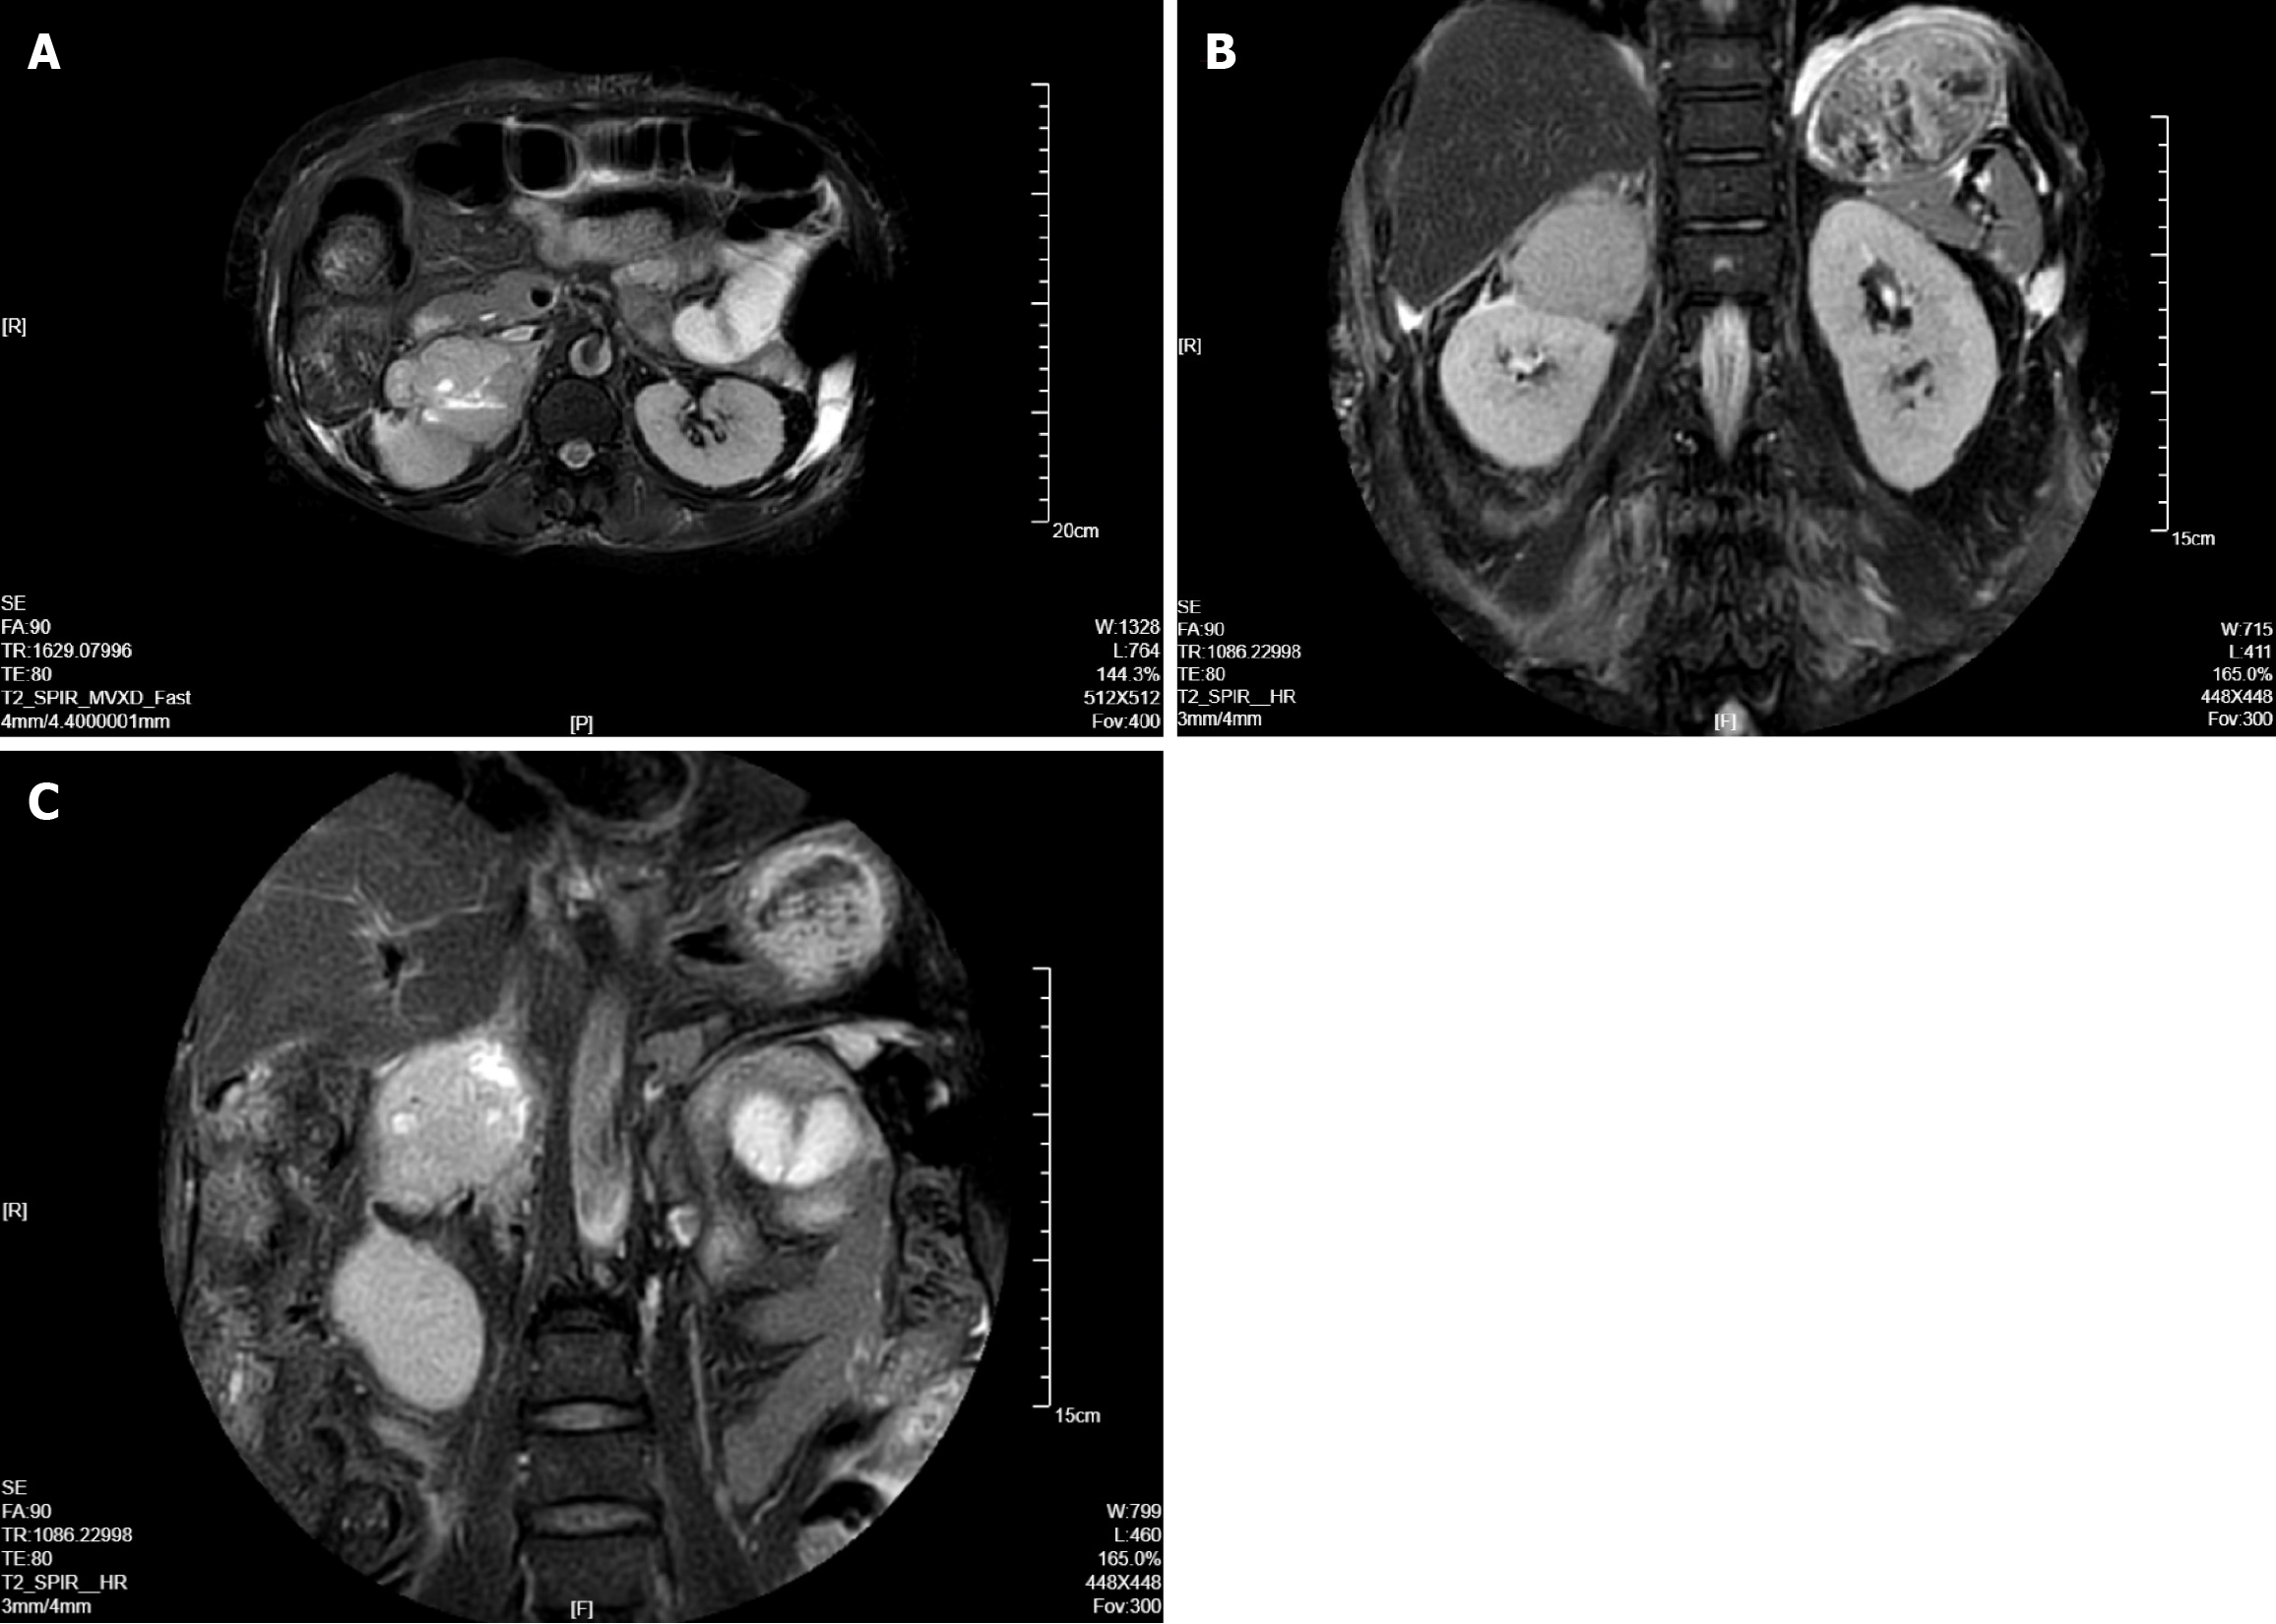
Figure 3 Abdominal magnetic resonance imaging revealing a pheochromocytoma located in the right adrenal gland.
A: Axial; B and C: Coronal.
- Citation: Cheng H, Gu LT, Yang J. Pheochromocytoma presenting with vomiting and heart failure: A case report. World J Cardiol 2025; 17(8): 110366
- URL: https://www.wjgnet.com/1949-8462/full/v17/i8/110366.htm
- DOI: https://dx.doi.org/10.4330/wjc.v17.i8.110366


