Copyright
©The Author(s) 2021.
World J Cardiol. Sep 26, 2021; 13(9): 514-525
Published online Sep 26, 2021. doi: 10.4330/wjc.v13.i9.514
Published online Sep 26, 2021. doi: 10.4330/wjc.v13.i9.514
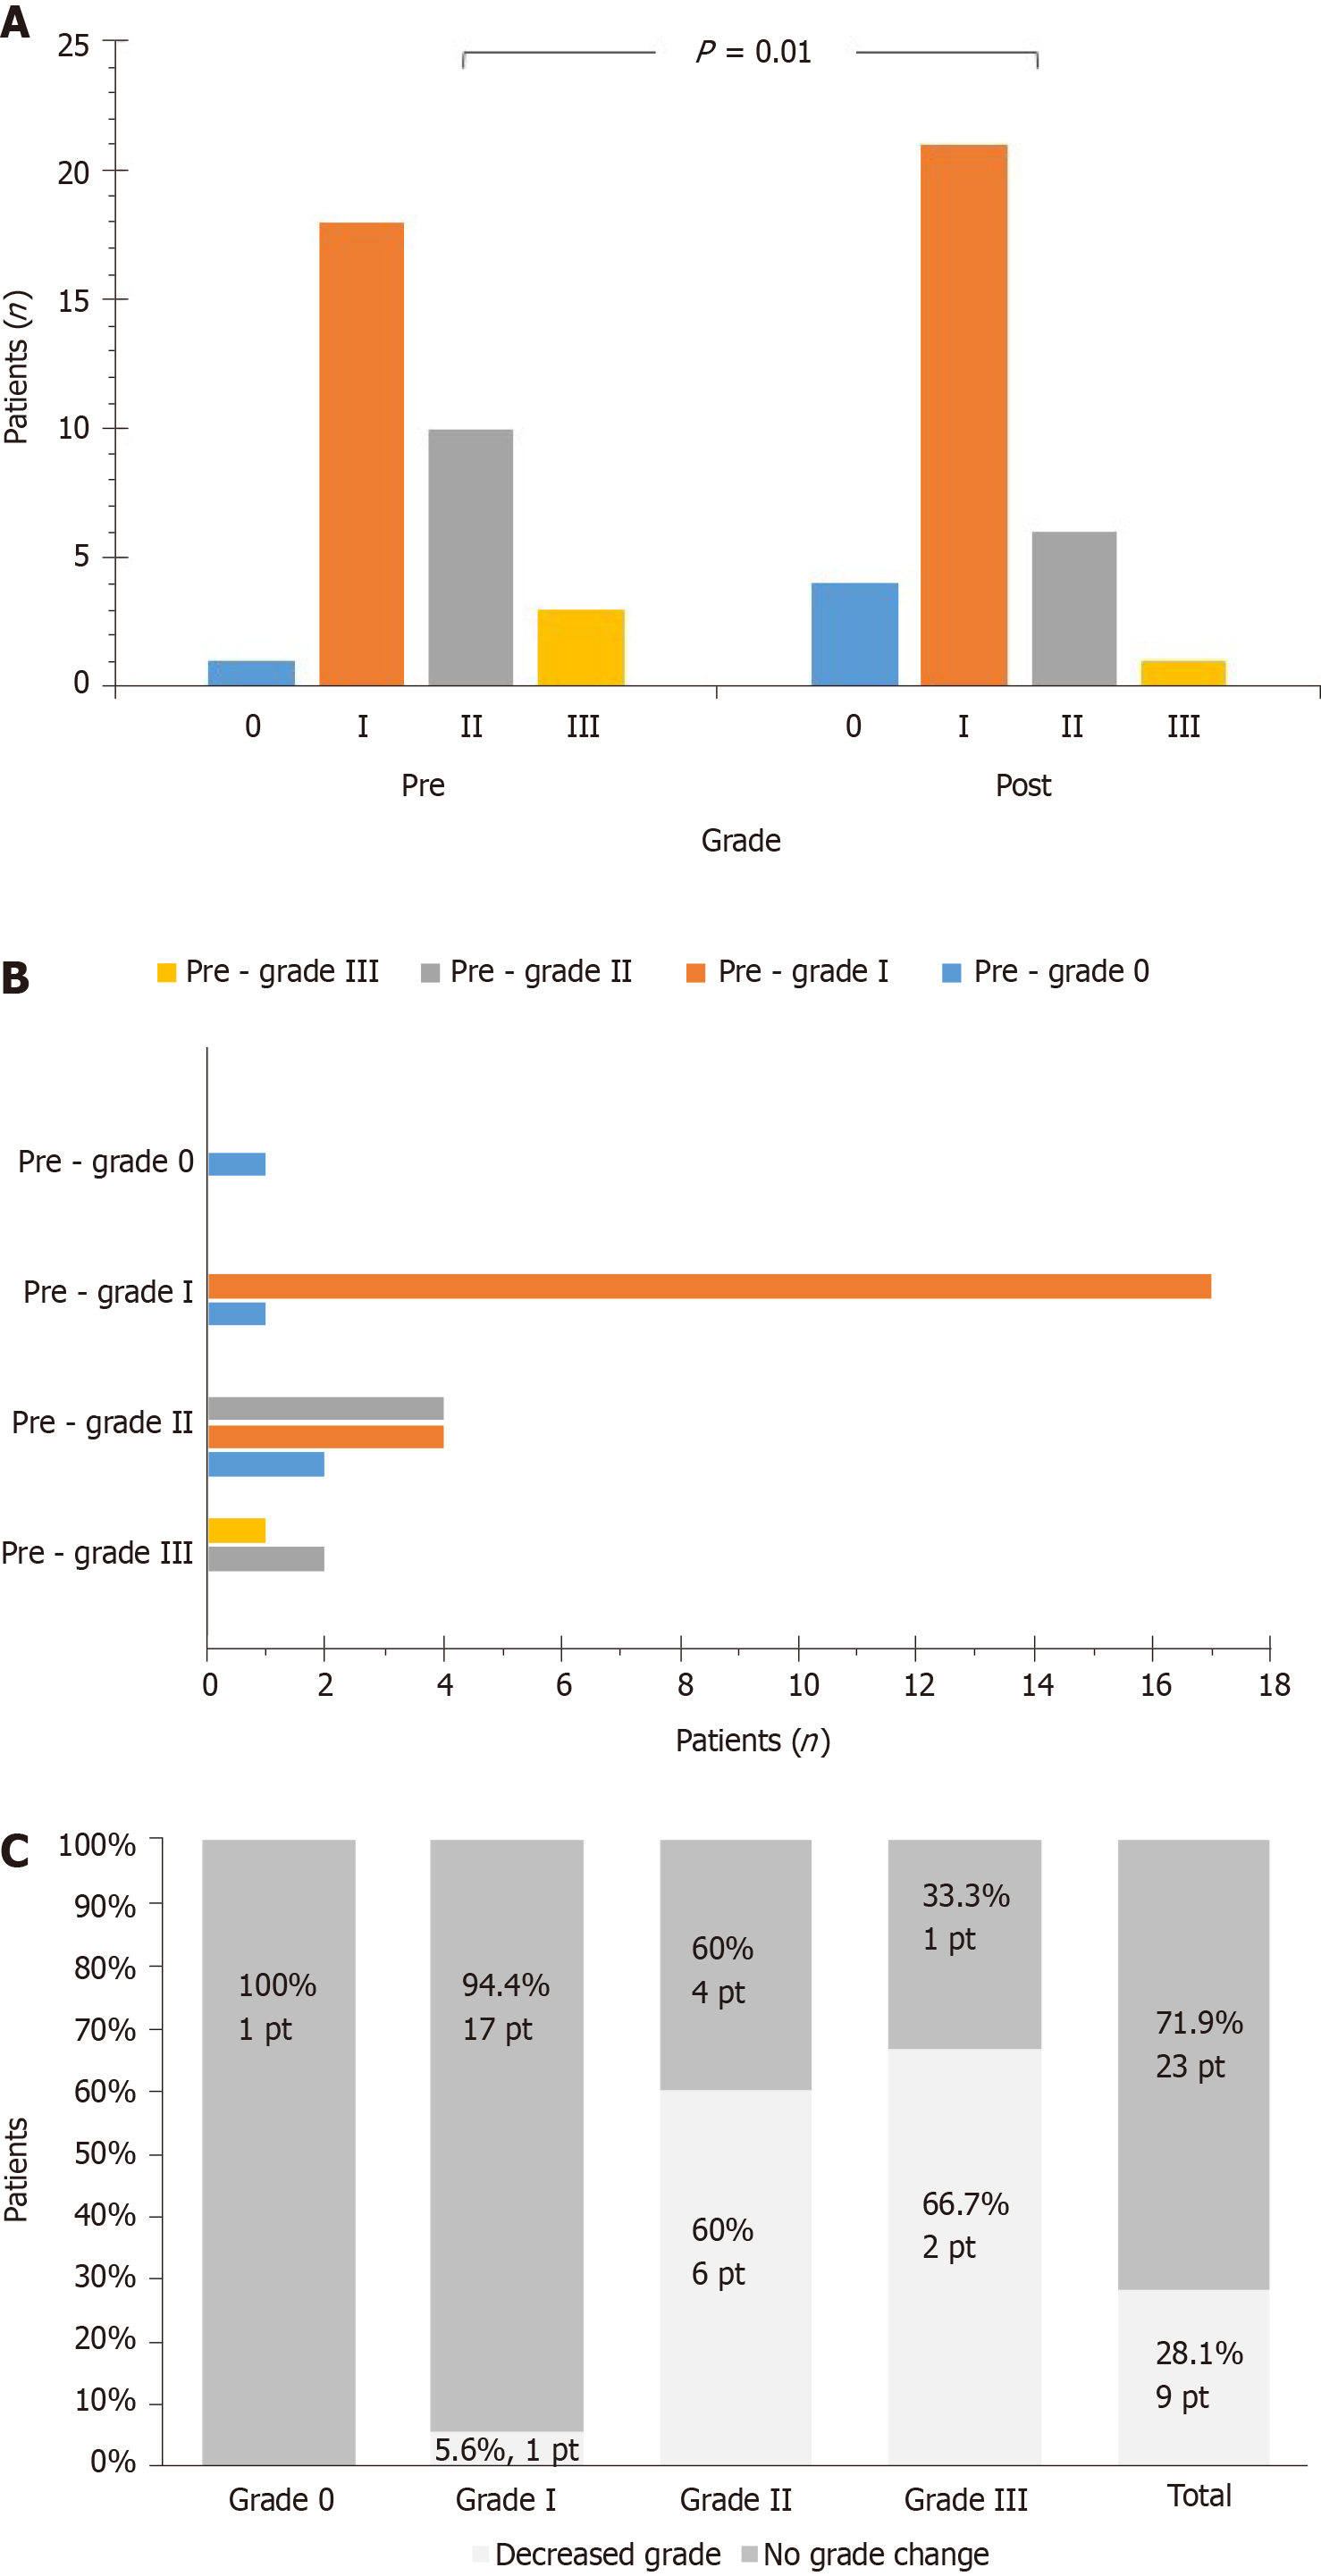
Figure 1 Changes in diastolic dysfunction grades.
A: Pre- and post-number of grade-0, -I, -II, -III patients (P = 0.01, as assessed with Wilcoxon signed-rank test); B: Patients’ distribution according to pre- and post-level of grade (P = -0.06, as analyzed with McNemar-Bowker test); C: Number of patients that decreased grade or remained at the same grade in relation to baseline grade (P < 0.01, as assessed with χ2 test).
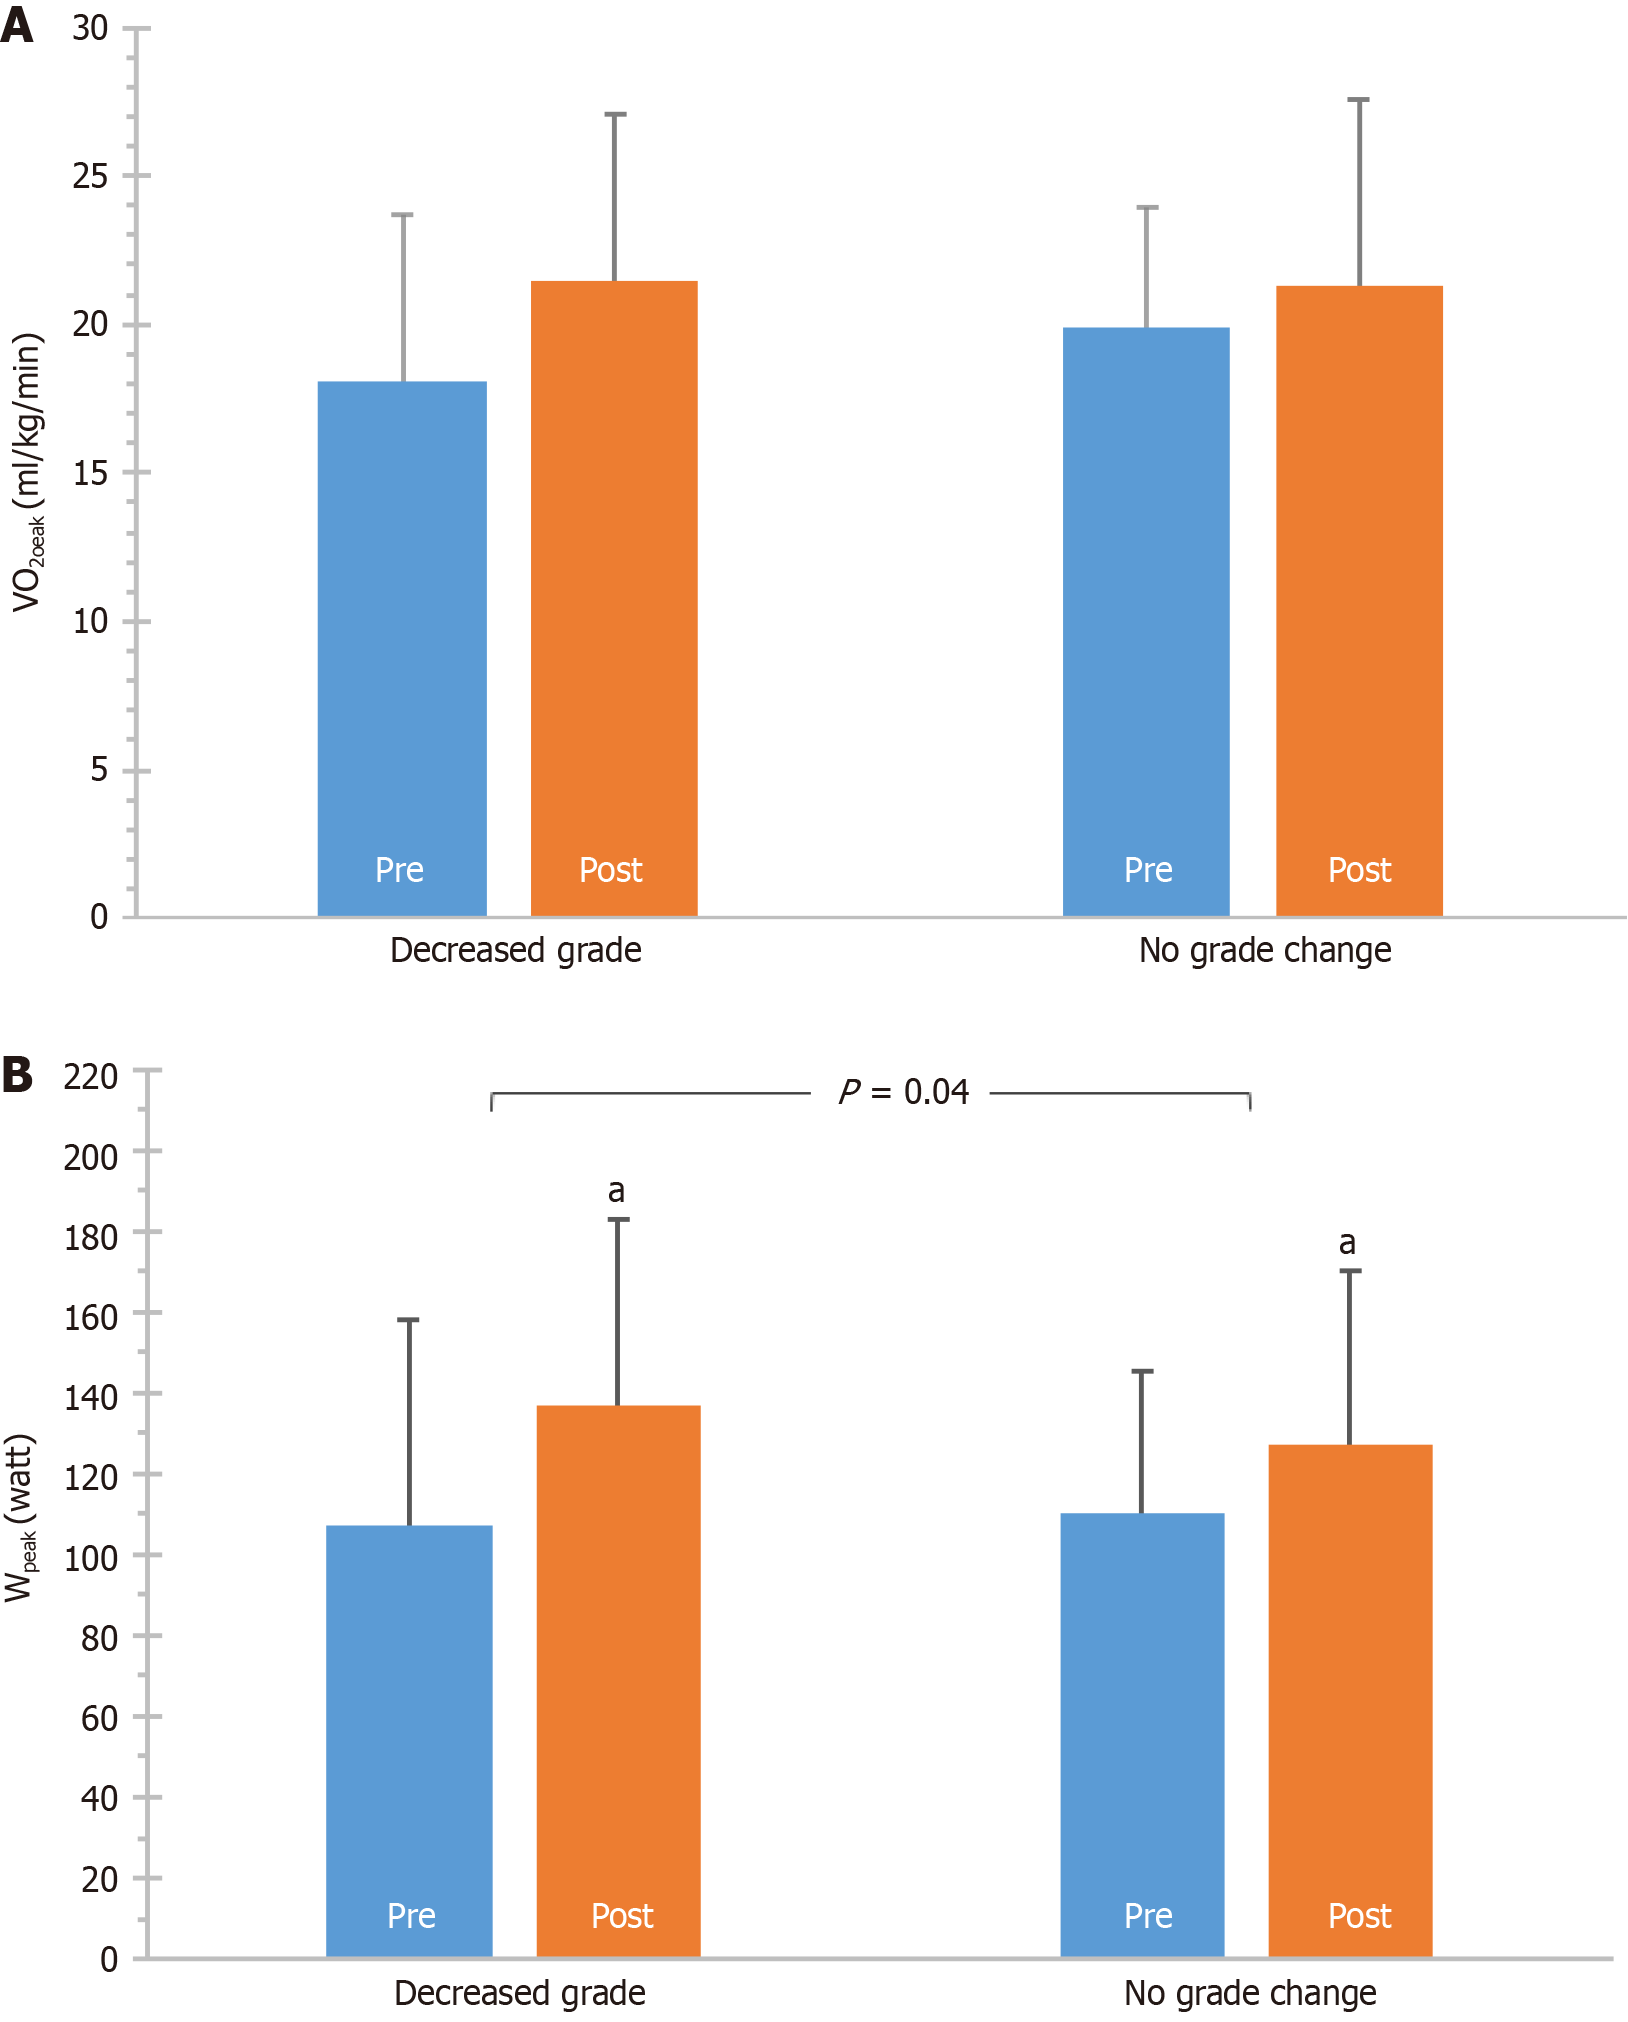
Figure 2 Values of VΟ2peak(A) and Wpeak(B) before and after the program for the groups of patients according to DD grade alteration i.
e. "decreased grade" vs "no grade change". aP < 0.05, significant within-group difference.
- Citation: Chaveles I, Papazachou O, Shamari MA, Delis D, Ntalianis A, Panagopoulou N, Nanas S, Karatzanos E. Effects of exercise training on diastolic and systolic dysfunction in patients with chronic heart failure. World J Cardiol 2021; 13(9): 514-525
- URL: https://www.wjgnet.com/1949-8462/full/v13/i9/514.htm
- DOI: https://dx.doi.org/10.4330/wjc.v13.i9.514


