Copyright
©The Author(s) 2020.
World J Cardiol. Nov 26, 2020; 12(11): 550-558
Published online Nov 26, 2020. doi: 10.4330/wjc.v12.i11.550
Published online Nov 26, 2020. doi: 10.4330/wjc.v12.i11.550
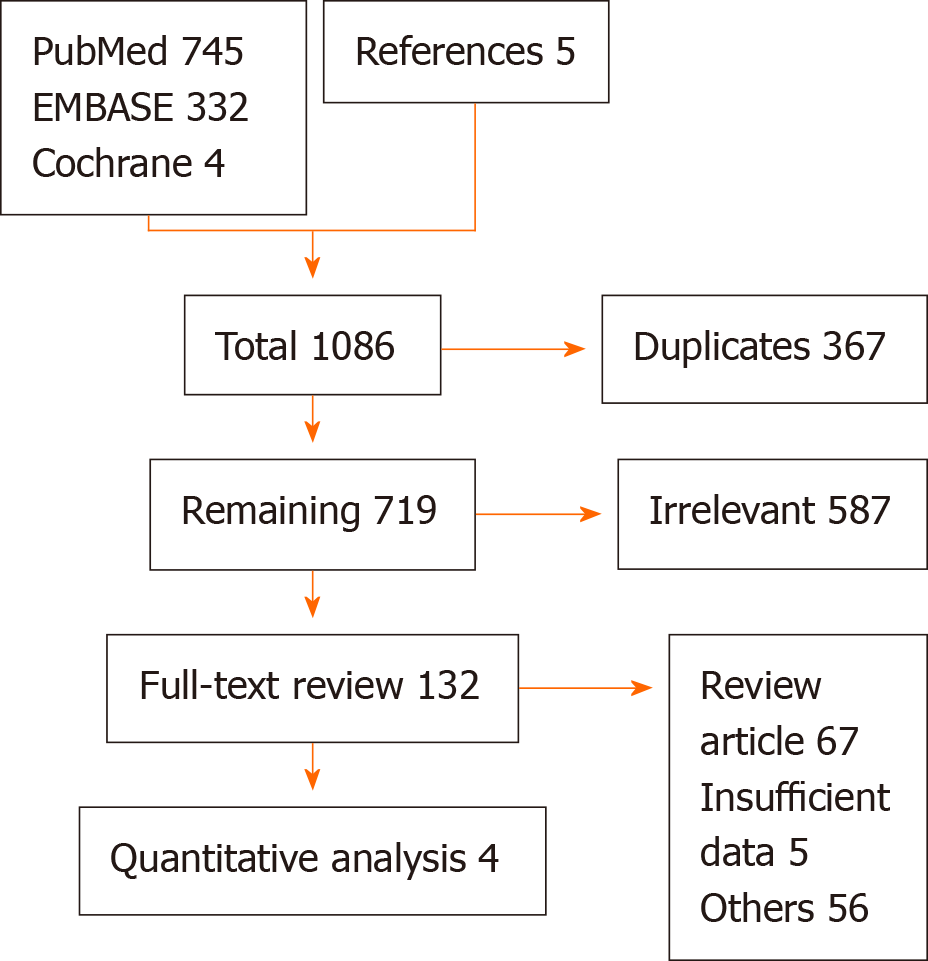
Figure 1 PRISMA flow diagram of the included studies.
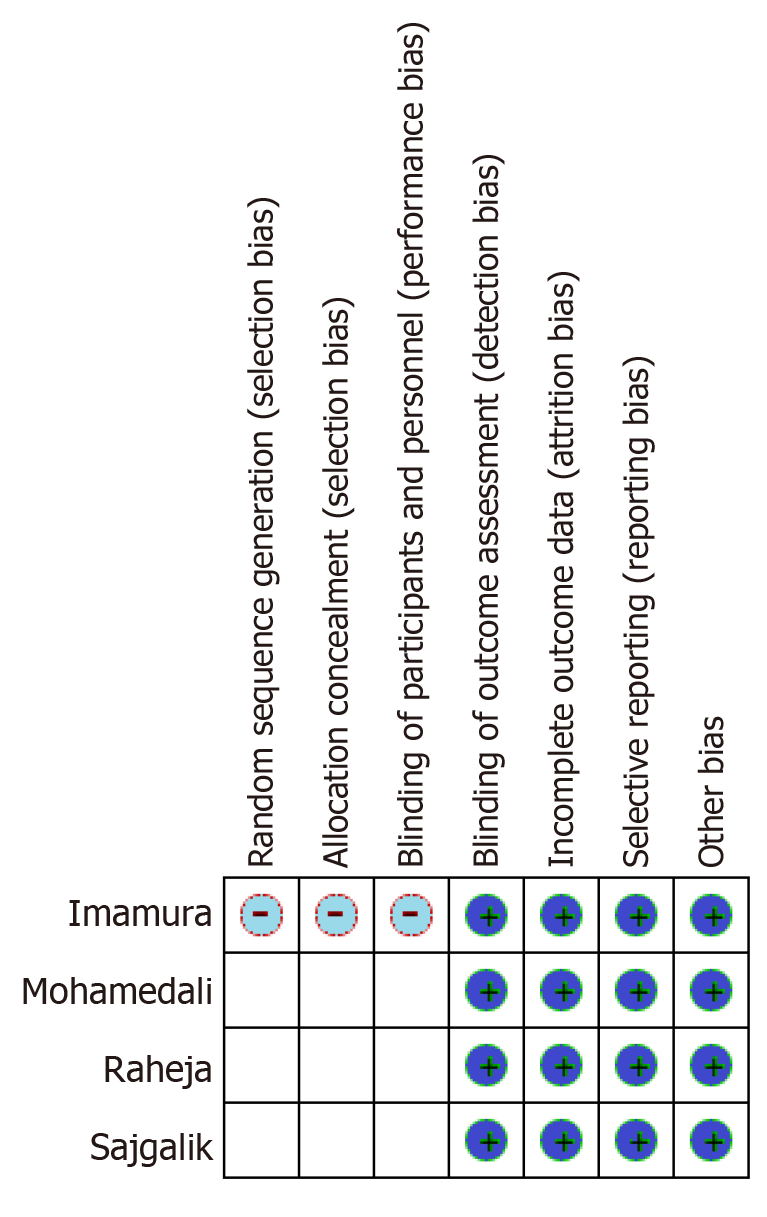
Figure 2 Detailed methodological quality and bias assessment of included studies.
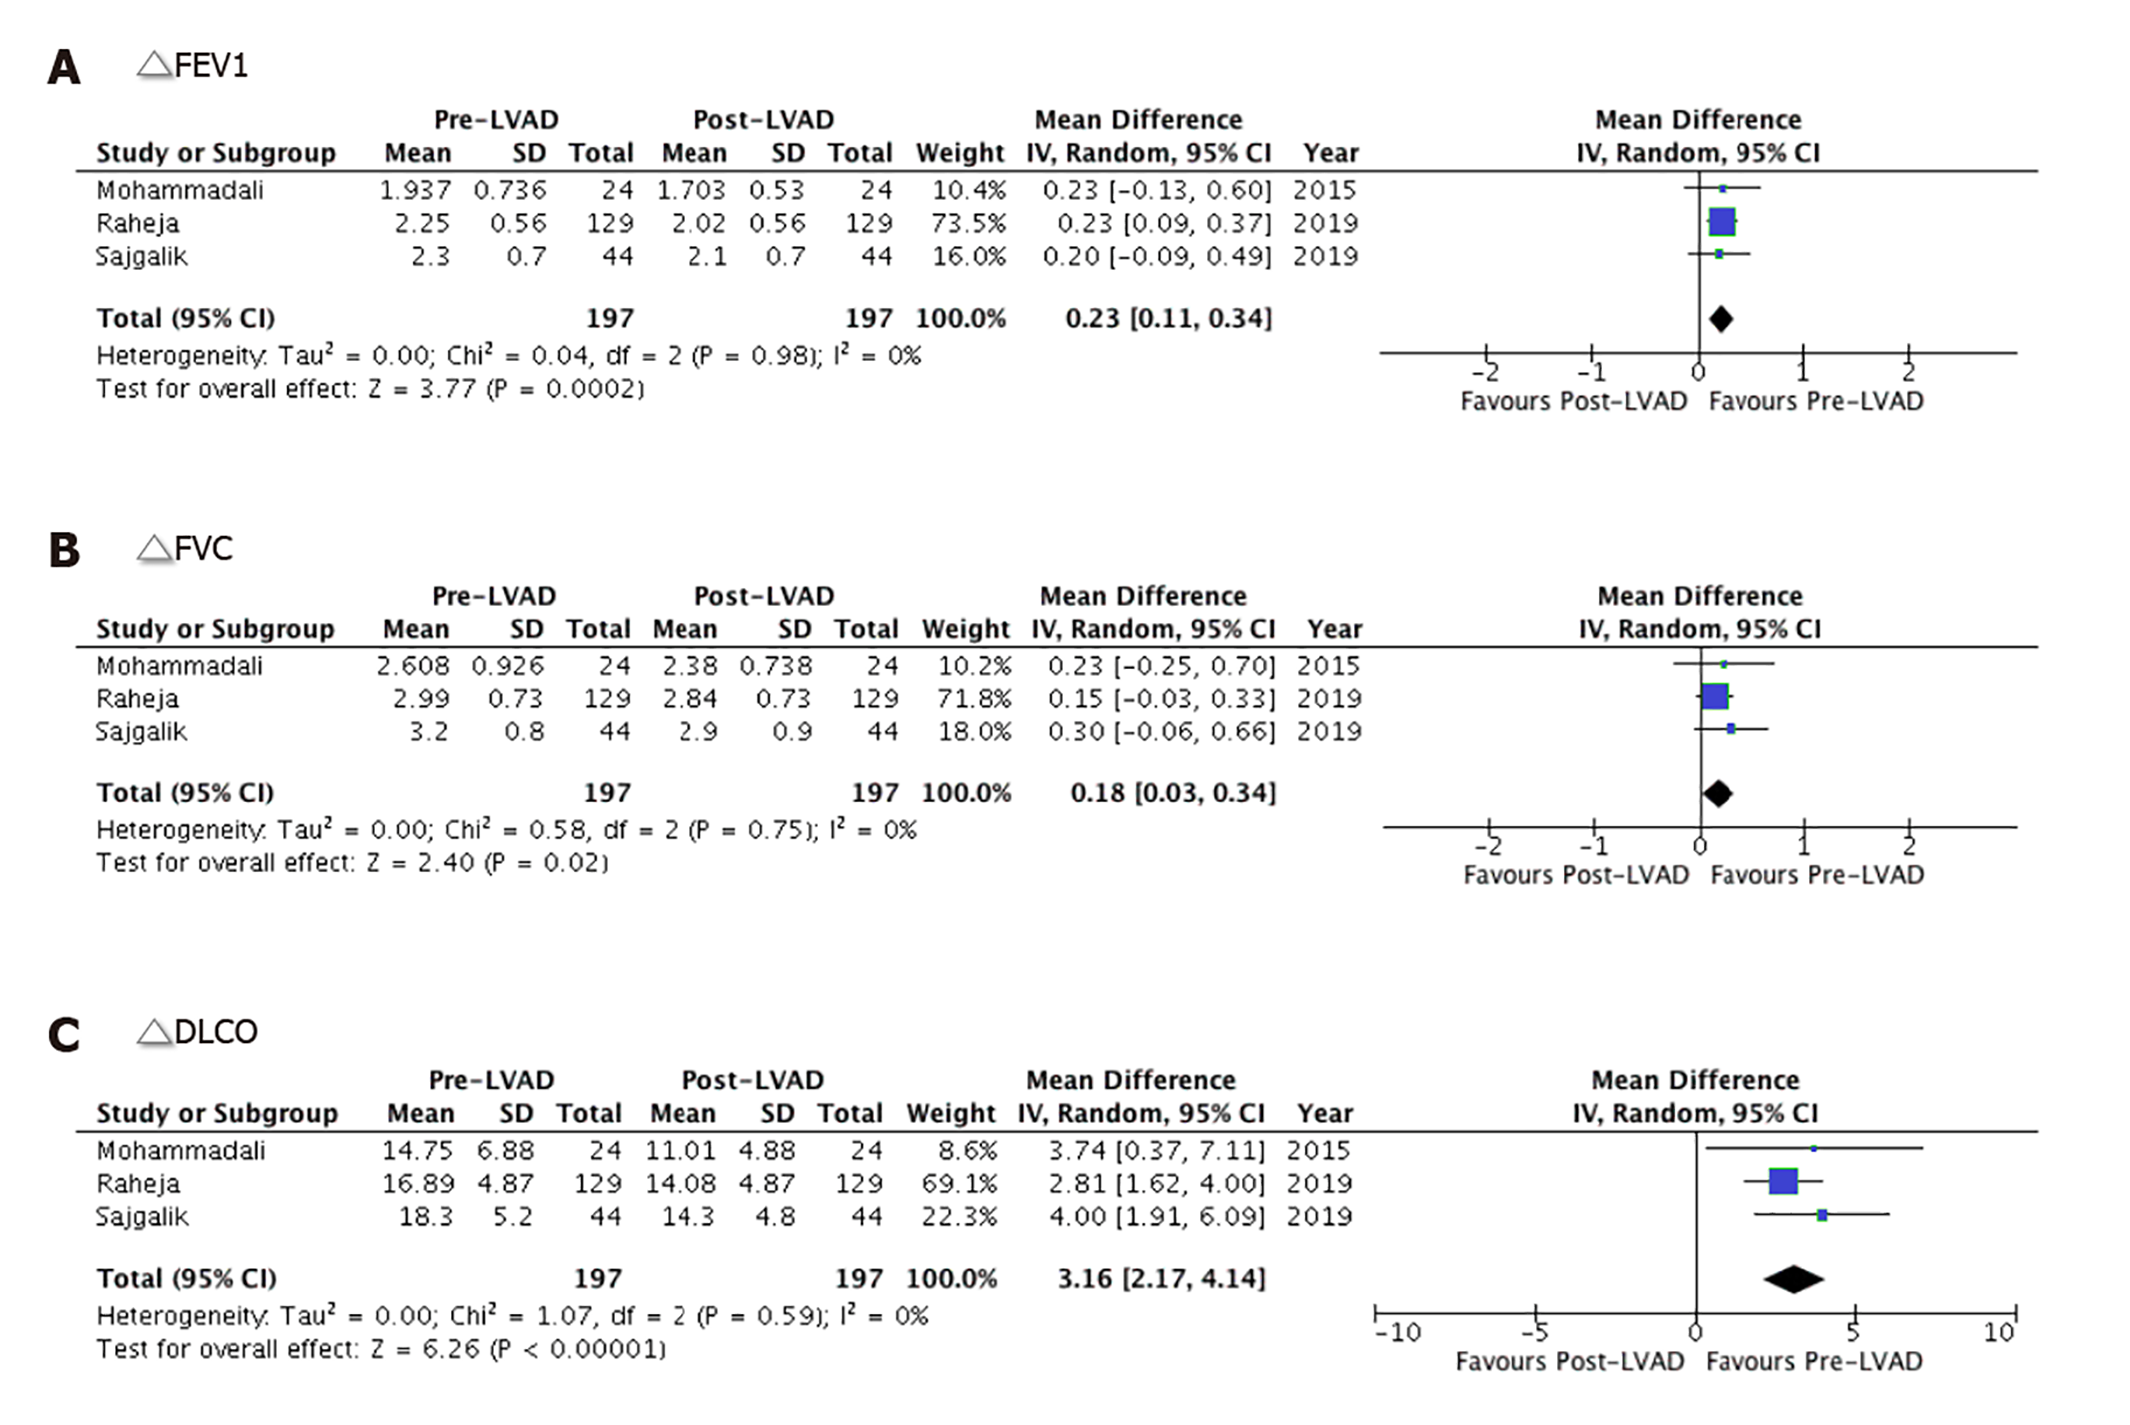
Figure 3 Forest plot depicting the pooled mean difference of forced expiratory volume in one second (A), forced vital capacity (B) and diffusion lung capacity of carbon monoxide (C) between pre- and post-left ventricular assist device patients.
FEV1: Forced expiratory volume in one second; FVC: Forced vital capacity; DLCO: Diffusion lung capacity of carbon monoxide; LVAD: Left ventricular assist device.
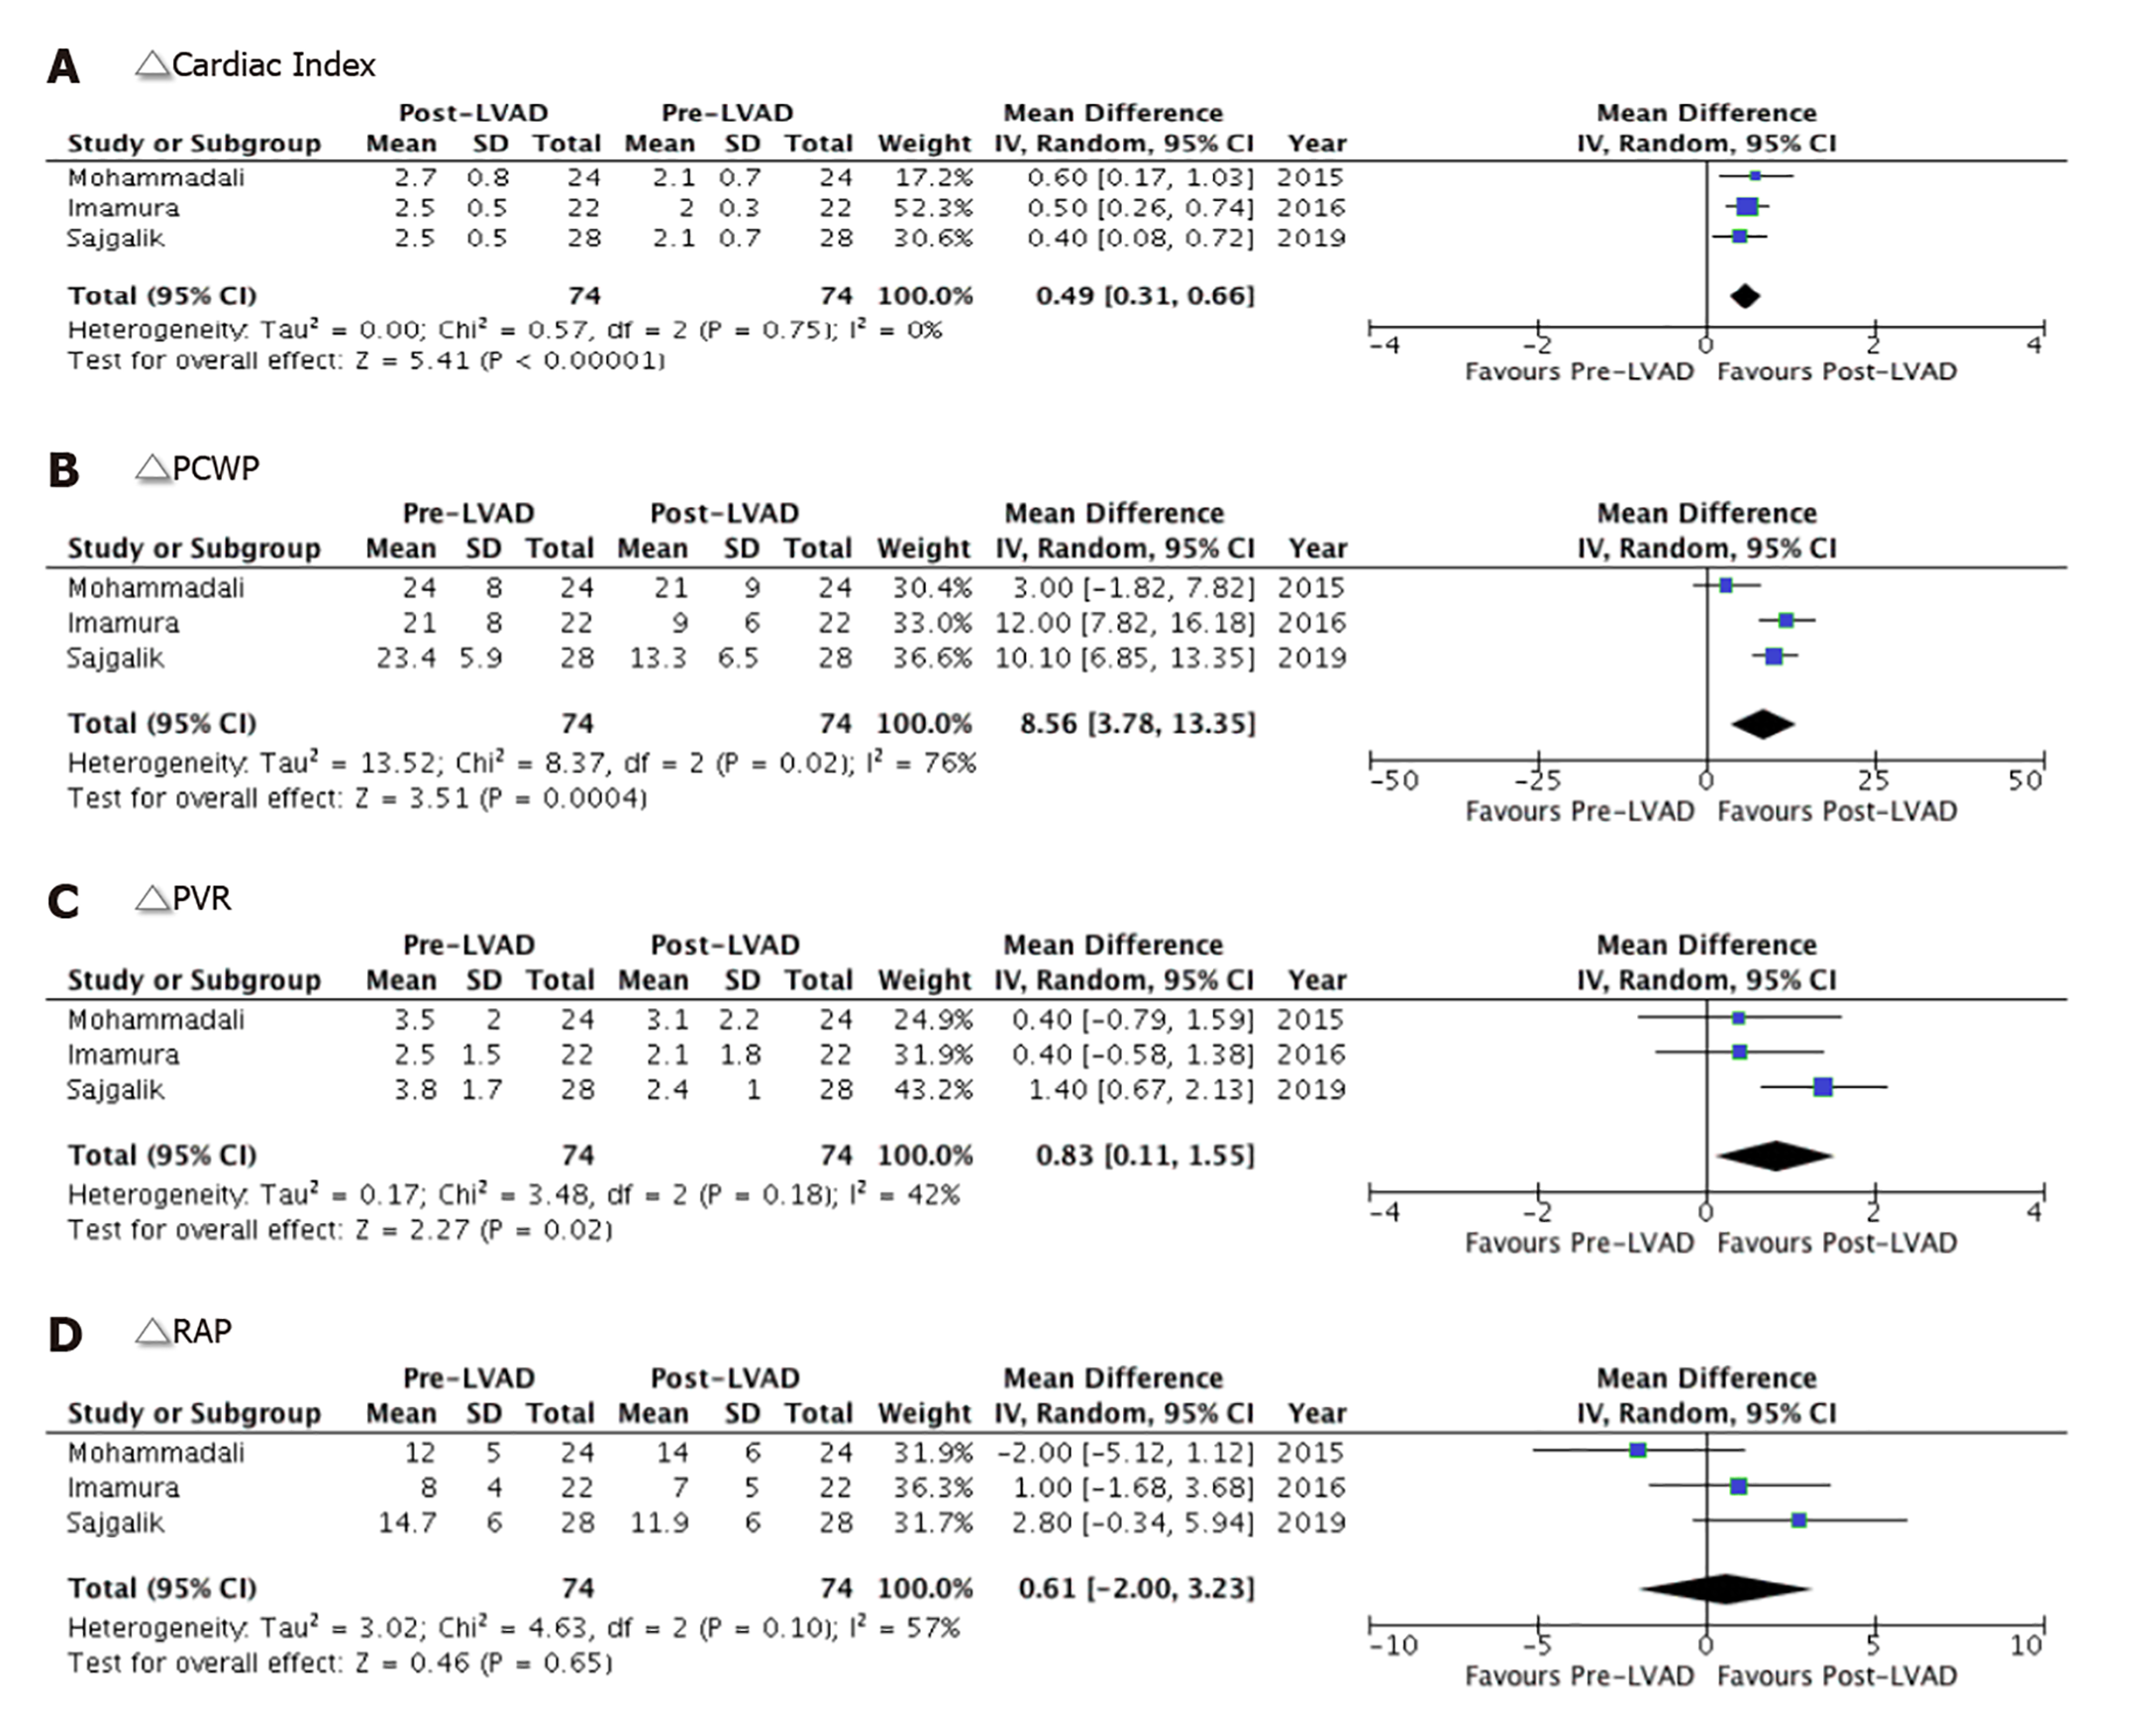
Figure 4 Forest plot showing pooled comparison of mean difference in cardiac index (A), pulmonary capillary wedge pressures (B), pulmonary vascular resistance (C), and right atrial pressure (D) between pre- and post-left ventricular assist device groups.
PCWP: Pulmonary capillary wedge pressures; PVR: Pulmonary vascular resistance; RAP: Right atrial pressure; LVAD: Left ventricular assist device.
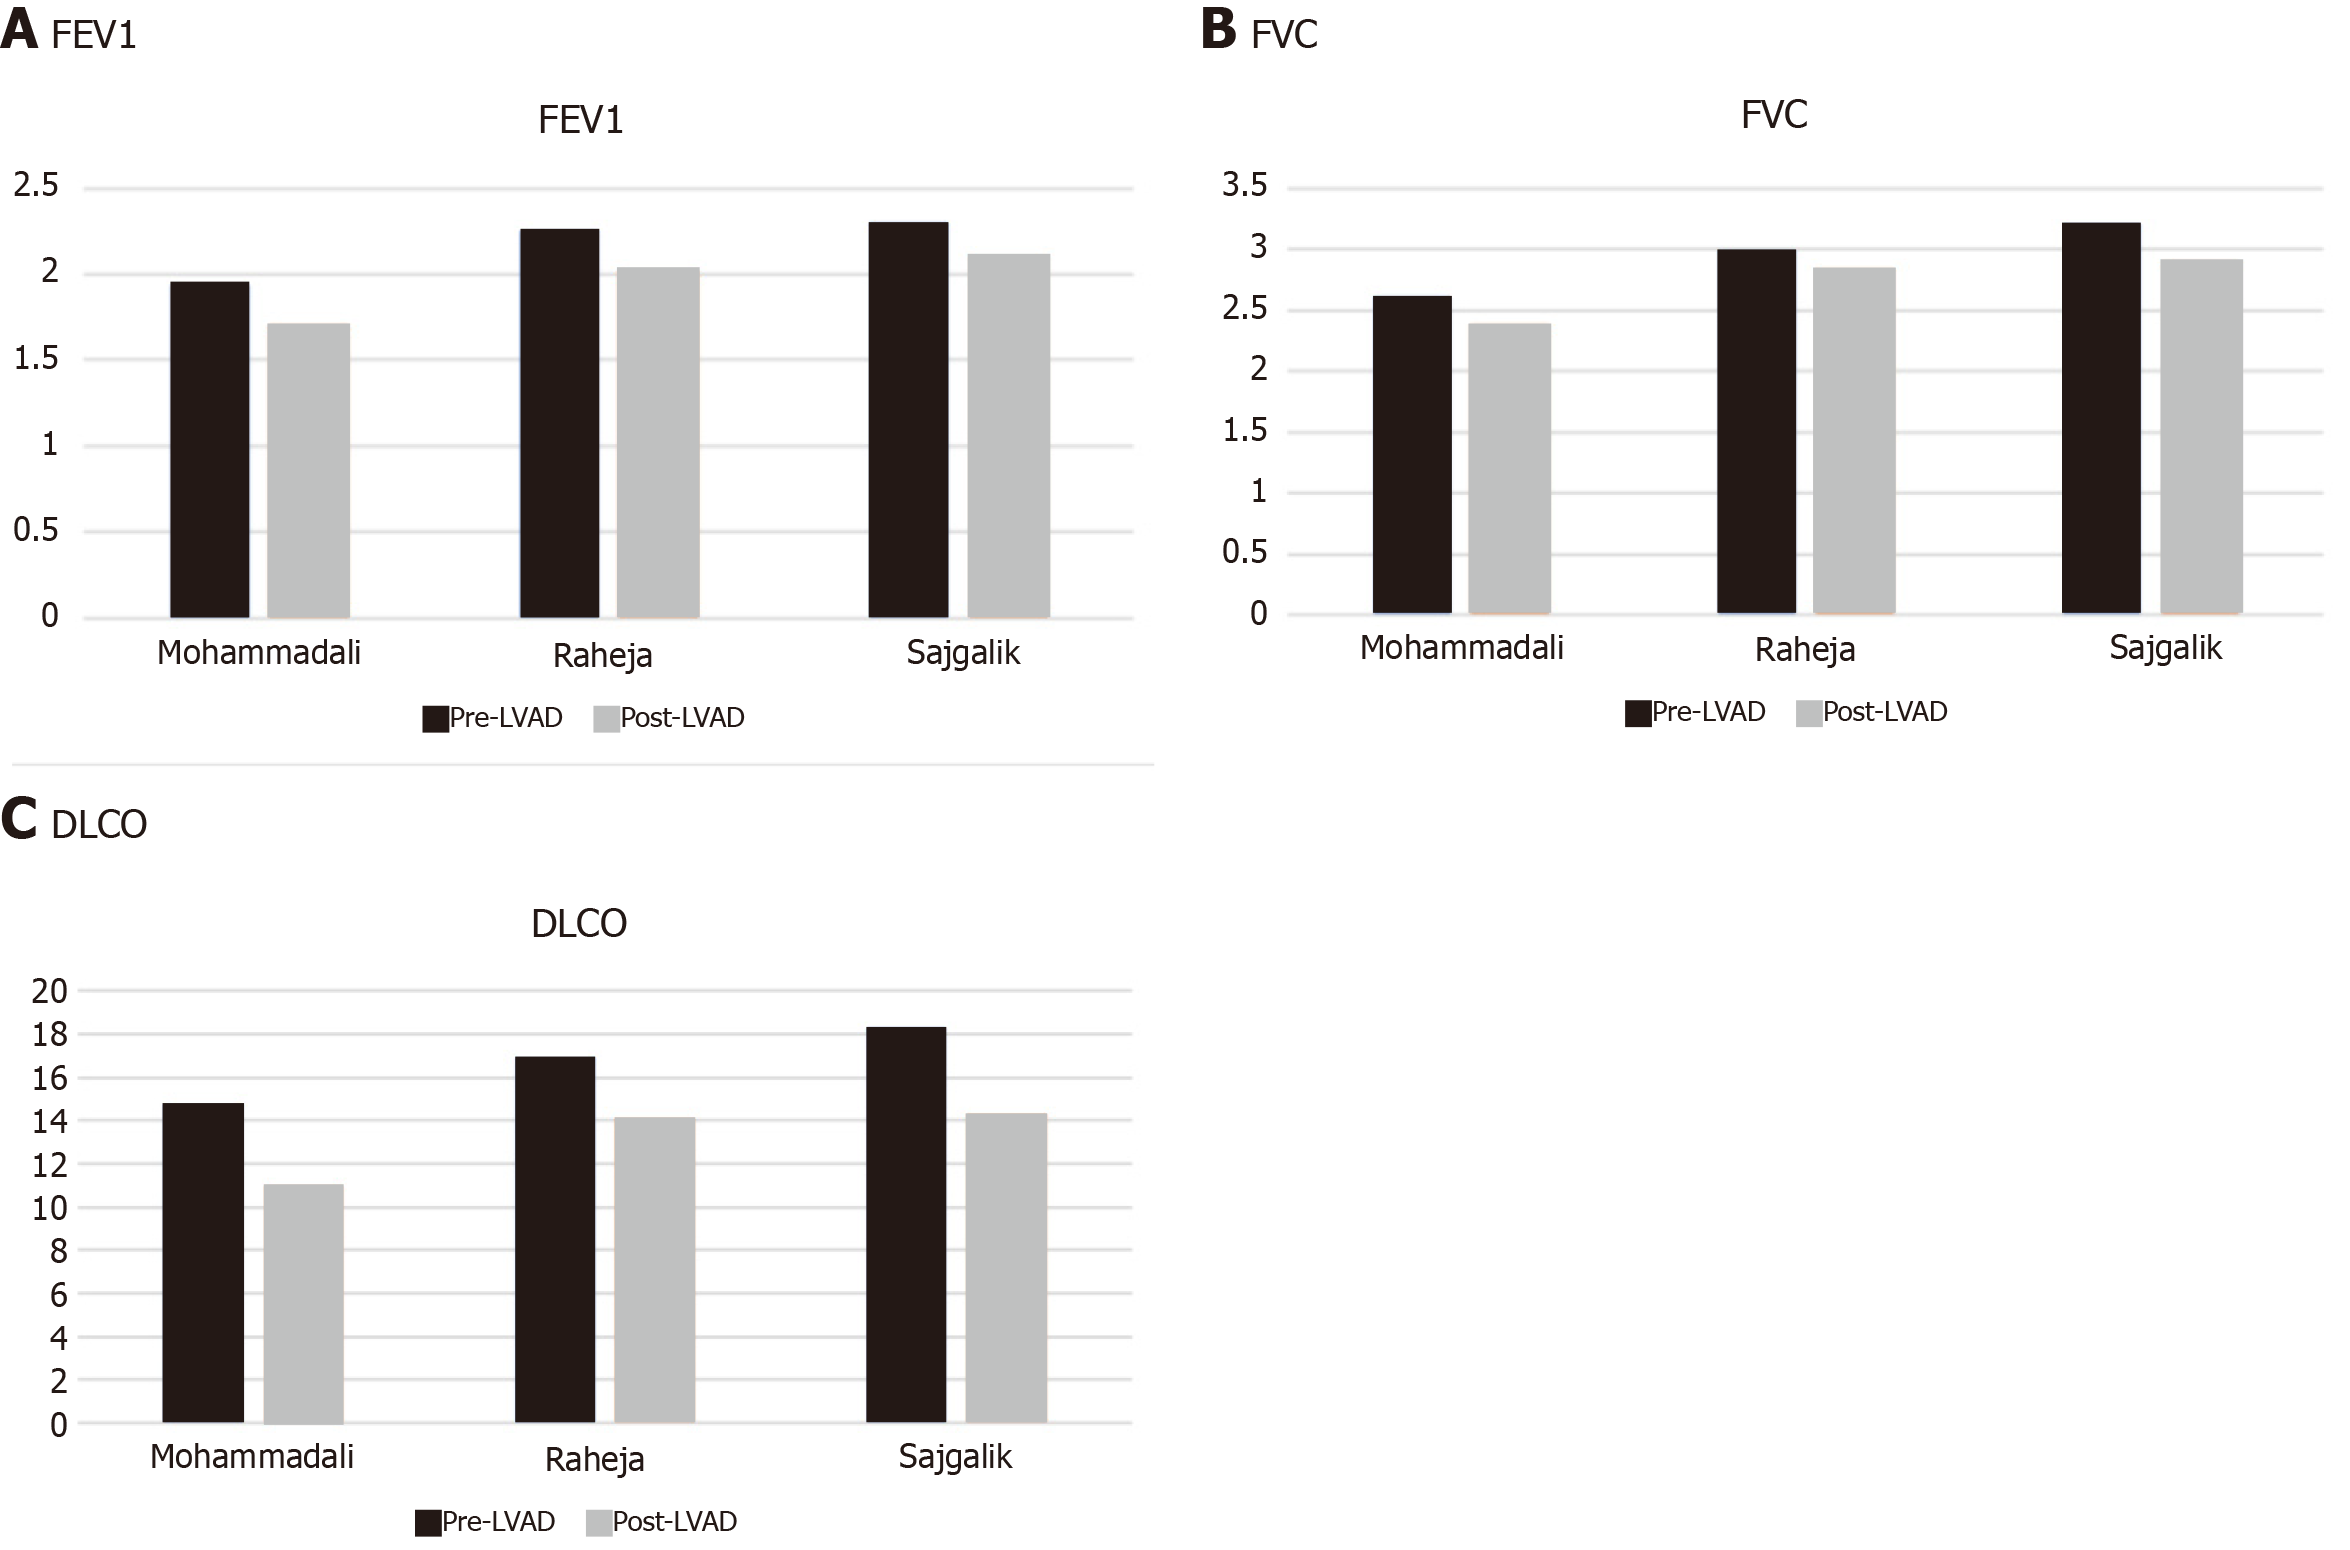
Figure 5 Trend of decrease in forced expiratory volume in one second (A), forced vital capacity (B), and diffusion lung capacity of carbon monoxide (C) in the included studies.
FEV1: Forced expiratory volume in one second; FVC: Forced vital capacity; DLCO: Diffusion lung capacity of carbon monoxide; LVAD: Left ventricular assist device.
- Citation: Ullah W, Meizinger C, Ali Z, Panchal A, Saeed R, Haas DC, Rame E. Effects of left ventricular assist device on pulmonary functions and pulmonary hemodynamics: A meta-analysis. World J Cardiol 2020; 12(11): 550-558
- URL: https://www.wjgnet.com/1949-8462/full/v12/i11/550.htm
- DOI: https://dx.doi.org/10.4330/wjc.v12.i11.550


